The bushfires raging across Australia are likely to lead to elevated mortgage arrears in the coming months and, if weather-related “peril events” continue to become a more regular occurrence, they could reshape the standard arrears fluctuations expected throughout the year, according to a new report from S&P Global Ratings, via Australian Broker.
“Mortgage arrears typically increase
during the summer period, reflecting the pre- and post-Christmas
spending and extended holiday season, before declining during the second
quarter,” the report reads.
“If the longevity and intensity of
bushfire seasons become a more regular occurrence, arrears could remain
elevated for longer periods in drought-prone areas due to the flow-on
effect of bushfire devastation on local employment conditions.”
Local employment conditions such as
tourism and agriculture are expected to be impacted, causing
debt-serviceability pressures for affected borrowers.
This dynamic will be further compounded in
areas with drought conditions, or where agriculture forms a large part
of local employment, with arrears predicted to remain elevated for an
even longer period of time.
Lenders to borrowers in affected areas
will likely experience an increase in financial hardship claims, which
they are obliged to consider under consumer laws and banking codes.
Possible concessions can include a reduction in the interest rate or
payment, lengthening of loan maturity, or full or partial deferral of
interest for a temporary period.
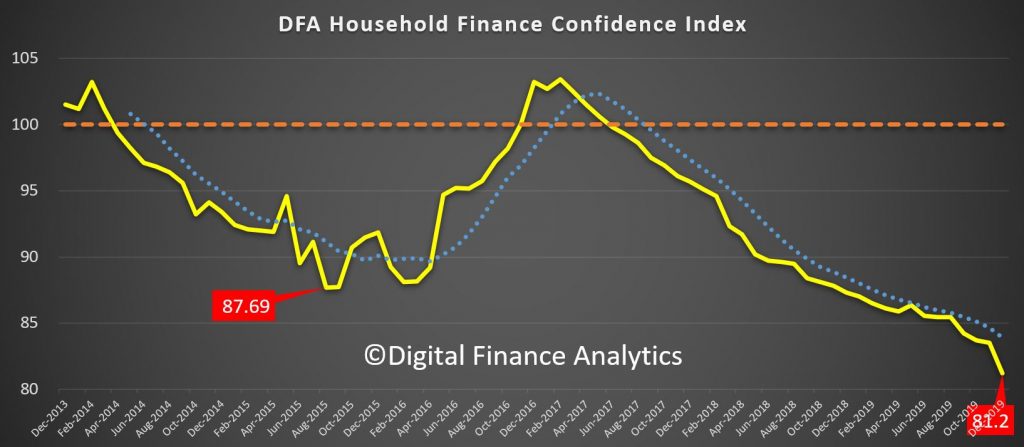
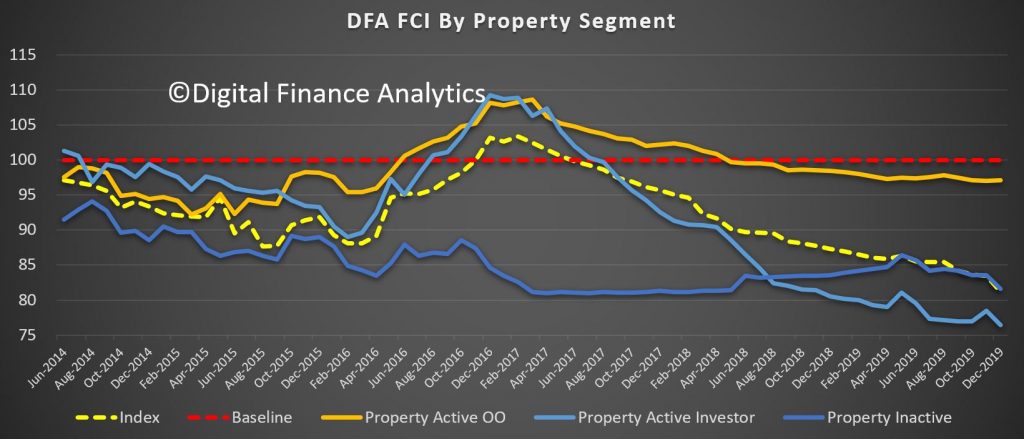
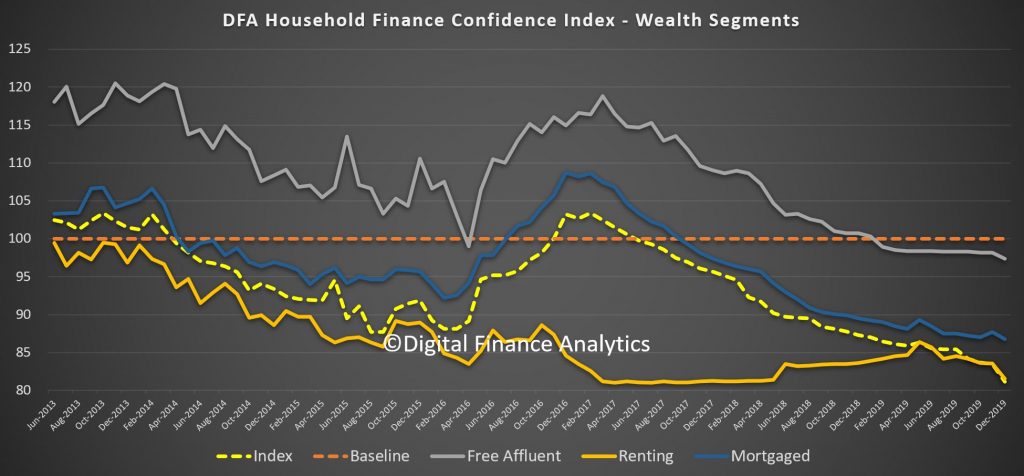
DFA is releasing the latest in our 52,000 household survey series examining household financial confidence. The score to mid January is an all-time low of 81.2, well below the neutral setting and the previous low back in 2015.
A series of events, including the bushfires and the perceived weakness in the Federal Government response, the volatility of the financial markets, and weak Christmas spending are all taking their toll. It is the biggest movement we have seen in the monthly series, so we expect a rebound next time, perhaps. But weak wages growth remains the underlying cause.
The survey did not reach those in the regional areas impacted by the bushfires directly, but is still statistically reliable elsewhere.
By way of background, these results are derived from our household surveys, averaged across Australia. We have 52,000 households in our sample at any one time. We include detailed questions covering various aspects of a household’s financial footprint. The index measures how households are feeling about their financial health. To calculate the index we ask questions which cover a number of different dimensions. We start by asking households how confident they are feeling about their job security, whether their real income has risen or fallen in the past year, their view on their costs of living over the same period, whether they have increased their loans and other outstanding debts including credit cards and whether they are saving more than last year. Finally we ask about their overall change in net worth over the past 12 months – by net worth we mean assets less outstanding debts.
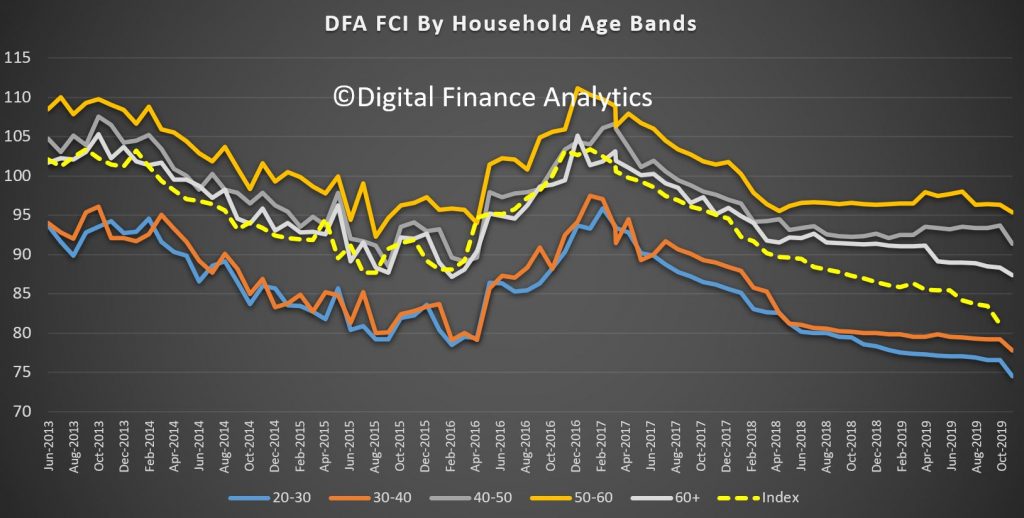
Looking across the age bands, all household cohorts dropped, though younger households more so than older groups. Those aged 40-50 showed a significant fall. So this is a broad-based decline.
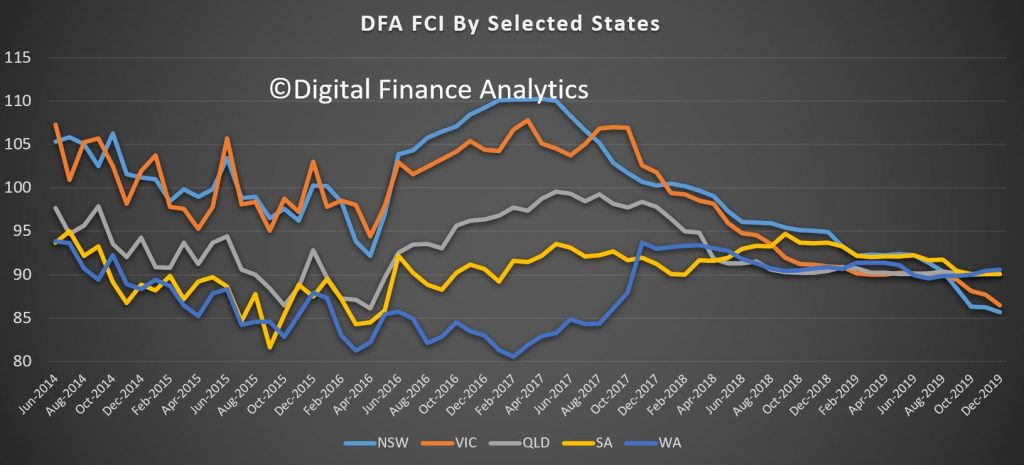
Across the states households in NSW and VIC dropped the most, and VIC was significantly impacted. These two states are net lower now than QLD, WA and SA, due to largest decline over the past year. Major urban centres here have been hit by smoke haze and poor environmental conditions which have really brought home the severity of the current bushfires. Plus jobs are an issue, and wages weak.
All property segments took a hit, but owner occupied households less so than property inactive (renting or living with friends or family) or property investors. Property investors continue to report weak rental returns, and higher vacancies, and little if any capital growth.
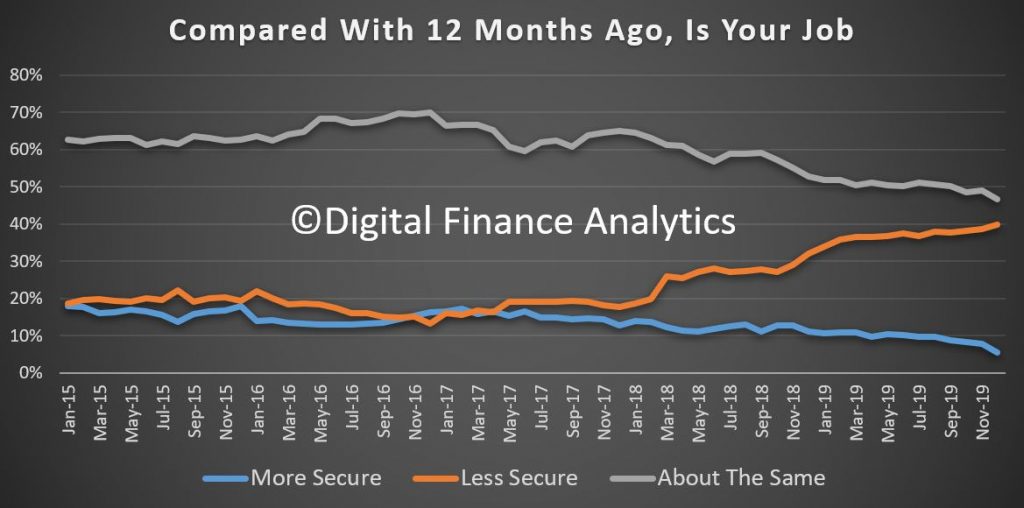
Looking at the moving parts within the index, those feeling more positive about job security fell 2.48% to 5.35, and those feeling about the same dropped by 2.35%, while those feeling less secure rose by 1%. This is caused by more underemployment (including bushfire related), more zero hours and gig economy jobs, and more households working in multiple part-time jobs. Retail, construction and tourism were specifically hit, as well as the agricultural sector. Those employed in the small business sector are specifically exposed.
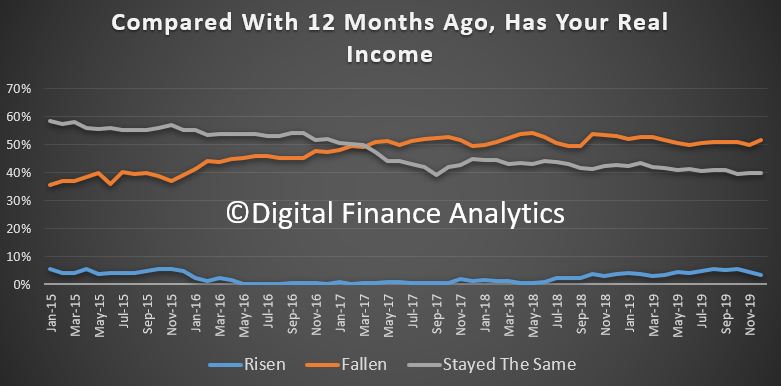
As a result of the jobs issues, plus no growth, income is also under pressure. More than half of households reported lower income than a year ago, up 1.74%. Only 3% reported a real rise, down 0.98%, while 40% saw no change. These income pressures are significant and mounting. Those relying on income from bank deposits are seeing returns being trashed, but many households are not willing to switch to higher risk alternatives, preferring to trim their spending instead.
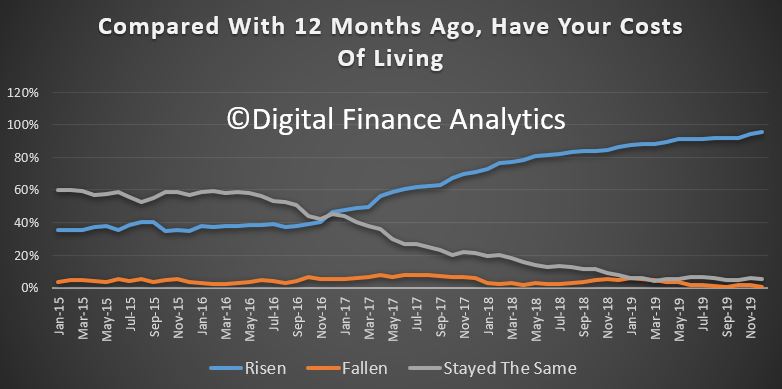
On the other hand, costs of living continue to outpace wages growth. A massive 95% of households reported higher costs than a year ago, up 1%. Costs are increasing across food staples (thanks partly to the drought and supply issues), school fees, childcare, healthcare, power and fuel. More households are considering cutting back on health insurance, and are seeking cheaper goods more generally. Those accessing food banks and other charitable assistance rose significantly.
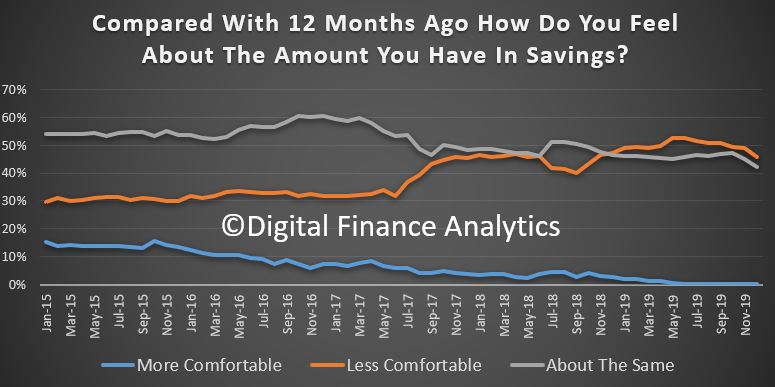
Those with savings are continuing to dip into them to support their finances, though this is not necessarily sustainable. Those who received tax refunds, or some relief from lower mortgage rates are preferring to save the funds, or repay debt. They have no intention of increasing spending. Those with stocks and shares, or bonds – who tend to be more affluent – are fairing better, but even here, returns are under pressure from bank stocks. Concerns about the security of the banking system are on the rise.
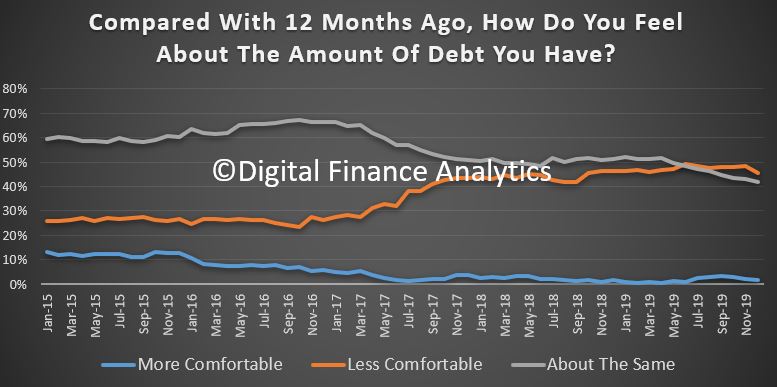
The impact of lower interest rates have assisted at the margin, but two thirds of households receiving a cut preferred to maintain their original payments, thus paying off debt faster. However those in financial difficulty were able to extend their credit line, though multiple credit cards, personal loans, and structured payments like Afterpay. In addition, demand for short-term loans rose. As a result only 2% of households were more comfortable with their debts than a year ago, 46% less comfortable and 42% about the same.
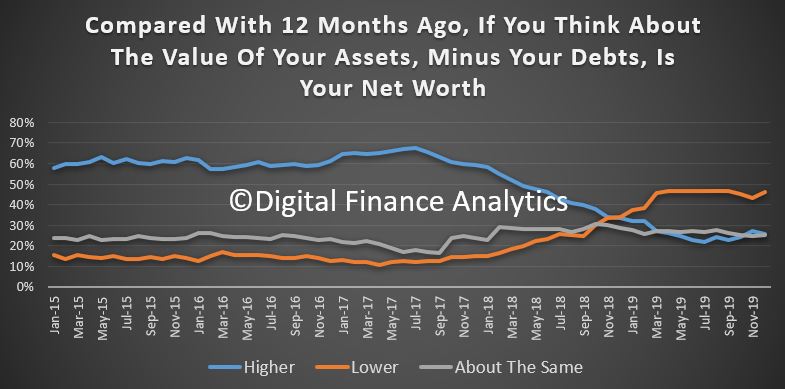
Household net worth – assets minus debts – remain under pressure, with higher stock and property values for some offsetting pressures elsewhere. One quarter of households said their net worth was higher than a year ago (remembering that home prices dropped in the first half of 2019), while 46% said their net worth was lower now, and one quarter said there was no change.
Looking across our wealth segments, all three dropped, though those holding property, but no mortgage were relatively more positive (though below neutral) compared with those with mortgages or those renting.
This is a serious signal of more economic trouble ahead, despite the fact that now the Federal Government has announced $2 billion in stimulus, plus state money, charitable donations and Government benefits for those impacted by the bushfires. However, the structural issues surrounding flat or falling real incomes and rising costs signals more financial pressure ahead. And as a result, we expect retail to remain slow, despite lower mortgage rates. We suspect the anomaly of strongly rising property prices (where they are occurring) will abate ahead. In many areas, though there has been no, or only a very limited recovery.
As a result, growth will remain anemic for some time yet, and household confidence will remain in the doldrums, though we would expect to see a small bounce next month as the bad news around the bushfires is absorbed. We think more fiscal stimulus will be required to turn this round, but the key is real wages growth, and we cannot see a route to that for some time yet.
We look at the latest estimates for the costs of the bushfires, especially as they relate to tourism, and consider the problem of smoke pollution, which is something which Australia has been battling for years, but which appears to be at a new level now.
As we commence a series on the Deposit Insurance Scheme and Deposit Bail-In, we reprise a show we recorded in 2018 on the DFA channel where Economist John Adams and Analyst Martin North looks at the bones of the scheme. What are the risks?
We look at the latest ABS Retail Turnover data. It was stronger than expected, thanks to Black Friday sales, but the overall state of retail is still weak.