Is a cashless society worth it?

As the country continues its inexorable march towards a cashless society, it’s important to remember the downsides. Via The Adviser.

Australia has been just a few years away from being a cashless society for a couple of decades now, but it will eventually get there. Legislation currently before the Senate aims to ban transactions over $10,000 in a bid to hinder the black economy. From there, it’s not difficult to imagine that the ubiquity of digital payment systems – and efforts the by government – will see hard cash disappear at some point in the future. 

One of the supposed benefits of a cashless society is that it cuts down on crime, the logic being that if there’s less cash to steal, less cash is stolen. Laundering dirty money is also harder, as every transaction is logged in some form or another. 

But a cashless society comes with a number of negatives that might well outweigh the positives. 

“As payments move online, there would be an increased risk of crimes such as identity theft, account takeover, fraudulent transactions and data breaches, due to the higher volume of cashless transactions and more points of exposure for the average consumer,” Dr Richard Harmon, managing director of financial services at Cloudera, told Investor Daily.

“Hackers and other criminals now have new ways to get access to accounts and to potentially set up synthetic accounts to facilitate more sophisticated money laundering activities.”

And that’s just the risk posed by hackers. According to the UK’s access to cash report, a cashless society could heighten the risks of financial abuse. Elderly people, who might lack understanding of digital technology, would be particularly vulnerable. Couples with joint bank accounts are also at risk – money can be tracked and controlled by one person. These issues are already of great concern, but they’d be even worse in a cashless society. 

That’s not to mention that digital systems rely on topnotch digital infrastructure, something that Australia doesn’t exactly have in spades. That infrastructure also has to be more or less impervious to cyber attacks, which may be carried out by state-sponsored actors with an interest in crippling a country’s entire financial system. In the face of that existential threat to the economy, a little bit of money laundering doesn’t seem so bad. 

A cashless society could also make things worse for workers and the most vulnerable. It’s only a short jump from cashless to “cashier-less”, and a cashless society would have to deal with an explosion of unemployed low-skill individuals. 

Meanwhile, those who lack access to banks – or prefer not to use them – are also at risk. 

“Let me highlight that one of the concerns about becoming a cashless society – at least as we transition into this state – is the ability for the underbanked or unbanked to have sufficient access to function properly as they would within a cash-based system,” Dr Harmon said.

“This would be a key concern from a societal perspective.”

The idea of a cashless society is promising. But hidden in that promise are a number of caveats that any country – let alone Australia – would be foolish to ignore.

RBNZ Imposes Higher Capital

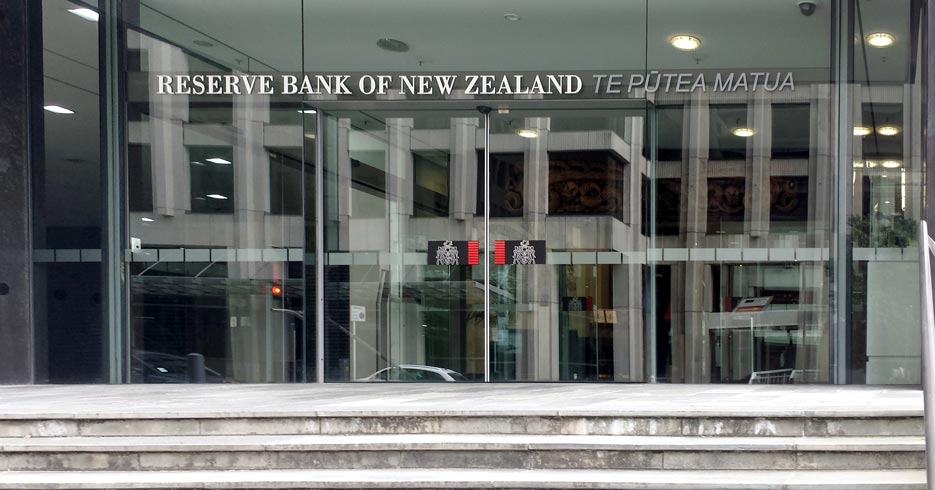
The Reserve Bank of New Zealand today released its final decisions following its comprehensive review of its capital framework for banks, known as the Capital Review. The trajectory will be over a longer period, with more flexibility, but the banks will still need to hold more capital.

Governor Adrian Orr said the decisions to increase capital requirements are about making the banking system safer for all New Zealanders, and will ensure bank owners have a meaningful stake in their businesses. The changes will be implemented over seven years, giving plenty of time for banks to manage a smooth transition and minimise any adjustment costs.

“Our decisions are not just about dollars and cents. More capital in the banking system better enables banks to weather economic volatility and maintain good, long-term, customer outcomes,” Mr Orr says.

“More capital also reduces the likelihood of a bank failure. Banking crises cause not only harmful economic costs but also distressful social issues, such as the general decline in mental and physical health brought about by higher rates of unemployment. These effects are felt for generations,” Mr Orr says.

The key decisions, which start to take effect from 1 July 2020, include banks’ total capital increasing from a minimum of 10.5% now, to 18% for the four large banks and 16% for the remaining smaller banks. The average level of capital currently held by banks is 14.1%.

Relative to the Reserve Bank’s initial proposals, the final decisions also include:

  • More flexibility for banks on the use of specific capital instruments;
  • A more cost-effective mix of funding options for banks;
  • A lesser increase in capital for the smaller banks consistent with their more limited impact on society should they fail;
  • A more level capital regime for all banks – with the four large banks having to measure the risks of their exposures (lending) more conservatively, more in line with the smaller banks; and
  • More transparency in capital reporting.

The adjustments to the original proposals reflect our analysis and industry feedback over the past two years. All of these changes will be phased in over a seven-year period, rather than over five years as originally proposed, in order to reduce the economic impacts of these changes.

Deputy Governor and General Manager of Financial Stability Geoff Bascand says the decisions were shaped by valuable public input and insight received through an unprecedented number of submissions as well as public focus groups. Three international experts also provided supportive perspectives on the proposals.

“We’ve listened to feedback and reviewed all the data, and are confident the decisions are the right ones for New Zealand,” Mr Bascand says.

“We have amended our original proposals in a number of ways so we achieve a high level of resilience at lower potential cost, with a smoother transition path for all participants. Our analysis shows that the benefits of these changes will greatly outweigh any potential costs.”

“Following the Global Financial Crisis, many regulators around the world have been taking steps to improve the safety of their banking systems. We’re confident we have the calibrations right for New Zealand conditions. These changes will be subject to monitoring, with the Reserve Bank reporting publicly on implementation during the transition period,” Mr Bascand says.

APRA proposes major uplift in transparency around banking data

The Australian Prudential Regulation Authority (APRA) has proposed substantially increasing the volume and breadth of data it makes publicly available on authorised deposit-taking institutions (ADIs), including banks, credit unions and building societies.

The move towards greater transparency and scrutiny of the banking sector is aimed at increasing accountability, supporting competition and lifting overall industry standards.

In a letter to industry today, APRA outlined plans to determine that all data collected for its quarterly ADI publications should be considered non-confidential, allowing it to be published. APRA currently publishes less than 1 per cent of the ADI data it collects due to legal restrictions contained within the Australian Prudential Regulation Authority Act 1998 (APRA Act). This change would allow APRA to significantly increase this figure.

From 2020, APRA proposes publishing:

  • entity-level ADI data related to currently published industry-level quarterly data;
  • remaining historical data in these forms that individual ADIs are required to provide APRA, which will be published with a three-year lag; and
  • commentary received by APRA from individual ADIs explaining material revisions to, or large movements in, their data.

The proposal supports APRA’s strategic policy of increasing the transparency of data it collects, and aligns with Government open data policies.

APRA’s Executive Director for Cross-Industry Insights and Data, Sean Carmody, said: “APRA is committed to increasing transparency about the institutions and industries we regulate.

“Under these proposed changes, APRA intends to publish – for the first time – a range of information about individual ADIs, including their financial performance and property exposures.

“As with the recent inclusion of data from credit unions and building societies in our Monthly ADI Statistics publication, these changes are aimed at further strengthening the ADI sector by enhancing accountability and encouraging competition. They will also assist other regulatory agencies that rely on APRA data, as well as analysts, policymakers and others who use our publications.”

Under the APRA Act, APRA must consult ADIs and their representatives, including industry associations, before determining any new data to be non-confidential. A 12 week consultation is now underway and concludes on 28 February 2020. APRA is encouraging all interested parties to make submissions on issues including what, if any, data should remain confidential.

APRA intends to consult on forms not included in this consultation at a later date.

More details on the consultation, including the letter to industry, can be found at: https://www.apra.gov.au/confidentiality-of-data-used-adi-quarterly-publications-and-additional-historical-data

GDP Hotspots

Courtesy of Nucleus Wealth’s Damien Klassen. Damien runs the investment side of Nucleus, selecting stocks suggested by analysts and implementing the asset allocation

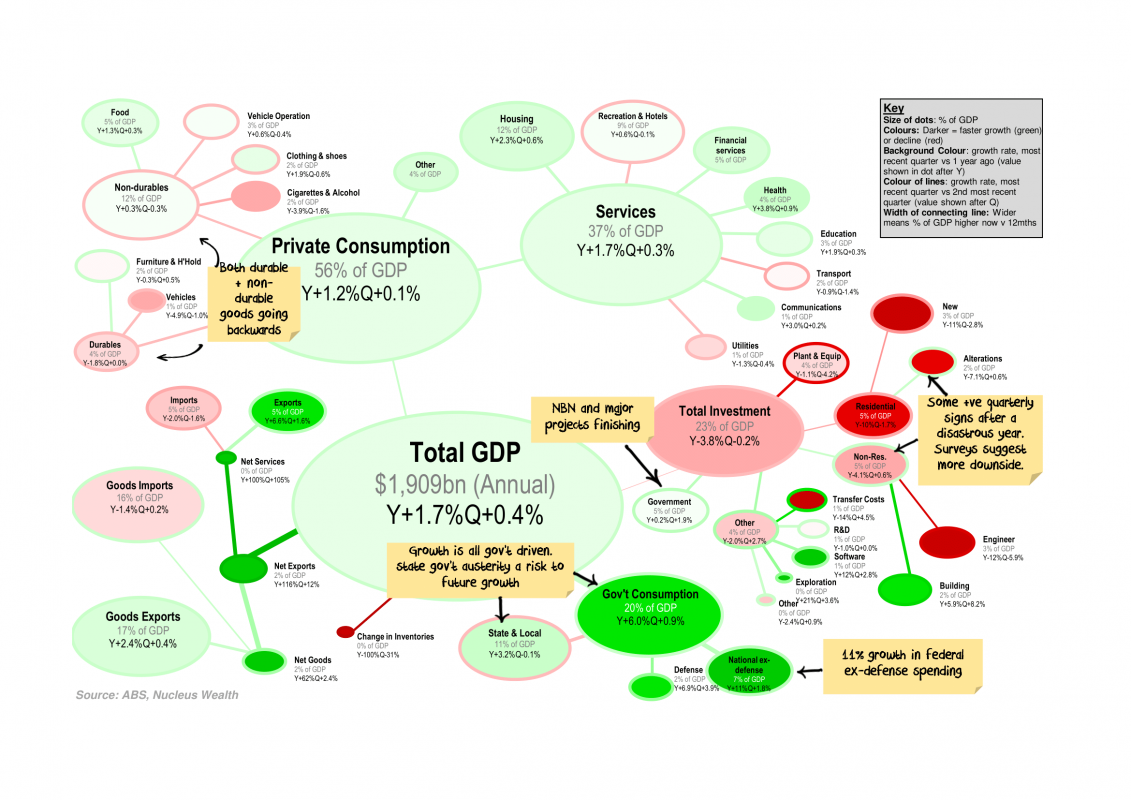
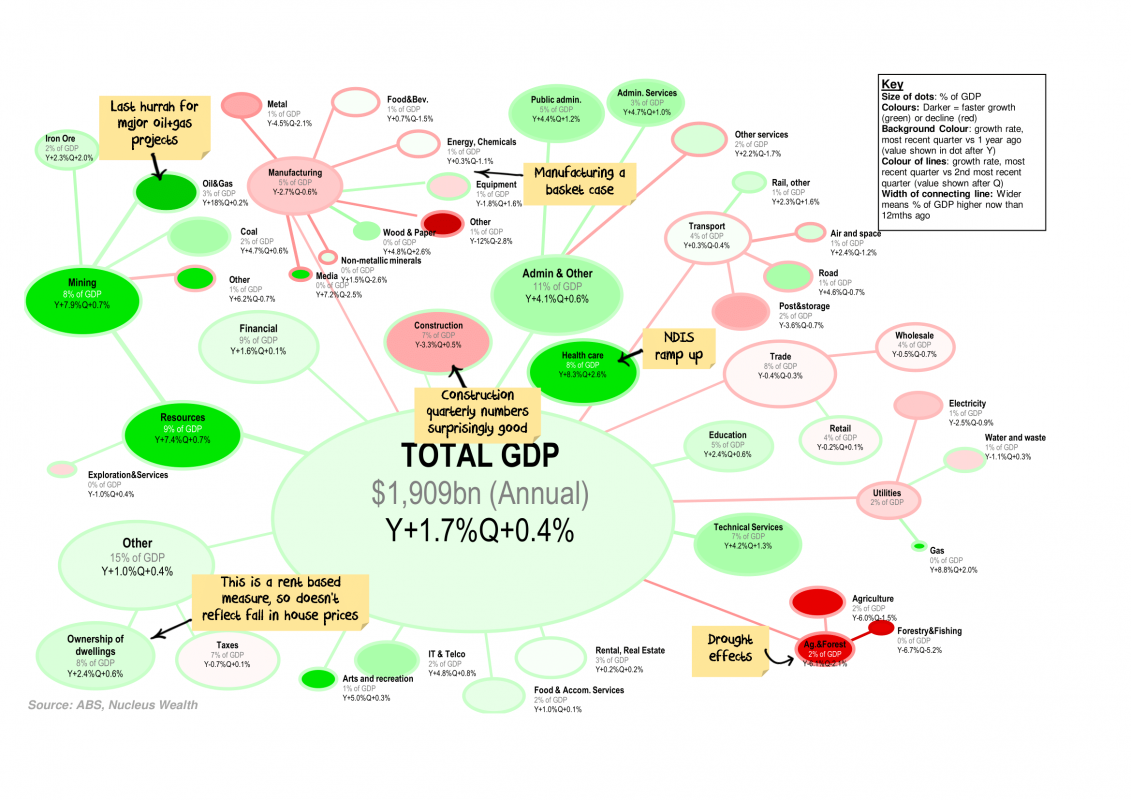
Every quarter I like to look at the changes in Australian GDP and which categories are responsible for the growth / decline. Each bubble represents a category of GDP proportionate to its size, colours represent the growth rate.

Click the charts for a large version and commentary: 

Graphical representation of Australian GDP or Gross Domestic Product
Click for large version

This quarter the key takeaways include:

  • Federal Government spending (+11% for non-defence, 7% for defence over the year) the only thing keeping GDP above zero.
  • Investment growth was not good, but I was expecting worse. Possibly there are green shoots, but capex surveys and investment forward indicators suggest there is still more downside.
  • State & Local government spending has turned negative – with a low number of property transactions this is likely to remain a feature
Graphical representation of Australian GDP or Gross Domestic Product
Click for large version

Retail Turnover Nowhere

Australian retail turnover was relatively unchanged (0.0 per cent) in October 2019, seasonally adjusted, according to the latest Australian Bureau of Statistics (ABS) Retail Trade figures. The retail recession continues, and now the question becomes, will the summer holidays and Christmas change anything ahead?

This follows a rise of 0.2 per cent in September 2019.

“There were falls for clothing, footwear and personal accessory retailing (-0.8 per cent), department stores (-0.8 per cent) and household goods (-0.2 per cent),” said Ben James, Director of Quarterly Economy Wide Surveys.

“These falls were offset by rises in cafes, restaurants and takeaway food services (0.4 per cent) and food retailing (0.1 per cent). Other retailing was relatively unchanged (0.0 per cent).”

In seasonally adjusted terms, there were mixed results across the states. Victoria (-0.4 per cent), New South Wales (-0.2 per cent), and South Australia (-0.5 per cent) fell, while Queensland (0.4 per cent), Tasmania (1.4 per cent), the Northern Territory (2.3 per cent), Western Australia (0.2 per cent), and the Australian Capital Territory (0.3 per cent) rose in seasonally adjusted terms in October 2019.

The trend estimate for Australian retail turnover rose 0.2 per cent in October 2019, following a 0.2 per cent rise in September 2019. Compared to October 2018, the trend estimate rose 2.3 per cent.

QE could drive populism rather than the economy

The Reserve Bank will consider quantitative easing once rates fall to 25 basis points. It’s a tool that has been used by other countries, often with devastating consequences for society. Via InvestorDaily.

Australia is in uncharted territory, economically speaking. We’re latecomers to the low-rate party and we’re still getting used to it. Home owners are loving it but retailers are not. Unemployment is low but a record number of Aussies want to work more. It’s a strange time. 

The Reserve Bank of Australia only has a few options left if it fails to hit its inflation target and lift economic growth. It can continue to reduce the cash rate and even go into negative rates, as the European Central Bank (ECB) had done. The ECB benchmark deposit rate was cut by 10 basis points in September to negative 0.5 per cent. The ECB also reintroduced its quantitative easing program of buying 20 billion euros ($32 billion) worth of government and corporate bonds every month in an effort to prevent the European economy from sliding off a cliff. 

The ECB has been using QE on and off since 2009 in an effort to lift inflation. In 2015 the central bank began purchasing 60 billion euros worth of bonds each month. This increased to 80 billion euros in April 2016 before coming back down to 60 billion a year later. 

In the UK, the Bank of England bought gilts (British government bonds) and corporate bonds during its QE program during the global financial crisis in 2009. QE programs also took place in 2011 and 2016.

Meanwhile, the US Federal Reserve has undertaken three separate rounds of QE, the last of which it began tapering in June 2013. The US halted its program in October 2014 after acquiring a total US$4.5 trillion of assets. 

When a QE program takes place, a central bank begins buying securities with money that didn’t exist before the QE process began. They are essentially printing money and giving it to large corporates and the government through the purchase of these bonds, the logic being that the proceeds will be used to buy new assets (like mortgages) and invest, which in turn will drive the economy. 

The money doesn’t directly hit the wallets of consumers. Unlike “helicopter money”, which the Rudd government dished out during the financial crisis, QE has a much more indirect impact on consumers. Financially speaking. 

But the broader political and social impacts have had a lasting psychological effect on the populations of Europe and the US.

“If we look at the experience offshore, QE has been great at raising the level of assets in conjunction with a permanently lower interest rate,” Fidelity International’s Anthony Doyle said this week. 

“QE has stimulated asset price growth. The ‘haves’ have benefited compared to the ‘have nots’; income inequality has grown across the economies that have implemented quantitative easing and socially we have seen big shifts to the Right or to the Left in terms of the political spectrum. 

“If you think about Donald Trump, Elizabeth Warren, Bernie Sanders, Jeremy Corbyn, Brexit, Boris Johnson. The next decade could be characterised by moves to the Right or Left here as well if we follow a path that other economies have pursued.”

AMP Capital chief economist Shane Oliver told Investor Daily that QE “probably helps people who have shares and property more than it does people who have bank deposits.”

Prior to the election of Mr Trump in 2016, Luis Zingales of the University of Chicago Booth School of Business told Bloomberg that central bank policies are largely to blame for the rise of populism. 

Here in Australia, the Reserve Bank will have to consider the impact that QE could have on a society that has witnessed a banking royal commission that exposed widespread misconduct within the financial services industry.

If the impact on Europe and the US of QE on the people is anything to go by, Australia is well placed to split down the middle and begin gathering on the far edges of the political spectrum.

We were late to the low rate party. We might just be late to the populism party too.

GDP update: spending dips and saving soars

Australians saved rather than spent most of the budget tax cuts, almost doubling the proportion of household income saved, leaving spending languishing. Via The Conversation.

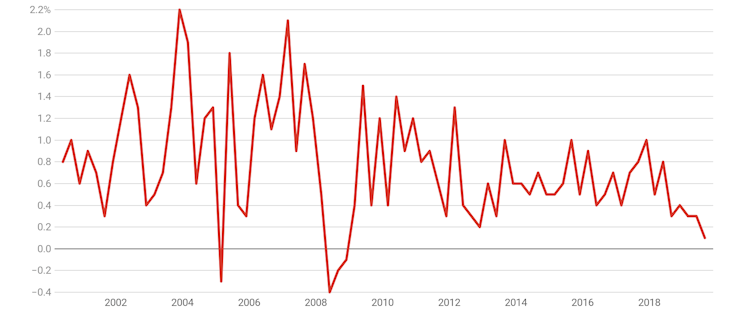
The September quarter national accounts show that in the first three months of the financial year real household spending grew by just 0.1%, the least since the global financial crisis.

Over the year to September, inflation-adjusted spending grew by a mere 1.2%, also the least since the financial crisis. Australia’s population grew by 1.6% in that time, meaning the volume of goods and services bought per person went backwards.


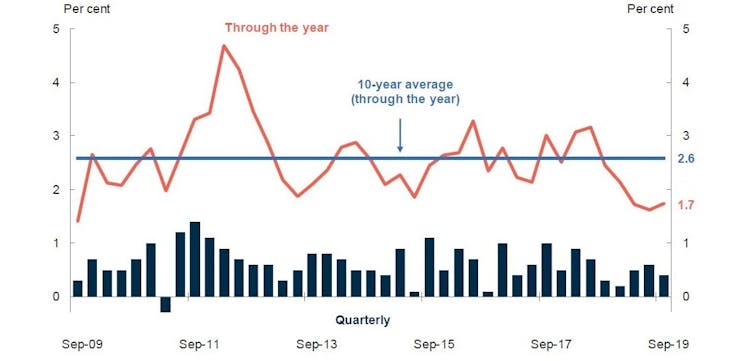
Quarterly growth in household spending

Household final consumption expenditure, quarterly real growth. Australian National Accounts

Separate figures released by the Federal Chamber of Automotive Industries on Wednesday show November new car sales were down 9.8% on November 2018.

By the end of November the Tax Office had issued more than 8.8. million tax refunds totalling A$25 billion, 30% more than a year before.

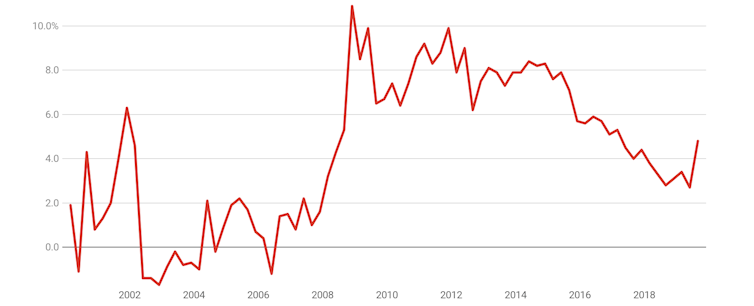
Instead of being largely spent, they were mostly saved, pushing up the household saving ratio from 2.7% to 4.8%, its highest point in more than two years.


Household saving ratio

Ratio of household net saving to household disposable income. Australian National Accounts

Treasurer Josh Frydenberg put the best face on the result, saying whether they had been spent or saved, the cuts had put households in a stronger position.

The government’s goal has always been to put more money into the pockets of the Australian people, and it’s their choice as to whether they spend or save that money

Separately calculated retail figures show that in the three months to September the volume of goods and services bought fell 0.1%.

The disposable income households had available to spend grew an outsized 2.5%, driven by what the Bureau of Statistics said were the budget tax cuts.

Growth at GFC lows

The Australian economy grew just 0.4% in the three months to September, down from 0.6% in the June quarter, and 0.5% in the March quarter.

Over the year to September it grew 1.7%, well short of the budget forecasts, which in year average terms were 2.25% for 2018-19 and 2.75% for 2019-20.


Real GDP growth

ABS, Commonwealth Treasury

After taking account of population growth, GDP per person grew not at all in the September quarter. Over the year to September living standards grew a bare 0.2%.

Gross domestic product per hour worked, which is a measure of productivity, fell 0.2% during the quarter and fell 0.2% over the year.

Company profits were up 2.2% in the quarter and 12.7% over the year. Wage and superannuation payments grew at about half those rates: 1.2% and 5.1%.

Housing investment was down 1.7% over the quarter and 9.6% over the year.

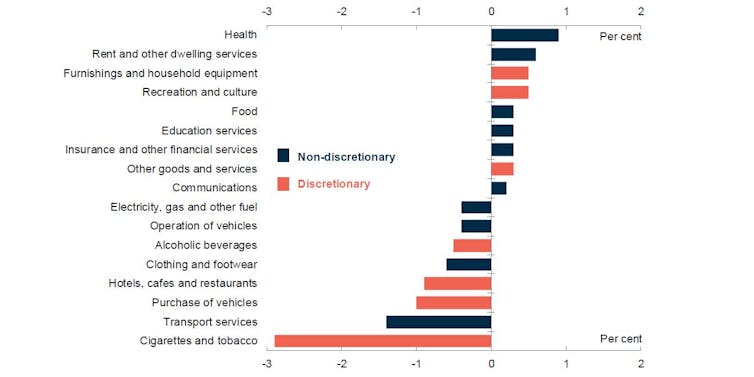
What household spending growth there was was concentrated on essentials, led by health and rent. So-called discretionary or non-essential expenditures fell, led down by spending on cars, dining out and tobacco.


Consumption growth by category, quarterly

Treasury definitions of discretionary and non discretionary spending. ABS, Commonwealth Treasury

The economy was kept afloat by a surge in government spending. It grew 0.9% in the quarter and 6% over the year. Growth in government spending and investment together accounted for 0.3 of the quarter’s 0.4 points of economic growth.

Government and mining to the rescue

Mining production grew 0.7% over the quarter and 7.4% over the year. A mining-fuelled surge in exports (which eclipsed imports for the first time since the 1970s) contributed almost as much to economic growth as government spending.

Drought-affected farm production fell 2.1% over the quarter and 6.1% over the year.

Business investment fell 4% in the quarter and 1.7% over the year, led down by a 7.8% fall in mining investment in the quarter and a 11.2% fall over the year, as liquefied natural gas projects came to completion. Non-mining investment fell 0.4%.

Asked whether the December budget update would contain tax measures designed to boost business investment, the treasurer said he was in discussions with business. The update is expected in the week before Christmas.

There’s little evidence in today’s figures of the “gentle turning point” spoken about hopefully by the Reserve Bank governor as recently as Tuesday.

If things don’t pick by the bank’s first board meeting for the year in February, it is a fair bet it will cut its cash rate again. By then it will know what the treasurer did (or didn’t) do in the budget update and whether we decided to spend over Christmas.

Author: Peter Martin, Visiting Fellow, Crawford School of Public Policy, Australian National University

Today, The People Were Murdered!

John Adams commemorates December 3rd, a fateful day in Australian history, yet an event which marks an important point in the development of democracy. Lest we forget.

The Eureka Stockade, rebellion (December 3, 1854) was when gold prospectors in Ballarat, Victoria, Australia sought various reforms, notably the abolition of mining licenses and clashed with government forces. The rebels’ hastily constructed a fortification in the Eureka goldfield.

Global Shipping Outlook Is Negative Due to Demand Risks

Slowing global economic growth, trade tensions and geopolitical risks will lead to subdued demand growth in global shipping in 2020, Fitch Ratings says in a new report. The sector outlook remains negative. Although all shipping segments have demonstrated more prudent capacity growth in recent years, which supported a better supply-demand balance, a longer record of responsive capacity management is needed to improve the sector’s resilience.

Free global trade is vital for shipping as about 80% of world trade in goods is carried by the international shipping industry. The main sector risk is that protectionist measures may escalate into a protracted trade war and damage the prospects for global trade and GDP growth. While some upside is possible if the trade tensions between the US and China ease, the downside risks, including expected slower GDP growth in China, soft trade growth and Brexit uncertainty, will continue to weigh on demand.

The sector will also need to cope with rising costs related to new regulation capping sulphur content in marine fuel (International Maritime Organisation (IMO) 2020), which is likely to negatively affect shippers’ credit metrics. This regulation will probably increase operating costs (if shippers choose to use more expensive low-sulphur fuel) and/or capex (if they install scrubbers that remove sulphur from the exhaust or purchase new LNG-fuelled vessels). Shippers are unlikely to fully pass through all the associated costs to customers due to their limited bargaining power in the oversupplied market. We expect most shipping companies to use low-sulphur fuel.

We forecast global container volumes to grow by about 2.5% in 2020. While this represents a small increase from 2019, it is well below the average growth rate of about 4.5% over the past eight years. Trade restrictions, if they remain unresolved, are likely to have a negative impact on global container volumes of about 1% in 2020, according to AP Moller-Maersk. We expect better capacity management in global container shipping with fleet capacity increasing by 3.3% in 2020, slower than 3.6% in 2019. Container freight rates in 2020 are likely to remain at levels similar to those in 2019.

We expect dry-bulk trading volumes to grow by 3% in 2020, up by more than 1.5pp on 2019. This improvement will be driven by higher iron ore and other commodities volumes. Iron ore volumes are expected to slowly recover following the Vale dam incident in Brazil and challenging weather at Australian ports in 2019. Fleet additions are likely to match this growth in volumes, and freight rates are likely to increase as dry-bulk shippers will be better positioned to pass on some of the higher fuel costs.

Global tankers’ supply and demand are likely to grow by 2.5% and 3.5%, respectively, in 2020, supporting a better supply-demand balance. This will help freight rates to stay at levels comparable to annual averages in 2019, which represents a recovery from their troughs in the middle of 2018. The impact of IMO 2020 on tanker shipping companies is likely to be mixed, as rising compliance costs may be mitigated by increased tanker demand to transport compliant fuel. However, lingering trade and geopolitical tensions and political risk may depress long-term tanker demand