We review the latest data from the ABS, and the 19,000 FALL in jobs, the first for some time.
https://www.abs.gov.au/AUSSTATS/abs@.nsf/DetailsPage/6202.0Oct%202019?OpenDocument
"Intelligent Insight"
We review the latest data from the ABS, and the 19,000 FALL in jobs, the first for some time.
https://www.abs.gov.au/AUSSTATS/abs@.nsf/DetailsPage/6202.0Oct%202019?OpenDocument
Economist John Adams and Analyst Martin North examines the latest disclosures relating to the Cash Transaction Restriction Bill, and considers the implications in the count down to the end of the Senate submission window which expires on 15th November.
Keynote address by ASIC Commissioner Sean Hughes at the ARCA National Conference, Gold Coast, 14 November 2019

Today I would like to address some of the issues that have been raised in relation to responsible lending and demonstrate two facts. First, that the concerns are misplaced. Second, the principles underpinning these provisions remain sound, even in the changed economic environment since 2010.
At the outset I want to emphasise that our guidance is just and only that, guidance. It does not have the force of law. The fact that we are updating our guidelines, does not change the law, which has been in place since 2010. However, what has been made abundantly clear to us in the course of our consultations, is that industry would welcome more assistance in interpreting how to meet responsible lending obligations. Put simply, this is what we are endeavouring to achieve. We are not, and never have sought to impede the flow of credit to the real economy.
I want to take this opportunity to reflect upon three broad questions that keep recurring in the work we are doing to update our guidance:
And importantly, along the way I will respond to some misconceptions about responsible lending. There are some myths that need busting to address exaggerated and inaccurate criticisms about our consultation on revising this guidance.
Responsible lending is fundamentally about the credit industry’s commitment to dealing fairly with its customers. Ensuring robust and balanced standards of responsible lending to consumers has been, and will continue to be, a key priority for ASIC.
Consumer credit is part of the life blood of our society and economy. A report by Equifax Australia in July 2019 estimated that 4.4million applications for consumer credit were expected to be made in the 6 months to the end of the year[1].
Inappropriate lending can have devastating consequences for individuals and families, and on a broader scale, can undermine confidence in financial markets.
Australia introduced a national consumer credit regime in 2009 to avoid excesses in lending and predatory lending to consumers. In the preceding period, the impact of the financial crisis had revealed a number of shortcomings in policies and practices at financial institutions abroad. Some of these practices were clearly aimed at taking advantage of vulnerable borrowers.
Although lending standards in Australia were not as lax as other countries, during the pre-crisis period the share of ‘low doc’ loans written in Australia had grown strongly in the lead up to the crisis[2].
The responsible lending law reforms were introduced to Parliament to curb undesirable market practices that many were concerned about at the time, including[3]:
The core principle behind this regime is simple and has not changed since 2010 – despite what many critics and commentators have been saying. A licensee must not enter into, or suggest or assist a customer to enter into, a contract that is unsuitable. None of this is new. To ensure this outcome the licensee must:
Since the introduction of the responsible lending laws, ASIC has regularly reviewed industry practices and identified a range of compliance issues. Some examples of our work include:
More recently, the Royal Commission into the financial services sector found some major shortcomings in the way in which responsible lending laws were being applied by lenders.
At this point, I should say something briefly about the decision in the proceedings that ASIC took against Westpac in 2017 – the so-called ‘Wagyu and Shiraz’ case. This preceded the Royal Commission, and Commissioner Hayne did not directly address ASIC’s case against Westpac. ASIC was unsuccessful in this matter and while we respect the judgment, we have lodged an appeal.[4] Almost every commentator has criticised this decision and suggested that ASIC’s appeal creates avoidable uncertainty. Our objective in appealing this decision is, in fact, to clarify the application of the law. And we believe that doing so is in the best interests of both consumers and lenders. It is an important part of ASIC’s mandate to clarify the law where there is uncertainty, and thereby support and guide industry to understand their obligations.
We decided to appeal because we consider that the decision creates uncertainty about what a lender is required to do to comply with its obligation to make an assessment of whether a loan is not unsuitable for the borrower. And, if the judgment is to be understood as standing for the proposition that a lender may do what it wants in the assessment process (as His Honour found), then we consider that to be inconsistent with the legislative intention of the responsible lending regime. The Westpac case relates to the period between December 2011 and March 2015, and although in the years since we have seen some improvements in responsible lending standards amongst the industry, there is a real risk that uncertainty in the approach required by lenders to comply with the law could result in slippage by some lenders.
Put simply, we believe that the judgment left it too unclear what steps are required of a lender. We are seeking clarity by appealing. The proper forum to debate this is now the Full Federal Court. Like any other litigant, we are availing ourselves of access to an appellate body. We should not be criticised for accessing the Courts to resolve a dispute, as all regulators do from time to time.
Notwithstanding our appeal in the Westpac case, we consider that ASIC should still provide updated guidance mindful that the appeal has not yet been heard. All of the ingredients necessary are there – judicial decisions, ASIC enforcement action, thematic reviews, the Royal Commission, changes to technology. The updated RG209 looks to build on the existing guidance, which we believe is fundamentally sound, and to bring those developments together in a single, instructive guide and to clarify and provide more certainty to industry in key areas where we can.
There are a number of myths and exaggerated claims about the supposed effects of the responsible lending laws that need to be addressed. These claimed effects are either not supported by the facts or data, or, if they are real, they are the result of a fundamental misunderstanding and misapplication of the law.
Let me address a few of the most significant.
There has been a lot of misinformation published recently in the media and in the current corporate reporting season about the effect of the responsible lending requirements on small business lending.
The responsible lending obligations administered by ASIC apply to credit provided to individuals for:
They apply also to loans to strata corporations for these same purposes. This is the one, very niche, area of application of the responsible lending obligations to an entity rather than an individual.
Otherwise, a loan to a company (including small proprietary companies) for any purpose is not subject to the responsible lending obligations.
Where there is a loan to an individual, the purpose of the loan determines whether the loan is subject to the responsible lending obligations. The nature of any security for the loan does not affect this test, nor does the source of income to pay the loan back. In other words, it is not an asset test but a predominant purpose test.
A loan to an individual predominantly for a business purpose is not subject to responsible lending obligations. ‘Predominant’ simply means ‘more than half’.
So, if someone borrows $500,000 of which $300,000 is to be used to establish a small business, and the remainder for making home improvements, the loan is not subject to the responsible lending obligations.
Similarly, if a small business operator obtains a loan to purchase a motor vehicle which is to be used 60% of the time for work purposes but will also be available for personal use, the loan is not subject to the responsible lending obligations.
A loan to an individual for business purposes secured over a borrower’s home is not subject to the responsible lending obligations.
Of course, a lender may choose to apply its responsible lending processes to business loans for its own commercial reasons to manage its credit risk portfolio or to meet its prudential obligations.
AFCA in its role as the dispute resolution scheme for the credit industry deals with both small business loans and consumer loans. There has been some confusion in industry about whether the responsible lending obligations are going to be applied by AFCA in relation to small business loans. In evidence at ASIC’s public hearings in August this year, AFCA undertook to clarify this misunderstanding in its forthcoming guidance to its members.
Contrary to some anecdotal statements, the evidence and data do not point to ASIC’s guidance in RG 209 or our consultation to revise this guidance, as having caused increases in credit application processing times or rejection rates.
We do accept that, following the commencement of the Royal Commission, lenders began to review their approach to responsible lending and to tighten standards. And that these reviews, prompted by the Royal Commission and not by ASIC’s guidance (which, remember, has been unchanged since November 2014), have resulted in them seeking more detailed information from borrowers and necessitated some systems upgrades and staff training.
To the extent this had any effect on processing times, it was only at the margins. In coming to that conclusion, we have actively sought information about processing times.
The ABA has not indicated any direct impact by ASIC on ABA members’ processing times. The reasons given for an increase in approval times instead included:
Anecdotally, we have also heard of instances where front-line lending officers are seeking to escalate loan approval decisions to their managers, which may also have added to perceived delays.
We do not accept this. The evidence and data available to ASIC do not suggest that the decision to update our guidance has contributed to the current state of the economy by limiting access to credit.
Indeed, lending trend reports published by the ABA show that banks are still lending – approval rates remain between 85-90% for home lending and 90-95% for business lending (the latter of course should not be captured by our guidance on the responsible lending obligations).
Instead, the main reason for slower credit growth has been a decline in the demand for credit. Statements made during ASIC’s public hearings, other information we have collected from industry, and recently published economic statistics all support this view.
And, in fact, there are signs that this may be turning around.
The Australian Bureau of Statistics reported that (in seasonally adjusted terms) lending commitments to households rose 3.2% in August 2019, following a 4.3% rise in July. Earlier this week, CBA announced a 3.5% increase in home lending and 2.8% in business lending for the 3 months to October.
This pick-up in recent approvals lends further support to the view that it is not responsible lending obligations that have been dampening credit availability. So too do the following sources:
Our Regulatory Guides are intended to be useful and informative documents and there has been a great deal of anticipation about the upcoming revision. There are a few key points I would like to make about what an update to our guidance means and will achieve.
First – our regulatory guidance was last updated in November 2014, and the responsible lending obligations themselves have not materially changed since 2010. For a topic like responsible lending, where the application of the law continues to be clarified through court decisions, and where the industry’s technologies and systems evolve and change, it is appropriate to conduct periodic reviews and updates of our guidance.
Second – the consultation process has involved multiple steps. We allowed three months to receive submissions, in order to get thoughtful and broad feedback. We exercised our power to conduct public hearings – for the first time in more than 15 years. This proved to be a very useful and respectful forum to talk to industry participants about their views. We have also recently concluded a group of round-table sessions with stakeholders including ADIs, non-bank lenders, brokers, providers of small amount credit contracts and consumer leases, and consumer representative groups. This enabled us to test and distil the conclusions we were drawing on necessary changes.
Third – it is critical everyone is clear that our guidance does not, and the revised guidance will not, create new obligations. Simply because it cannot do that. Our regulatory guides are just that – guidance – about approaches that licensees can adopt to reduce the risk that they fail to comply with the responsible lending laws.
Fourth – The submissions were wide ranging, but many made the point that they were looking for more guidance not less, albeit while retaining flexibility to exercise judgments in implementing responsible lending practices.
We made it very clear in the consultation paper that we wanted to update and clarify our existing guidance and provide additional guidance.
When we release the updated regulatory guide in a few weeks, I urge licensees to take the guidance on board and to compete with each other on the quality of products and services to consumers. Not focus on processes which merely seek to achieve a minimum level of compliance.
In conclusion, I hope that I have given context for what we are doing and why, and busted some myths about the practical effects of responsible lending.
We all have a role to play to ensure that both consumers and investors can continue to have confidence in the efficient and fair operation of our credit markets. As the leaders and responsible managers of our credit institutions, it falls to you to implement processes that ensure consumers are provided with products that are affordable for them and suit their needs.
We intend for our update to Regulatory Guide 209 to provide greater clarity to industry. All the same, there is little doubt that we will continue to be engaged in conversation with industry about responsible lending.
Australia’s trend unemployment rate remained steady at 5.3 per cent in October 2019, according to the latest information released by the Australian Bureau of Statistics (ABS) today. The unemployment rate increased in the Northern Territory and New South Wales, and decreased in Tasmania.
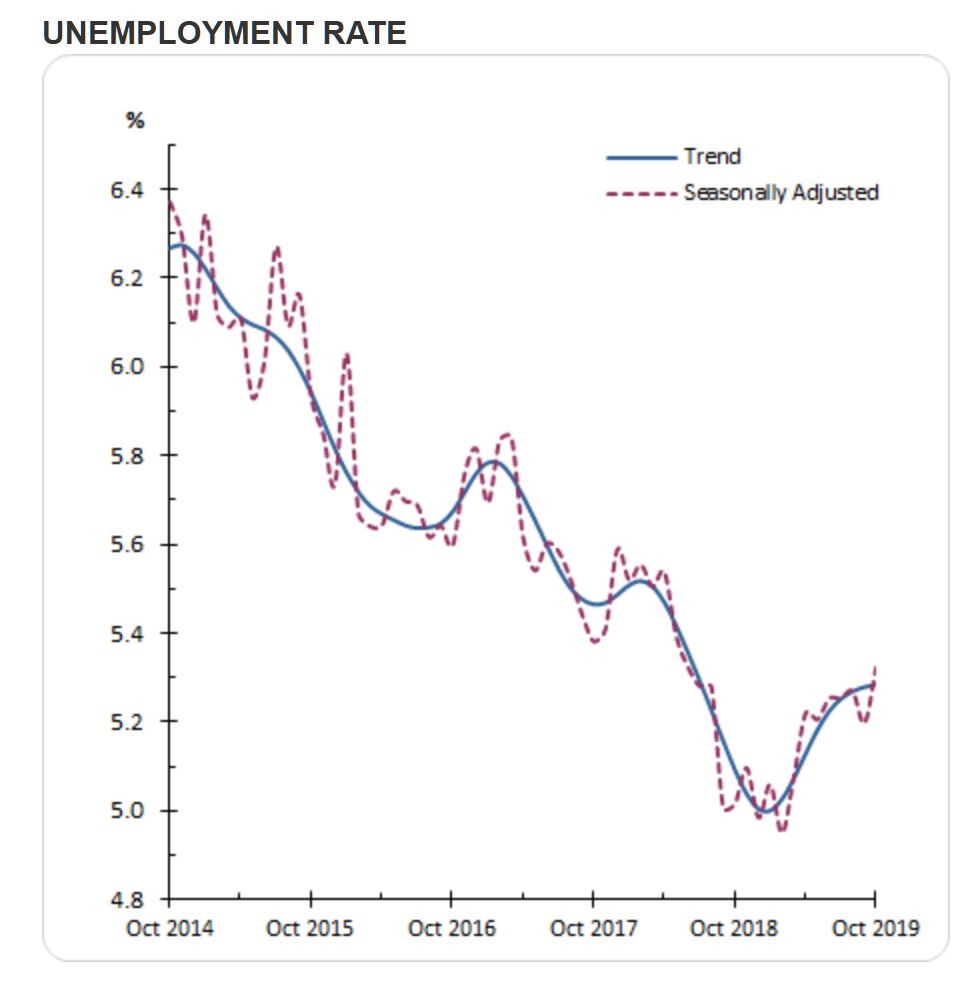
Trend unemployment in October 2019 remained steady at 5.3 per cent, 0.2 percentage points higher than the same time last year.
The increase in the unemployment rate over the past year has coincided with a 0.5 percentage point increase in the participation rate, from 65.6 per cent to 66.1 per cent.
The trend monthly underutilisation rate also remained steady at 13.8 per cent in October 2019, an increase of 0.4 percentage points over the past year.
Employment and hours
In October 2019, trend monthly employment increased by around 12,300 people. Full-time employment increased by around 5,800 people and part-time employment increased by around 6,500 people.
Over the past year, trend employment increased by around 268,500 people (2.1 per cent), which continued to be above the average annual growth over the past 20 years (2.0 per cent). Full-time employment increased by 1.8 per cent and part-time employment increased by 2.8 per cent over the past year.
The trend monthly hours worked increased by 0.2 per cent in October 2019 and by 1.7 per cent over the past year. This was slightly above the 20 year average year-on-year growth of 1.6 per cent.
Underemployment and underutilisation
The trend monthly underemployment rate remained steady at 8.5 per cent in October 2019, an increase of 0.2 percentage points over the past year. The trend monthly underutilisation rate also remained steady at 13.8 per cent in October 2019, an increase of 0.4 percentage points over the past year.
States and territories trend unemployment rate
The monthly trend unemployment rate remained steady in Victoria, Queensland, South Australia, Western Australia and the Australian Capital Territory in October 2019. The unemployment rate increased in the Northern Territory and New South Wales, and decreased in Tasmania.
Over the year, unemployment rates fell in Western Australia and the Australian Capital Territory, and increased in all other states and territory.
Seasonally adjusted data
The seasonally adjusted unemployment rate increased by 0.1 percentage points to 5.3 per cent in October 2019, while the underemployment rate increased by 0.2 percentage points to 8.5 per cent. The seasonally adjusted participation rate decreased by 0.1 percentage points to 66.0 per cent, and the number of people employed decreased by around 19,000.
The net movement of employed in both trend and seasonally adjusted terms is underpinned by around 300,000 people entering and leaving employment each month.
Note that in original terms, the incoming rotation group in October 2019 had a higher employment to population ratio than the group it replaced (63.0% in October 2019, compared to 61.7% in September 2019), and was higher than the sample as a whole (62.4%). The incoming rotation group had a higher full-time employment to population ratio than the group it replaced (42.8% in October 2019, compared to 41.9% in September 2019), and was higher than the sample as a whole (42.5%).
The unemployment rate of the incoming rotation group was lower than the group it replaced (5.3% in October 2019, compared to 5.4% in September 2019) and was higher than the sample as a whole (5.1%). The participation rate of the incoming rotation group was higher than the group it replaced (66.4% in October 2019, compared to 65.2% in September 2019) and higher than the sample as a whole (65.7%).
I discuss the latest with property insider Edwin Almeida.
The ABS released the latest wages index data today to September 2019.
The trend and seasonally adjusted indexes for Australia both rose 2.2% through the year to the September quarter 2019. The public sector did better than the private sector.
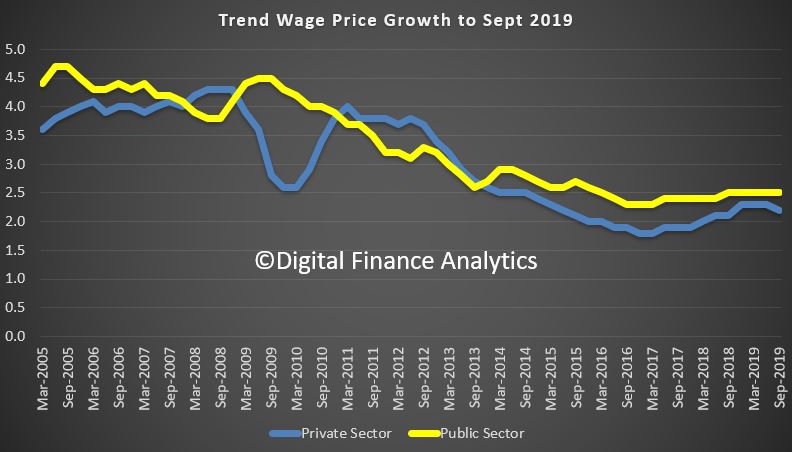
The original data by state shows TAS and VIC doing better than average, while WA and NT are below average.
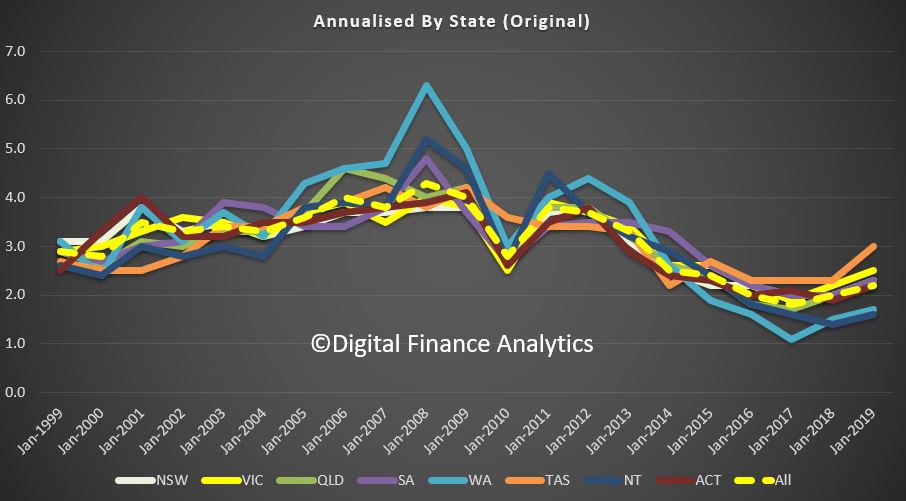
In original terms, rises through the year to September quarter 2019 at the industry level ranged from 1.7% for Information, media and telecommunications services to 3.2% for Health care and social assistance.
DFA provided data from our household surveys to inform an important report “The Debt Trap” released by more than 20 agencies helping consumers with their financial pressure. Our research, based on our rolling 52,000 households reveals that more households are using short term loans to try and manage their budgets, but many get trapped into debt. This is important given the rise in mortgage stress across the country.

The report also contains case studies which bring home the risks involved.
Worse, the recommendations from an earlier Government review are apparently in a holding pattern, and as a result more are being sucked in due to Government inaction.
Finally, the rise of apps and online lenders is making is easier for desperate households to get caught up with high cost short term debt.
Here is the official release.
Over 20 consumer advocacy bodies from around the country have released new data revealing that predatory payday lenders are profiting from vulnerable Australians and trapping them in debt, as they call for urgent law reforms.
The Debt Trap: How payday lending is costing Australians projected that the gross amount of payday loans undertaken in Australia will reach a staggering 1.7 billion by the end of 2019. It also found that:
The report was released today by over 20 members of the Stop the Debt Trap Alliance – a national coalition of consumer advocacy organisations who see the harm caused by payday loans every day through their advice and casework.
“The harm caused by payday loans is very real, and this newest data shows that more Australian households risk falling into a debt spiral,” says Consumer Action CEO and Alliance spokesperson, Gerard Brody.
“Meanwhile, predatory payday lenders are profiting from vulnerable Australians to the tune of an estimated $550 million in net profit over the past three years alone.”
Brody says that the Federal Government has been sitting on legislative proposals that would make credit safer for over three years, and that the community could not wait any longer.
“Prime Minister Scott Morrison and Treasurer Josh Frydenberg are acting all tough when it comes to big banks and financial institutions, following the Financial Services Royal Commission. Why are they letting payday lenders escape legislative reform, when there is broad consensus across the community that stronger consumer protections are needed?”
The Alliance is calling on the Federal Government to put people before profits and pass the recommendations of the Small Amount Credit Contract (SACC) review into law. This legislation will be critical to making payday loans and consumer leases fair for all Australians. There are only 10 sitting days left to get it done.
“The consultation period for this legislation has concluded. Now it’s time for the Federal Government to do their part to protect Australians from financial harm and introduce these changes to Parliament as a matter of urgency.”
We look at the last business surveys.
We examine a recent article which highlights how Central Banks are crushing savers.
CBA, who is on a different reporting cycle to the other majors, released their trading update to 30th September 2019 today. These are unaudited numbers and included some one-off items, but generally it looks like CBA managed to navigate the complexities of the current market quite well. But its all a matter of relativity as all the banks remain under pressure.

That said, the CET1 ratio was down, there was a considerable increase in corporate troublesome assets (discretionary retail, construction and agriculture), plus pockets of stress across its personal loans portfolio in Western Sydney and Melbourne. The Net Interest Margin was “lower than June 2019 due to headwinds associated with a low interest rate environment, which will continue to impact margins in future periods”. $2.2bn is flagged for customer remediation in program spend and provisions.
They made comparisons with the average of the previous two quarters, which might flatter the results a little. And they may have been later to implement the revised tighter HEM, which might have flattered their loan growth. Overall capital risk wights for mortgages sat at 25.8%.
Worth also noting that according to Banking Day:
Commonwealth Bank was the subject of the highest number of complaints to the Australian Financial Complaints Authority over the year to June, with the other big banks not far behind.
CBA was way out in front, with 3,890 complaints. ANZ, at number two, received more than 1,000 fewer complaints.
Unaudited statutory net profit was around $3.8 billion in the quarter, but this included a $1.5 billion gain from the sale of Colonial First State Global Asset Management(CFSGAM) to Mitsubishi UFJ Trust and Banking Corporation, with a post-tax gain on sale of approximately $1.5 billion.
Net cash profit from continuing operations was around $2.3 billion, up 5% excluding one-offs. This is the figure they want you to focus on!
Operating income was up 3% (day-weighted)
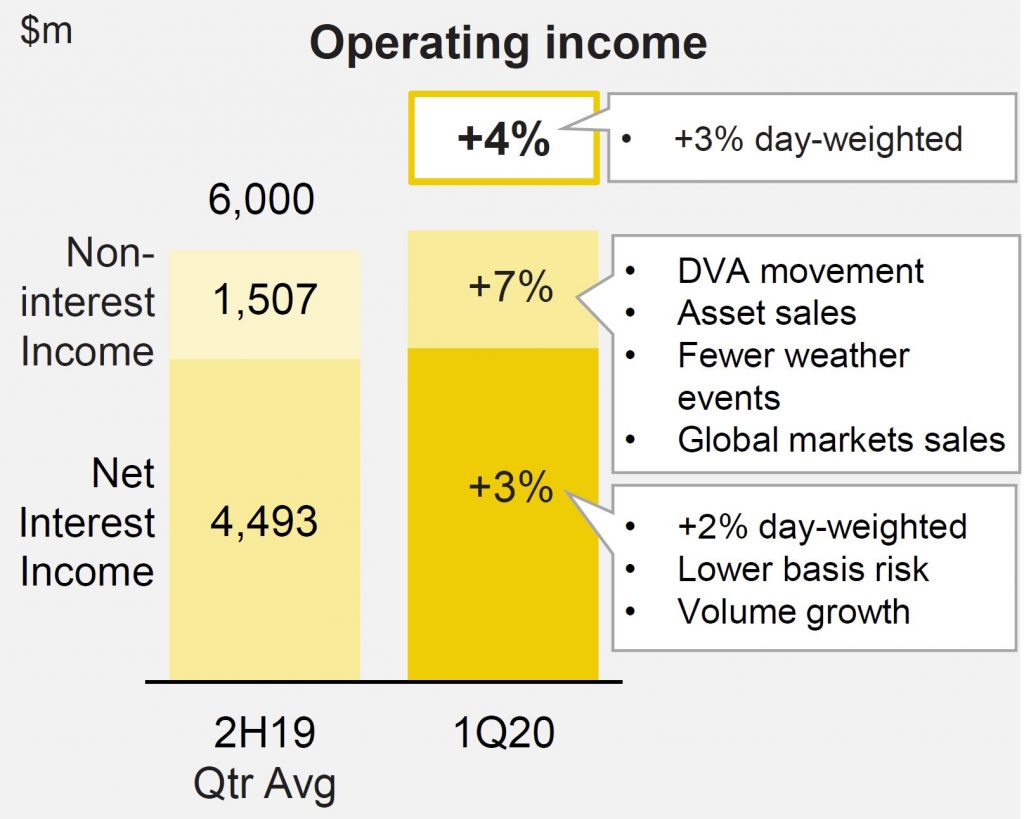
Net interest income increased 3%, benefiting from 1.5 additional days in the quarter. On a day-weighted basis, Net Interest Income was 2% higher, underpinned by volume growth in core markets of home lending, business lending and household deposits.
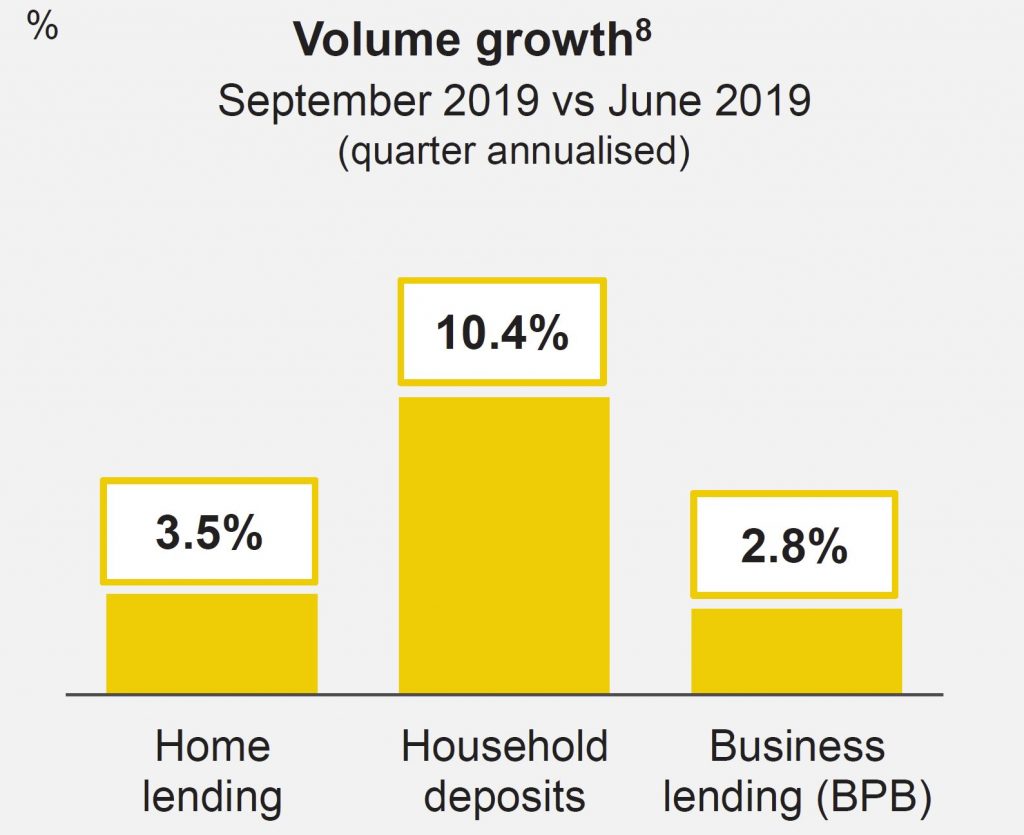
Excluding a 4 bpt benefit from lower basis risk, the Group’s Net Interest Margin was lower than June 2019 due to headwinds associated with a low interest rate environment, which will continue to impact margins in future periods.
Non-interest income increased 7%, benefiting from timing differences and one-off items including a favourable movement in the derivative valuation adjustment (DVA), asset sales in Structured Asset Finance (SAF), higher insurance income from fewer weather events/claims and higher global markets sales. These were partly offset by lower Funds Management income and the ongoing impact of the Bank’s Better Customer Outcomes program, which continues to deliver customer savings equivalent to annualised income forgone of $415m.
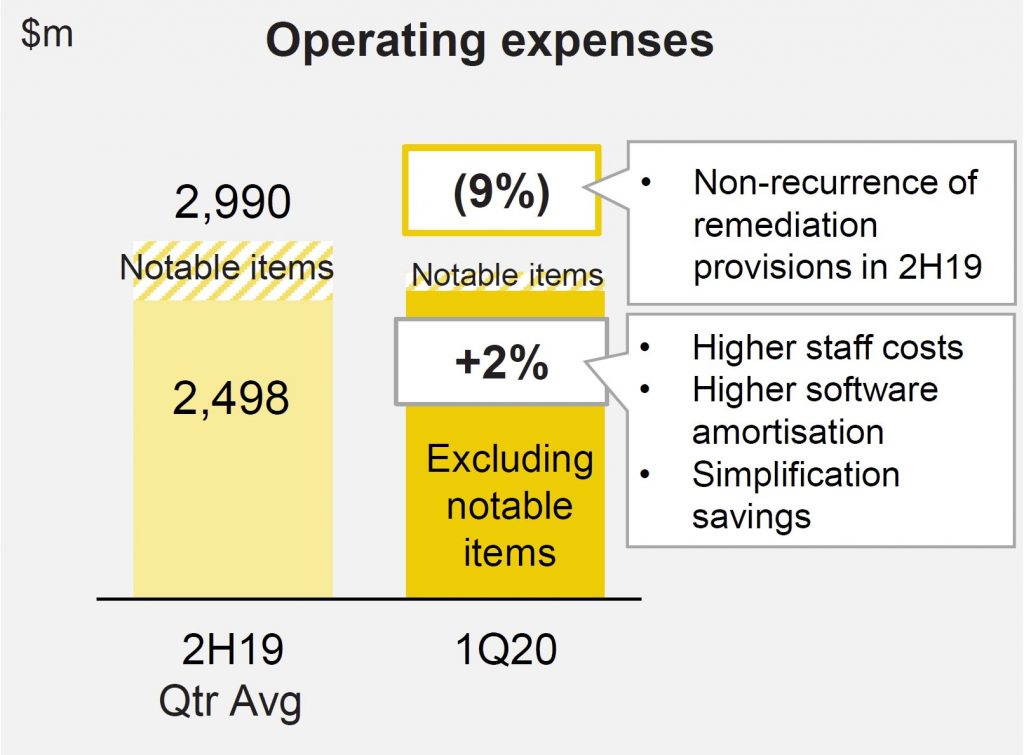
Operating expenses were up 2% (excluding notable items), reflecting higher staff costs and IT amortisation.
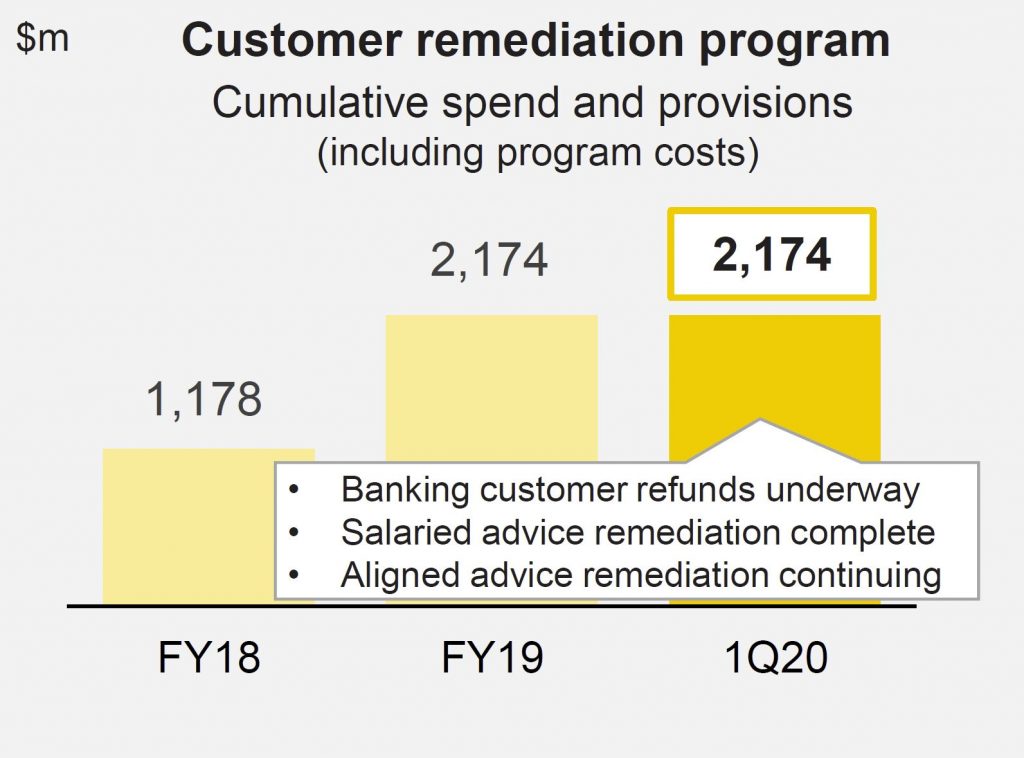
Customer remediation continues to drag the results. Of the $2.2bn in total program spend and provisions, $1.2bn relates to customer refunds of which approximately $600m has been paid to banking and wealth management customers to-date (ex aligned advice). Salaried adviser ongoing service remediation is now complete and represented a refund rate of 22% (ex interest). Aligned advice remediation work relating to ongoing service fees charged between FY09 and FY18 is continuing. The aligned advice remediation provision recognised in FY19 of $534m included program costs of $160m, $251m in customer refunds and $123m in interest. This assumed a refund rate of 24% (ex interest) and36% (incl.interest).
Loan Impairment Expenses were $299m in the quarter equated to 16bpts of Gross Loans and Acceptances, unchanged onFY19.
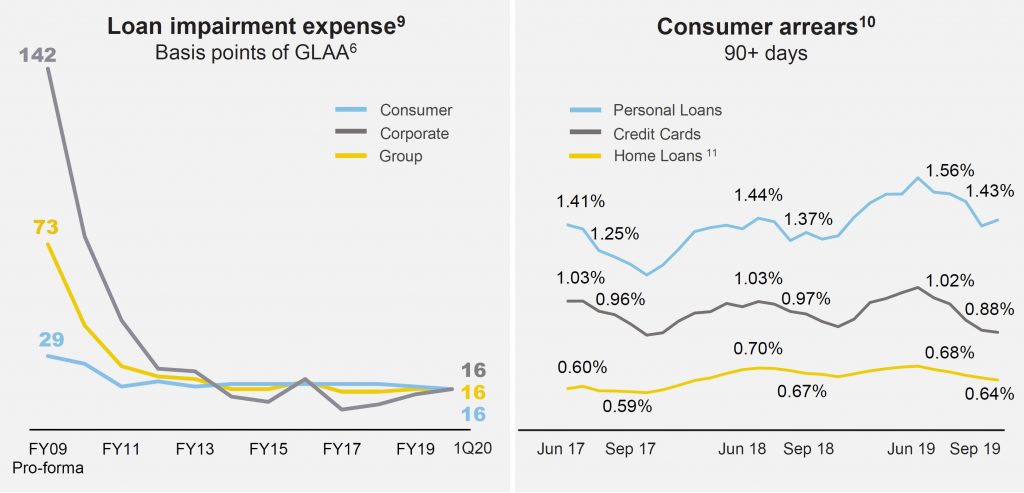
Consumer arrears improved in the quarter due to seasonality and the benefit of higher tax refunds. Personal Loan arrears rates remained elevated due to lower portfolio growth and continued pockets of stress in Western Sydney and Melbourne.
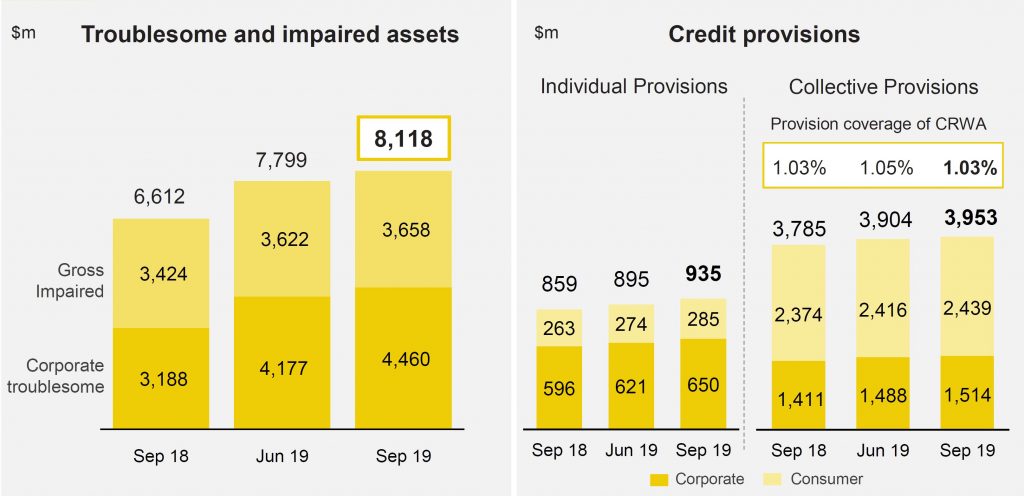
Troublesome and impaired assets increased to approximately $8.1bn. Corporate Troublesome assets continued to reflect weakness in discretionary retail, construction and agriculture,as well as single name exposures.
Total provisions increased by $89m to approximately $4.9bn.
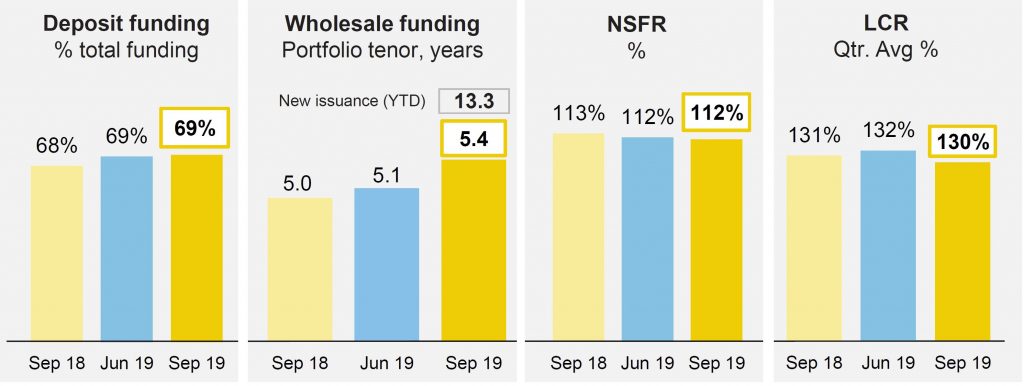
Customer deposit funding was at 69% and the average tenor of the long term wholesale funding portfolio at 5.4 years. The Group issued $5.8bn of long term funding in the quarter, including two long-dated Tier 2 transactions following the release of APRA’s loss-absorbing capacity proposal in July2019, contributing to a weighted average maturity of new issuance in the quarter of 13.3 years.
The Net Stable Funding Ratio (NSFR) was at 112%, the Liquidity Coverage Ratio(LCR) at 130% and the Group’s Leverage Ratio at 5.5% on an APRA basis (6.4%internationally comparable).
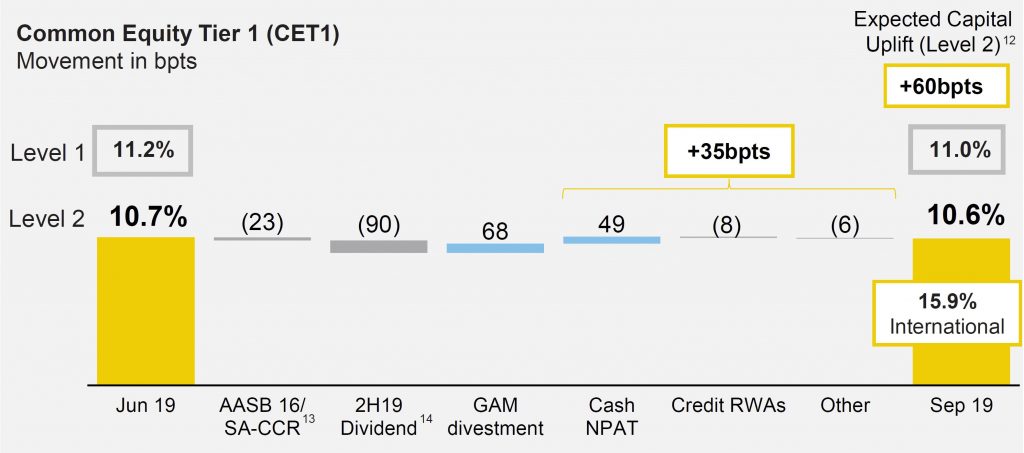
The Common Equity Tier 1 (CET1) APRA ratio was 10.6% as at 30 September 2019. After allowing for the impact of the 2019 final dividend and one-off impacts from regulatory changes and the CFSGAM divestment, CET1 increased 35bpts in the quarter. This was driven by capital generated from earnings, partially offset by higher Credit Risk Weighted Assets driven by revised regulatory treatments and lending volume growth. As at 30 September 2019, the Level1 CET1 was 11.0%, 40bpts above the Group’s Level2 CET1 Ratio.
The Group’s remaining previously announced divestments are expected to collectively provide an uplift to Level2 CET1 of approximately 60bpts. As outlined in the Group’s FY19 results, a strong expected capital position creates flexibility for the Board in its consideration of capital management initiatives.