The latest edition of our weekly finance and property news digest with a distinctively Australian flavour.
Australian segment starts at 20:10.
"Intelligent Insight"

The latest edition of our weekly finance and property news digest with a distinctively Australian flavour.
Australian segment starts at 20:10.
Property expert Joe Wilkes and I discuss the New Zealand and Australian property markets. The statistics tell an interesting – and worrying story! And a shout out to Mike Kirk for his excellent data!
We continue our series on MMT with a discussion between Wilson N. Sy (Ex. APRA and ASIC), Economist John Adams and Analyst Martin North on our “In The Interests Of The People” channel.
Specifically we examine Wilson’s thesis that MMT is i) Not New and ii) Another version of Socialism.
RBA Governor Philip Lowe spoke at CEDA today. He signals more rate cuts, their potential limited impact and the need for other strategies to move towards higher levels of employment. Underemployment makes an entrance – finally! We have been talking about this for years.

Today, I would like to explain why this is so and also discuss how we assess the amount of spare capacity in the labour market. I will then finish with some comments on monetary policy.
Students of central bank history would be aware that the Reserve Bank Act was passed by the Australian Parliament in 1959 – 60 years ago. In terms of monetary policy, the Parliament set three broad objectives for the Reserve Bank Board. It required the Board to set monetary policy so as to best contribute to:
These objectives have remained unchanged since 1959. Here, in Australia, we did not follow the fashion in some other parts of the world over recent decades of setting just a single goal for the central bank – that is, inflation control. In my view it was very sensible not to follow this fashion. Our legislated objectives – having three elements – are broader than those of many other central banks. The third of our three objectives serves as a constant reminder that the ultimate objective of our policies is the collective welfare of the Australian people.
From an operational perspective, though, the flexible inflation target is the centre piece of our monetary policy framework. The target – which has been agreed to with successive governments – is to deliver an average rate of inflation over time of 2–3 per cent. Our focus is on the average and on the medium term.
Inflation averaging 2 point something constitutes a reasonable definition of price stability. Achieving this stability helps us with our other objectives. Low and stable inflation is a precondition to the attainment of full employment and it promotes our collective welfare. As I have said on other occasions, we are not targeting inflation because we are inflation nutters. Rather, we are doing so because delivering low and stable inflation is the most effective way for Australia’s central bank to promote our collective welfare.
So where does the labour market fit into all this?
The answer is that it is central to all three objectives.
The connection with the second objective – full employment – is obvious. The RBA is seeking to achieve the lowest rate of unemployment that can be sustained without inflation becoming an issue. In doing this, one of the questions we face is what constitutes full employment in a modern economy where work arrangements are much more flexible than they were in the past. I will return to this issue in a moment.
The labour market is, of course, also central to the third objective in our mandate – our collective welfare. It is stating the obvious to say that for many Australians, having a good job at a decent rate of pay is central to their economic prosperity.
Trends in the labour market also have a major bearing on inflation outcomes, so they are important for the first element of our mandate as well. Over time, there is a close link between wages growth and inflation. And a critical influence on wage outcomes is the balance between supply and demand in the labour market; or in other words how much spare capacity is there in the labour market? This question is closely linked to the one about what constitutes full employment.
So, it is natural that we focus on the labour market as the Board makes its monthly decisions about interest rates.
With that background I would now like to discuss how we assess the degree of spare capacity in the Australian labour market. I will do this from four perspectives:
The conventional measure of spare capacity in the labour market is the gap between the actual unemployment rate and the unemployment rate associated with full employment. Even at full employment, some level of unemployment is to be expected as workers leave jobs and search for new ones. As my colleague Luci Ellis discussed last week, we don’t directly observe the unemployment rate associated with full employment – we need to estimate it.[1] Over recent times there has been a gradual accumulation of evidence which has led to lower estimates. While it is not possible to pin the number down exactly, the evidence is consistent with an estimate below 5 per cent, perhaps around 4½ per cent. Given that the current unemployment rate is 5.2 per cent, this suggests that there is still spare capacity in our labour market.
The fact that the conventional estimate of spare capacity is based on the unemployment rate reflects an implicit assumption that if you have a job you are pretty much fully employed. In decades past, this might have been a reasonable assumption. But it is not a realistic assumption in today’s modern flexible labour market.
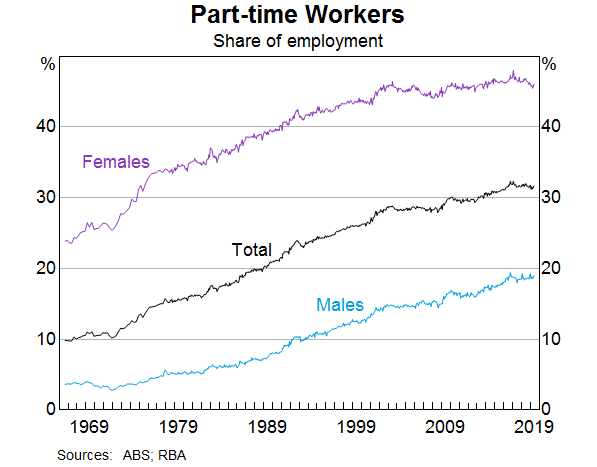
As more people work part time, it has become increasingly common to be both employed and to work fewer hours than you want to work. In the 1960s, less than one in ten workers worked part time (Graph 1). Today, one in three of us works part time. Almost one in two women work part time and more than one in two younger workers work part time.
A few more facts are perhaps helpful here. According to the ABS, around 3 million people work part time because they want to, not because they can’t find a full-time job. Most people who are working part time do so because they are studying or have caring responsibilities, or for other personal reasons. So we should not think of part-time jobs as being bad jobs, and full-time jobs as being good jobs. Rather, one of the success stories of the Australian labour market is that we have been able to accommodate this desire for part-time work and flexibility.
Having said that, around one-quarter of people working part time are not satisfied with the hours they are offered and would like to work more hours: we can think of these people as underemployed (Graph 2). The share of part-time workers who are underemployed moves up and down from year to year, and the current share is above its average level over the past two decades.
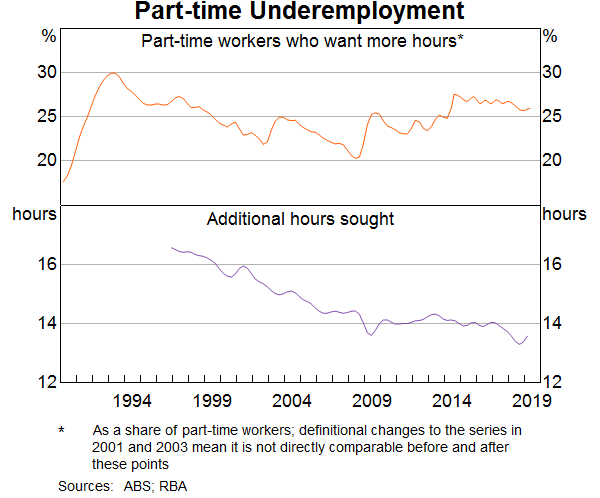
As part of the ABS’s monthly survey of 50,000 people, it asks underemployed workers how many extra hours they would like to work. On average, they answer that they would like to work an extra 14 hours per week. It is interesting that this figure has trended down over the past two decades; it used to be more than 16 hours. Over the same period, the average hours worked by part-time workers has increased by around 2 hours to 17 hours per week. Taken together, these data suggest that businesses are doing a better job of providing the hours that part-time workers are seeking.
This shift to part-time work means that in assessing spare capacity we need to consider measures of underemployment as well as measures of unemployment. The RBA has been doing this for some time. As part of our efforts here, we have constructed a measure of underutilisation that takes account of the part-time workers who want to work more hours. This measure adds the extra hours sought by these workers to the hours sought by those who are unemployed (Graph 3).[2] These extra hours are equivalent to around 3.3 per cent of the labour force, which, taking account of conventional unemployment, means that the underutilisation rate is 8.1 per cent. This hours-based measure is preferable to heads-based measures of underutilisation that treats an unemployed person in the same way as a part-time worker seeking a few more hours.
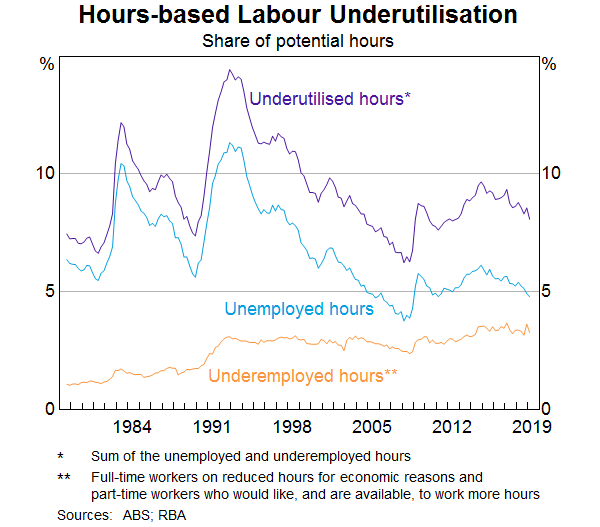
Unlike the unemployment rate, which has trended down over the past 20 years, the underemployment rate has been relatively stable. These different patterns in unemployment and underemployment suggest that fewer inroads have been made into spare capacity in the labour market than suggested by looking at the unemployment rate alone. This is something we take into account in thinking about monetary policy.
There is, though, one other perspective on the measure of underemployment that I would like to share with you. In the past, when part-time work was not as readily available, many people – mostly women – faced the choice of taking full-time paid employment or no paid employment at all. Many chose to, or had to stay outside the labour force because working was not a realistic option. From the perspective of society as a whole, this was a serious form of underutilisation – it just wasn’t measured as such by the ABS.
Given the trend towards part-time and more flexible jobs, people have more options than they had before and many have chosen to join, or have deferred leaving, the labour force.[3] From the perspective of adding to the productive capacity of the nation, this is a good outcome and if there was a measure of underutilisation that took account of exclusion from the workforce, it would surely have declined. I don’t want to downplay the issue of underemployment, but it is worth recognising this broader perspective, and remembering where we have come from.
This naturally brings me to my second window into spare capacity in the labour market – the flexibility of labour supply.
Over the past 2½ years, the working-age population has increased at an annual rate of around 1¾ per cent. Over that same time period, employment has increased at an average rate of 2¾ per cent. The fact that employment has been increasing considerably faster than the working-age population has led to a reduction in the unemployment rate, but the reduction is not as large as might have been expected. The reason for this is that the supply of labour has increased in response to the stronger demand for workers.
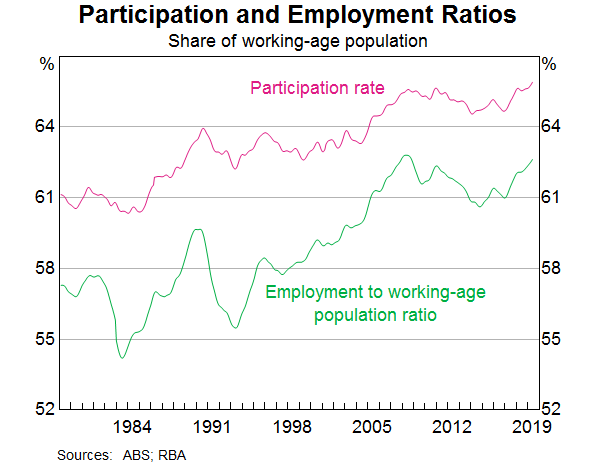
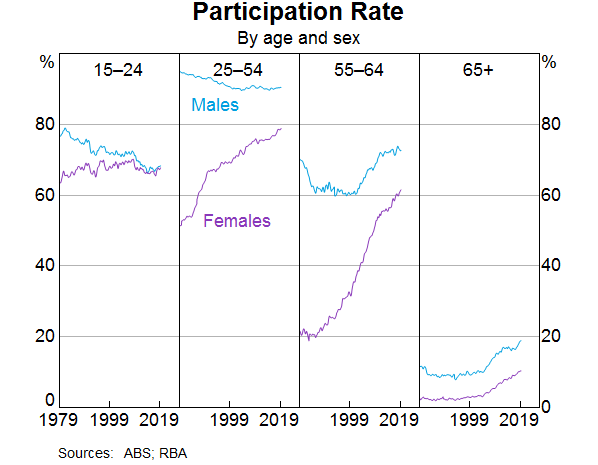
This flexibility in labour supply is evident in the substantial rise in labour force participation. The participation rate currently stands at 66 per cent, which is the highest on record (Graph 4). Reflecting this, the share of the working-age population in Australia with a job is currently around the record high it reached at the peak of the resources boom. As I discussed a few moments ago, the availability of part-time and flexible working arrangements is one reason for this.
There are two groups for which the rise in participation has been particularly pronounced: women and older Australians (Graph 5). The female participation rate now stands at 61 per cent, up from 43 per cent in 1979. Australia’s female participation rate is now above the OECD average, although it remains below that of a number of countries, including Canada and the Netherlands.
The participation rate of older workers has also increased over recent decades as health outcomes have improved and changes have been made to retirement policies. The eligibility age for the pension was progressively raised from 60 to 65 for females and is now being gradually increased to 67 for everybody by 2023. The preservation age at which individuals can access their superannuation is also being gradually increased. These changes are contributing to higher participation by older Australians.
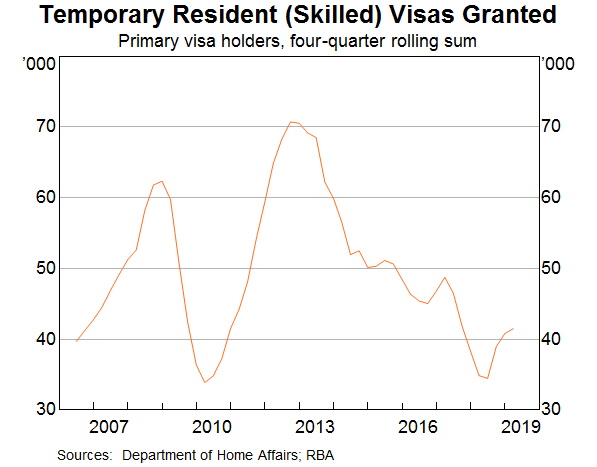
Another source of potential labour supply is net overseas migration. Migration, including temporary skilled workers, increased sharply during the resources boom when demand for skilled labour was very strong, and has subsequently declined (Graph 6). While migrants add to both demand and supply in the economy, they can be a particularly important source of capacity for resolving pinch-points where skill shortages exist.
A related source of flexibility stems from our unique relationship with New Zealand. When labour demand is relatively strong in Australia, there tends to be an increase in the net inflow of workers from New Zealand to Australia. When conditions are relatively subdued here, the reverse occurs. During the resources boom, the inflow from across the Tasman were as large as the inflow of temporary skilled workers.
The overall picture here is one of a flexible supply side of the labour market. When the demand for labour is strong, more people enter the jobs market or delay leaving. This rise in participation is a positive development. But it is one of the factors that has meant that strong demand for labour has not put much upward pressure on wages.
A third perspective on spare capacity in the labour market can be gained from examining how well people looking for jobs are matched with the jobs that are available. Looking at the labour market from this perspective, things look a little tighter than suggested by the other two perspectives that I have discussed.
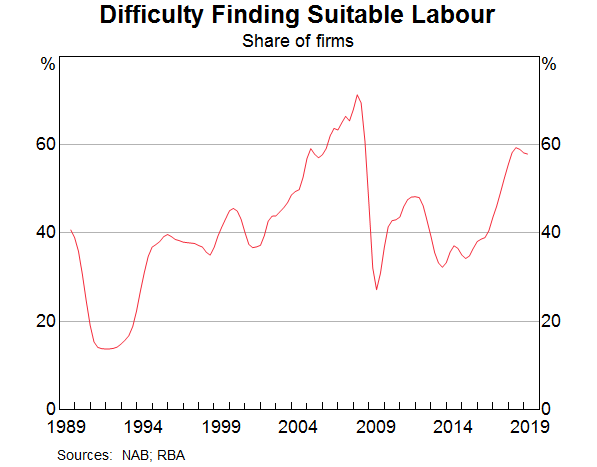
Currently, almost 60 per cent of firms report that the availability of labour is either a minor or a major constraint on their business (Graph 7). This share is not as high as it was during the resources boom, but it is still quite high. Reports from the RBA’s liaison program suggest that there are currently shortages of certain types of engineers, workers with specialised IT skills and some tradespeople associated with public infrastructure work. Businesses in regional areas are also more likely to report a greater degree of difficulty finding suitable labour.
One contributing factor here is an underinvestment in staff training. In the shadow of the global financial crisis many firms cut back training to reduce costs. We are now seeing some evidence of the adverse longer-term implications of this. As the labour market tightens further, I would hope that more firms are prepared to hire workers and provide the necessary training.
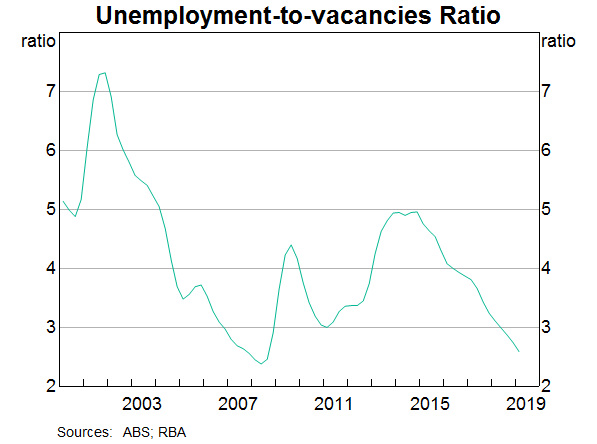
Another lens on job matching is the ratio of the number of unemployed people to the number of job vacancies (Graph 8). At present, there are fewer than three unemployed people for each vacancy. This compares with over 20 people for every vacancy in the early 1990s recession and five people for every vacancy in 2014. From this perspective the labour market looks reasonably tight. There is also some tentative evidence that, on average, unemployed workers are not as well matched to job vacancies as was the case in 2007, when the ratio of the two was at a similar level.
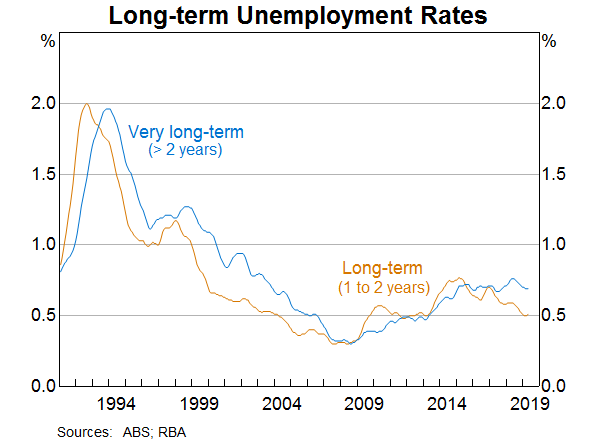
One such piece of evidence is that as the unemployment rate has come down over recent years, there has been little progress on reducing very long-term unemployment, defined as those who are unemployed for more than two years (Graph 9). Addressing the causes of this chronic unemployment remains an important challenge for our community. More positively, the share of the labour force that has been unemployed between one and two years has trended down over recent times.
Another lens on job matching and the overall tightness of the labour market is the rate of job mobility; that is, how often people change their jobs. Here, the evidence is interesting. Despite the frequent reports of a lack of job security and regular job switching by millennials, the average time that workers are staying with an employer is increasing. Reflecting this, the share of employed people who switch employers in a given year is the lowest it has been in a long time (Graph 10). Looking at the data by occupation, the rate of job mobility is lowest for managers and business professionals and highest for tradespeople and workers in the hospitality industry.
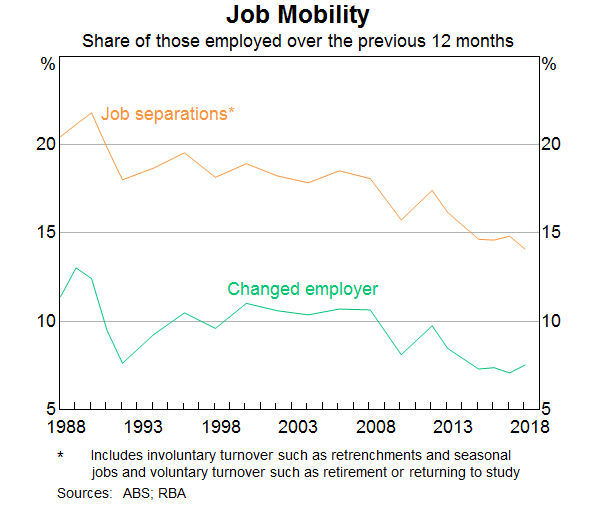
In a tight labour market, we would expect to see either strong wages growth or frequent job changing as businesses seek out workers. But we are seeing neither at present. One possible explanation for this is the uncertainty that many people feel about the future. This uncertainty means that if you have a job you want to keep it rather than take a risk with a new employer. This might be especially so if you also have a large mortgage. So it is possible that the high level of household debt is also affecting labour market dynamics.
I will now turn to the fourth perspective on labour market tightness – that is wages growth.
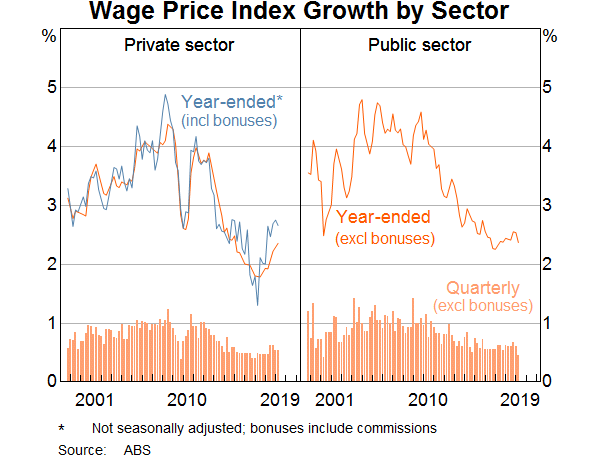
Over the past year, wages growth has picked up as the labour market tightened. This is not surprising given the strength of demand for labour. But the pick-up has been fairly modest and is only evident in the private sector (Graph 11). Over the past year, the private-sector Wage Price Index increased by 2.4 per cent, up from 1.9 per cent in the previous year. The past two quarters have, however, seen lower wage increases than in the previous two quarters.
In contrast to trends in the private sector, wages growth in the public sector has been steady at around 2½ per cent, largely reflecting the wage caps across much of the public sector.
It is also worth pointing out that overall wages growth in New South Wales and Victoria has been running at just 2½ per cent despite the unemployment rate being 4½ per cent or lower over the past year.
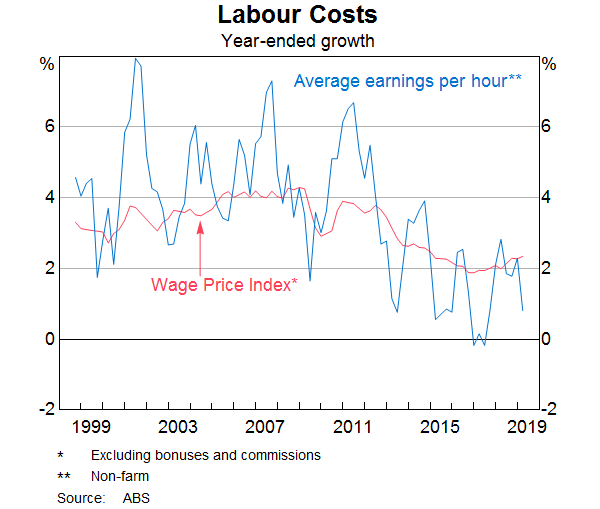
Another perspective on wages growth is from the national accounts, which reports average earnings per hour worked (Graph 12). This measure is volatile, but the latest data painted a fairly weak picture, with average hourly earnings up by just 1 per cent over the past year.
In summary, the overall picture from these various windows into the labour market is that despite the strong employment growth over recent times, there is still considerable spare capacity in the labour market. We remain short of the unemployment rate associated with full employment, there is significant underemployment and there is further potential for labour force participation to increase when the jobs are there. Consistent with all of this, wages growth remains modest and is below the rate that would ensure that inflation is comfortably within the 2 to 3 per cent range. The one caveat to this assessment is the difficulty that some firms are having finding workers with the necessary skills. This underlines the importance of workplace training.
I would like to finish with a few words on monetary policy.
As you are aware, the Reserve Bank Board reduced the cash rate to 1¼ per cent at its meeting earlier this month. This was the first adjustment in nearly three years.
This decision was not in response to a deterioration in the economic outlook since the previous update was published in early May. Rather, it reflected a judgement that we could do better than the path we looked to be on.
The analysis that I have shared with you today supports the conclusion that the Australian economy can sustain a higher rate of employment growth and a lower unemployment rate than previously thought likely. Most indicators suggest that there is still a fair degree of spare capacity in the economy. It is both possible and desirable to reduce that spare capacity. Doing so will see more people in jobs, reduce underemployment and boost household incomes. It will also provide greater confidence that inflation will increase to be comfortably within the medium-term target range.
Monetary policy is one way of helping get us onto to a better path. The decision earlier this month will assist here. It will support the economy through its effect on the exchange rate, lowering the cost of finance and boosting disposable incomes. In turn, this will support employment growth and inflation consistent with the target.
It would, however, be unrealistic to expect that lowering interest rates by ¼ of a percentage point will materially shift the path we look to be on. The most recent data – including the GDP and labour market data – do not suggest we are making any inroads into the economy’s spare capacity. Given this, the possibility of lower interest rates remains on the table. It is not unrealistic to expect a further reduction in the cash rate as the Board seeks to wind back spare capacity in the economy and deliver inflation outcomes in line with the medium-term target.
It is important though to recognise that monetary policy is not the only option, and there are limitations to what can be achieved. As a country we should also be looking at other ways to get closer to full employment. One option is fiscal policy, including through spending on infrastructure. Another is structural policies that support firms expanding, investing, innovating and employing people. Both of these options need to be kept in mind as the various arms of public policy seek to maximise the economic prosperity of the people of Australia.
The latest from the UK suggests inflation will fall below the 2% lower bounds as downside risks to growth build and the Brexit issue still haunts the halls. The Bank held the current rate, and will continue its market operations to stimulate the economy.
The Bank of England’s Monetary Policy Committee (MPC) sets monetary policy to meet the 2% inflation target, and in a way that helps to sustain growth and employment. At its meeting ending on 19 June 2019, the MPC voted unanimously to maintain Bank Rate at 0.75%.

The Committee voted unanimously to maintain the stock of sterling non-financial investment-grade corporate bond purchases, financed by the issuance of central bank reserves, at £10 billion. The Committee also voted unanimously to maintain the stock of UK government bond purchases, financed by the issuance of central bank reserves, at £435 billion.
The MPC’s most recent economic projections, set out in the May Inflation Report, assumed a smooth adjustment to the average of a range of possible outcomes for the United Kingdom’s eventual trading relationship with the European Union and were conditioned on a path for Bank Rate that rose to around 1% by the end of the forecast period. In those projections, GDP growth was a little below potential during 2019 as a whole, reflecting subdued global growth and ongoing Brexit uncertainties. Growth then picked up above the subdued pace of potential supply growth, such that excess demand rose above 1% of potential output by the end of the forecast period. As excess demand emerged, domestic inflationary pressures firmed, such that CPI inflation picked up to above the 2% target in two years’ time and was still rising at the end of the three-year forecast period.
Since the Committee’s previous meeting, the near-term data have been broadly in line with the May Report, but downside risks to growth have increased. Globally, trade tensions have intensified. Domestically, the perceived likelihood of a no-deal Brexit has risen. Trade concerns have contributed to volatility in global equity prices and corporate bond spreads, as well as falls in industrial metals prices. Forward interest rates in major economies have fallen materially further. Increased Brexit uncertainties have put additional downward pressure on UK forward interest rates and led to a decline in the sterling exchange rate.
As expected, recent UK data have been volatile, in large part due to Brexit-related effects on financial markets and businesses. After growing by 0.5% in 2019 Q1, GDP is now expected to be flat in Q2. That in part reflects an unwind of the positive contribution to GDP in the first quarter from companies in the United Kingdom and the European Union building stocks significantly ahead of recent Brexit deadlines. Looking through recent volatility, underlying growth in the United Kingdom appears to have weakened slightly in the first half of the year relative to 2018 to a rate a little below its potential. The underlying pattern of relatively strong household consumption growth but weak business investment has persisted.
CPI inflation was 2.0% in May. It is likely to fall below the 2% target later this year, reflecting recent falls in energy prices. Core CPI inflation was 1.7% in May, and core services CPI inflation has remained slightly below levels consistent with meeting the inflation target in the medium term. The labour market remains tight, with recent data on employment, unemployment and regular pay in line with expectations at the time of the May Report. Growth in unit wage costs has remained at target-consistent levels.
The Committee continues to judge that, were the economy to develop broadly in line with its May Inflation Report projections that included an assumption of a smooth Brexit, an ongoing tightening of monetary policy over the forecast period, at a gradual pace and to a limited extent, would be appropriate to return inflation sustainably to the 2% target at a conventional horizon. The MPC judges at this meeting that the existing stance of monetary policy is appropriate.
The economic outlook will continue to depend significantly on the nature and timing of EU withdrawal, in particular: the new trading arrangements between the European Union and the United Kingdom; whether the transition to them is abrupt or smooth; and how households, businesses and financial markets respond. The appropriate path of monetary policy will depend on the balance of these effects on demand, supply and the exchange rate. The monetary policy response to Brexit, whatever form it takes, will not be automatic and could be in either direction. The Committee will always act to achieve the 2% inflation target.
Following our successful live stream event earlier in the week, we have recorded an extra segment where we answer those questions we were not able to get to during the show.
Original Live Event here:
On 17 June, the European Banking Authority (EBA), published 2018 data on national Deposit Guarantee Schemes (DGSs) across the European Economic Area (EEA), which show that 32 of 43 DGSs increased their funds available to cover deposits in 2018 by levying banks.
Here of course the $250k deposit scheme is unfunded and currently inactive.

Moody’s says that the target of 0.8% of covered deposits by 2024 set out in the Deposit Guarantee Schemes Directive (DGSD) has already been achieved in 17 of the 43 DGSs in the EEA. The gradually increasing harmonisation of DGSs in Europe is credit positive for European banks because it improves European banking systems’ financial stability by better protecting depositors against the consequences of credit institution insolvency. As DGS funding increases and exceeds the 0.8% threshold, they also expect banks’ levies to moderate, which will benefit their profitability.
Since the 2009 financial crisis, European authorities developed policies and tools to buttress financial systems’ resiliency and help authorities prevent and, if needed, tackle bank distress without having to resort to taxpayers’ support. DGSs form one of these tools.
Under current EU legislation, depositors are protected by their national DGS up to €100,000 (or the equivalent in local currency). This protection applies regardless of whether ex ante funding has been accrued by DGS. Under the DGSD, all EEA banks are required to contribute to national DGSs so that at least 0.8% of covered deposits are funded by 2024 (and by exception, no less than 0.5% of the covered deposits, like in France2).
Nine member states have set up DGSs with higher funding targets such as Romania (3.43%) and Poland (2.6%). Some countries, such as Iceland, have not yet defined their national funding target, while others have defined numerous DGSs for different categories of banks and depositors, as in Germany for private, public, savings or cooperative banks, hence there are more DGS than there are EU countries.
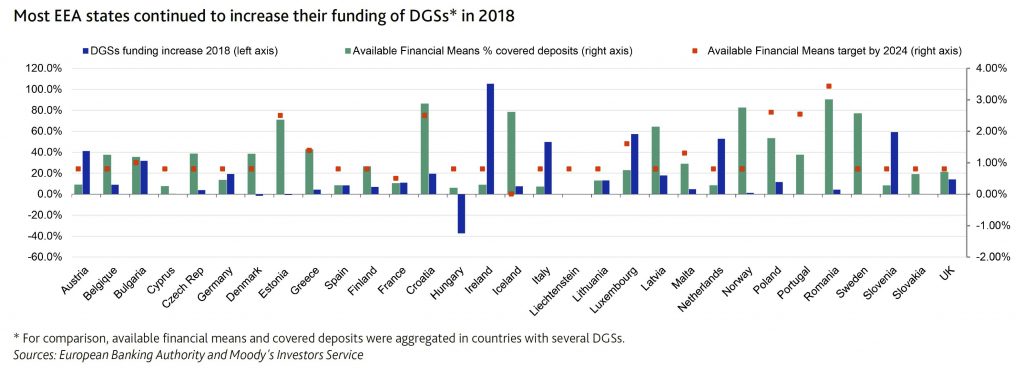
As of year-end 2018, 16 countries had already reached the DGSD’s 0.8% minimum funding ratio for 2024, and 10 countries exceeded their national target. The levies banks paid increased by around 12% in 2018, while covered deposits grew only by 3.6%. As of year-end 2018, EEA member states had reached in aggregate a funding ratio of 0.65% of covered deposits, up from 0.6% in 2017.
Out of the 31 banking systems addressed in the EBA report, 25 increased the funding for the DGSs in 2018, with very large increases in Ireland (+105.2%), Slovenia (+59.2%) or Luxembourg (+57.3%). The diversity in funding efforts reflects different starting points since some countries did not have DGS or limited ex-ante funding when the DGSD was adopted. For instance Luxembourg had no funding in 2015 and a target of 1.6% of covered deposits.
Despite progress, the third pillar of the banking union – the European deposit insurance scheme (EDIS) proposal adopted in 2015 – is not yet in sight due to a lack of political consensus. The EDIS proposal builds on the system of national DGSs and would provide a stronger and more uniform degree of insurance cover in the euro area. This framework would reduce the vulnerability of national DGSs to large local shocks.
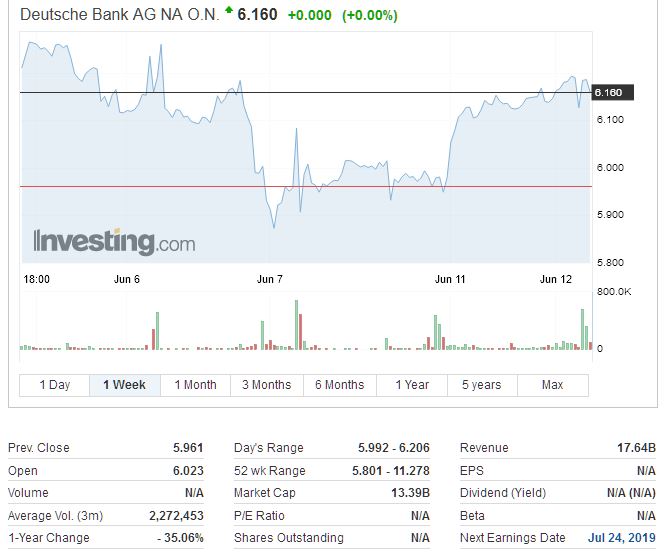
A New York Times report suggests that Deutsche Bank, the embattled banking titan faces an investigation by Federal Authorities.
The investigation includes a review of Deutsche Bank’s handling of so-called suspicious activity reports that its employees prepared about possibly problematic transactions, including some linked to President Trump’s son-in-law and senior adviser, Jared Kushner, according to people close to the bank and others familiar with the matter.
This is part of a criminal investigation into wider examinations into how illicit funds flow through the American financial system.
Deutsche Banks shares were down after the report.
The Justice Department has been investigating Deutsche Bank since 2015, when agents were examining its role in laundering billions of dollars for wealthy Russians through a scheme known as mirror trading. Customers would use the bank to convert Russian rubles into dollars and euros via a complicated series of stock trades in Europe and the United States.
Facebook released their while paper , and it poses a threat to current payment systems. The 29-page paper describes a protocol designed to evolve as it powers a new global currency.

“The Libra Blockchain is a decentralized, programmable database designed to support a low-volatility cryptocurrency that will have the ability to serve as an efficient medium of exchange for billions of people around the world.”
As Libra is a stablecoin, it will have less volatility than a crypto like Bitcoin as it’s tied to the value of real-world currencies. It’s potential is huge.
All over the world, people with less money pay more for financial services. Hard-earned income is eroded by fees, from remittances and wire costs to overdraft and ATM charges. Payday loans can charge annualized interest rates of 400 percent or more, and finance charges can be as high as $30 just to borrow $100.4 When people are asked why they remain on the fringe of the existing financial system, those who remain “unbanked” point to not having sufficient funds, high and unpredictable fees, banks being too far away, and lacking the necessary documentation.
Behind it, is the Libra Association, which is an independent, not-for-profit membership organization based in Geneva, Switzerland. “Members of the Libra Association will consist of geographically distributed and diverse businesses, nonprofit and multilateral organizations, and academic institutions.”
Founding members include:
The reaction from the fintech industry has been positive, though others are concerned about privacy, and risk from Facebook’s existing reach, and are calling for an inquiry into the proposal before it continues. Which ever way you look at it – this is big news.
The fintech industry has expressed excitement over the announcement by Facebook that it was set to introduce a new cryptocurrency to market with the help of some of the biggest names in tech, via InvestorDaily.
The cryptocurrency, dubbed Libra, has been announced by a Facebook white paper stating their mission to empower billions worldwide to enter the financial market.
“The mission for Libra is a simple global currency and financial infrastructure that empowers billions of people,” said the white paper.
The move has been met with excitement by industry players, and general manager of FinTech Australia Rebecca Schot-Guppy said such a rollout would open up new markets and promote fintech innovation.
“Another exciting prospect out of this is that Facebook’s reach may also help finally educate the public on the power of blockchain and cryptocurrency. Calibra [digital wallet for Libra] could take these technologies mainstream and put them at the fingertips of every Australian,” she said.
Co-founder and co-chief executive of Assembly Payments Simon Lee said it seemed like Facebook’s attempting to copy what WeChat and Alipay had done in China.
“We see Calibra as Facebook’s attempt to roll out what is happening in China to the rest of the world. They’ve seen the opportunity and have the scale to execute on it,” he said.
The currency will be built on the Libra blockchain and backed by a reserve of assets designed to give it intrinsic value, but perhaps the biggest nod to consumers is that it will be governed by an independent association.
Facebook has been plagued with user privacy controversies, which would lead many consumers to be sceptical to integrate the social media platform with their financial lives.
However, the Libra Association is their attempt to placate those voices by establishing it as a governing entity that is made up of the likes of Visa, Mastercard, Uber, eBay, Spotify and Vodafone.
The association, according to the white paper, will facilitate the operation of the blockchain and manage the Libra reserve, making them the only party able to mint and burn coins.
The association notes in the white paper that it is important to move towards increasing decentralisation to ensure that there remains a low barrier to entry for the network.
The chief executive of neobank Maslow, Kane Jackson, said the association’s concept showed that Facebook was aware of what was required in order for the coin to thrive.
“Facebook seems to understand that widespread adoption of finance-based products will not be achieved without the decentralisation of their governance and a community-inclusive approach to managing them,” he said.
Facebook has also launched a subsidiary company called Calibra that will handle its crypto dealings in an effort to separate user privacies, meaning Libra payments will not intermingle with Facebook data.
Despite Calibra operating as its own app, the wallet will integrate directly into WhatsApp and Facebook Messenger to utilise the vast network of Facebook to promote cryptocurrency.
It is this network promotion that excites Jasper Lawler, head of research at London Capital Group, who said the network would open other cryptocurrencies to billions.
“Libra will breed familiarity of cryptos to a much wider audience. Two billion people will now be much more open to Bitcoin and other altcoins,” he said.
As Libra is a stablecoin, it will have less volatility than a crypto like Bitcoin as it’s tied to the value of real-world currencies, Mr Lawler said.
“The different properties of a stablecoin compliment rather than compete with cryptocurrencies like Bitcoin, Ethereum and Ripple. Being pegged to regular currencies make stablecoins less volatile and more suited to payment processing,” he said.
The announcement saw an overnight rally for Facebook, but the community will have to wait to see how the rollout of the coin goes as no launch date has been set
From The Conversation. Hundreds of residents in a Sydney apartment complex, the 122-unit Mascot Towers, were evacuated last Sunday when cracks began to appear due to a serious structural failure. And it isn’t clear when the residents can return.

This crisis echoes the structural failure at Opal Tower and its evacuation on Christmas Eve last year. We have seen a series of serious building failures and fires in recent years. And state and federal governments have had more than year to act on recommendations for better construction regulations, but instead they’re shifting blame.
Although each building failure was different, the end result is the same: misery for the residents and a looming financial disaster for the owners.
New South Wales Premier Gladys Berejiklian said:
We’re getting to the bottom of what happened. The NSW government will hold everybody to account, that’s our role.
But the government’s role is to regulate sufficiently to prevent building failures in the first place, not to hold people to account after the event.
Prevention of construction failures has been the bedrock of building regulations ever since the Great Fire of London in 1666. In the aftermath, the English government realised there was not much use in raking through the ashes and trying to hold people to account, and that an ounce of prevention was worth a pound of cure. This led to the parliament passing regulations to prevent the spread of fire between buildings.
Governments all around the developed world took the lesson of the Great Fire to heart. Their common goal has been to proactively ensure buildings are constructed properly and are safe as a result.
This has been a pretty successful effort and most significant building failures since 1666 have contributed to a more comprehensive and effective regulatory regime.
Prior to the Opal Tower emergency, there had been only one significant evacuation of a multi-unit residential building in NSW due to structural failure. That was a result of the 2009 gas explosion at Eastgate Towers in Bondi Junction.
However, depending on which research you read, either 72% or 97% of strata apartments suffer from serious defects when they’re finished.
There have also been a series of other problems with recent buildings. These include lead in water caused by imported brass plumbing components, non-complying imported electrical cables and failures in the installation of fire doors, fire walls and fire door frames.
The states progressively introduced the Building Code of Australia (now the National Construction Code) during the 1990s as part of an agreed plan between the states and the federal government to make building regulations less prescriptive.
The aim was to reduce the cost of construction by favouring “innovation” over conservative “deemed to satisfy” regulations. Innovation, in these terms, meant finding ways to make buildings cheaper to build.
This move coincided with the globalisation of the building materials supply industry and a boom in the construction of tall apartment buildings in Australia.
Some of the innovation has been innocuous, or even beneficial, such as the introduction of a variety of lightweight interior wall systems, but some have resulted in substantial remediation bills – combustible cladding being the prime example. Inspection and responsibility for the plethora of imported components is virtually non-existent.
The downstream cost of failure has landed squarely in the laps of the building owners, many of them owners of tall apartments.
It’s difficult to estimate the total bill for remedial works to tall apartment buildings built over the last 25 years, but it may well exceed the Productivity Commission estimates of savings resulting from the introduction of the National Construction Code.
The federal minister responsible for building regulations, Karen Andrews, says the states are to blame.
And some states, including NSW, have resorted to tough talk about crackdowns on “dodgy” certifiers and “dodgy” builders. In reality, the problem is dodgy government regulation, by both federal and state governments.
The federal and state governments already have an initial plan for fixing these problems. The Shergold-Weir report was delivered to the Building Ministers’ Forum in February 2018.
As the report said:
After having examined the matters put to us, we have concluded that the nature and extent [of building defects] are significant and concerning. The problems have led to diminishing public confidence that the building and construction industry can deliver compliant, safe buildings which will perform to the expected standards over the long term.
Since then, state and federal governments have done almost nothing to implement the recommendations of the report, despite the 2018 Christmas Eve failure at Opal and the fire at Neo200 in Melbourne the following February.
The report itself states:
The recommendations have been designed to form a holistic and structured framework to improve the compliance and enforcement systems of the [National Construction Code] across the country. They form a coherent package. They would best be implemented in their entirety.
In NSW, the published response to Shergold-Weir is a patchwork focusing on holding people to account after a building construction event. This is the reverse of the proactive approach developed following the Great Fire of London.
The NSW government is set to appoint a building commissioner to oversee qualifications and to review building documentation.
But this will likely not achieve much, unless the government commits to upskilling workers throughout the industry and backs up desktop audits by increasing direct inspections on site. Neither of these things appears to be part of its plan.
All governments must take an active role in fixing the defective regulatory regime they have created. If they can’t get on with this process in a timely way, we will need yet another royal commission to sort it out.
The least Premier Berejiklian can do is to treat the Mascot Towers and Opal events in the same way the government treats natural disasters and provide housing assistance to residents who have been displaced through no fault of their own.
Author: Geoff Hanmer, Adjunct Lecturer in Architecture, UNSW