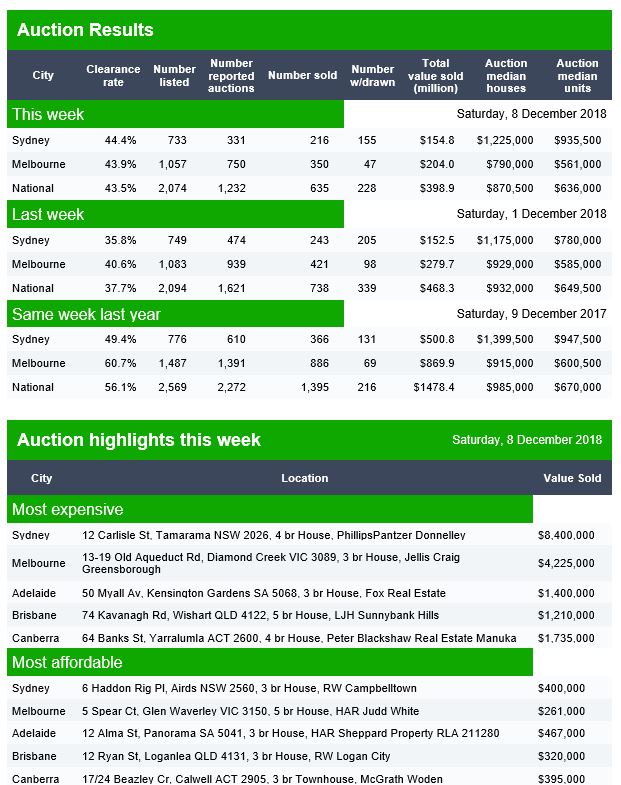
The results from last week were lower again at 37%, with Sydney sitting at 35.8%. And of course the volumes are way lower than a year ago. The preliminary results will of course drift lower as the final results for this week come in.
In terms of the smaller markets, Brisbane listed 120, reported 59 and sold 20 with 12 withdrawn, giving a Domain clearance of 28%.
Adelaide listed 98, reported 40 and sold 22, with 9 withdrawn, giving a Domain clearance of 45%
Canberra listed 66 auctions, reported 52 and sold 27, with 5 withdrawn, giving a clearance of 47%.
Welcome to the Property Imperative weekly to the eighth of December 2018, our digest of the latest finance and property news with a distinctively Australian flavour.
The financial markets continue to spin lower, as the property sector here weakens, and the RBA confirms it is quite willing to cut the cash rate if needs be, or even consider quantitative easing to “support the economy”. So today we look at the latest tranche of data, which continues to point towards a weaker economy, whilst in a parallel world, Canberra continues to celebrate the strength of economy, thanks to their careful management.
Which raises the question – are we there yet? Watch the video or read the transcript.
And by the way if you value the content we produce please do consider supporting our efforts. You can make a one off donation via PayPal, or consider joining our joining our Patreon programme. We really appreciate those who are contributing to help us continue to make great content.
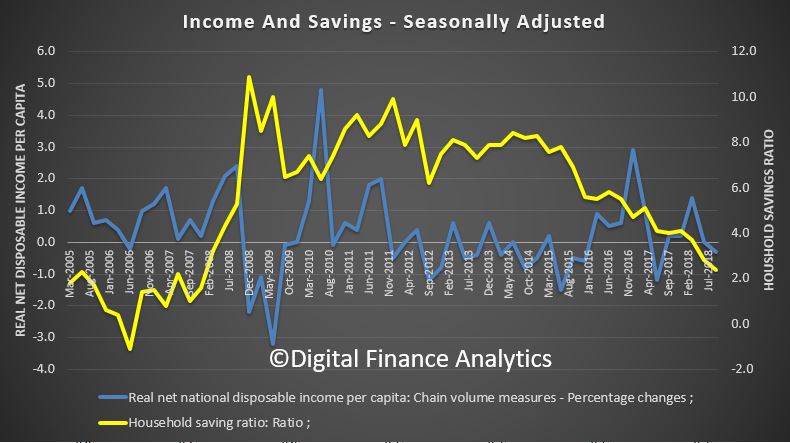
We start with the national accounts data. The RBA was forecasting an annual GDP results of 3.5% to December 2018, based on the recent Statement on Monetary Policy. With the first three quarters of the year reaching just 2.2%, it would require a December quarter of 1.3%, which seems unlikely. So they will need to adjust their forecasts down. All this looks to signal RBA cash rate cuts ahead. In addition, the per-capita data went negative in September at – 0.1 % meaning that it is population growth alone which is responsible for lifting the GDP. The per capita income and savings ratios also were negative, with the savings ratio back to lows not seen since 2007, as people dip into reserves to maintain lifestyle and pay the bills – as expected given our household financial confidence index. And net disposable income per capita fell 0.3% in the last quarter. Had it not been for strong commodity prices and big public spending on infrastructure, the story would have been worse still. You can see more in our post “Households Break The GDP”. In fact, the RBA is positioning to cut rates and even apply quantitative easing if needed, as outlined in a speech on Thursday by Deputy Governor Guy Debelle. This would inflate the debt balloon further, and economist John Adams and I discussed this in a show we released yesterday: “Unbounded Recklessness! The RBA Has Lost The Plot”. The RBA also said that what constituted too much debt was yet to be determined!
As you know, we think that current levels are already too high. In fact the killer was the rise in our net foreign debt liability which rose $12.6 billion $1,044 billion in Sept 2018, another record. And remember some of this, say one third is short term, meaning it needs to continually refreshed. This is where our exposure is to rising interest rates (and we know already the US will continue to hike rates). The 1 Year LIBOR rate, for example, is rising still. As is the BBSW, and this foreshadows real issues ahead. The debt bomb is alive and well….
The RBA held the cash rate again this month again this month, and there was little to report other than they seem to be a little more cautious suggesting that growth in China has slowed a little, and credit spreads are higher. They say that “one continuing source of uncertainty is the outlook for household consumption. Growth in household income remains low, debt levels are high and some asset prices have declined. The drought has led to difficult conditions in parts of the farm sector”.
Retail turnover was pretty anaemic according to the ABS. The trend estimate rose 0.2% in October 2018. This follows a rise of 0.2% in September 2018, and a rise of 0.2% in August 2018. The following states and territories rose in trend terms in October 2018: Victoria (0.4%), Queensland (0.5%), South Australia (0.3%), Tasmania (0.3%), and the Australian Capital Territory (0.2%). Western Australia was relatively unchanged (0.0%). New South Wales (-0.1%), and the Northern Territory (-0.8%) fell in trend terms in October 2018. Online retail turnover contributed 5.9 per cent to total retail turnover in original terms in October 2018, a rise from 5.6 per cent in September 2018 and the highest level recorded in the series
Then we got the dwelling approvals, which fell by 1.1 per cent in October 2018 in trend terms, according to data released by the ABS. And the value of new residential building approved fell 1.5% in October and has fallen for ten months. More signs of pressure on the residential construction sector. Among the states and territories, dwelling approvals fell in October in the Northern Territory (12.5 per cent), South Australia (5.0 per cent), Western Australia (4.4 per cent), Queensland (2.9 per cent) and New South Wales (2.3 per cent) in trend terms. Victoria (2.4 per cent) and the Australian Capital Territory (0.8 per cent) were the only states to record an increase in dwelling approvals in trend terms, while Tasmania was flat.
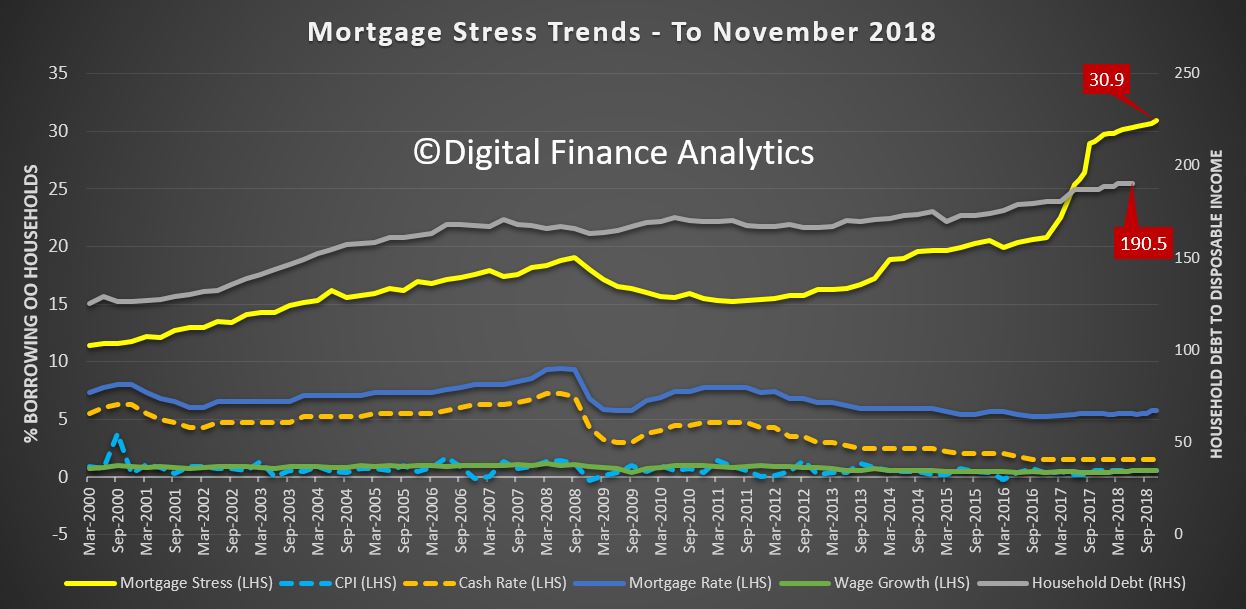
Our surveys revealed that in November, there was a rise in mortgage stress, again. See our post “Mortgage Stress Goes To The Moon”, for a list of worst hit post codes. Across Australia, more than 1 million and fifteen thousand households are estimated to be now in mortgage stress (last month 1 million and eight thousand). This equates to 30.9% of owner occupied borrowing households. In addition, more than 22,500 of these are in severe stress. We estimate that more than 61,000 households risk 30-day default in the next 12 months. Continued rises in living costs – notably child care, electricity, school fees and food – whilst real incomes continue to fall and underemployment is causing significant pain. Many are dipping into savings to support their finances.
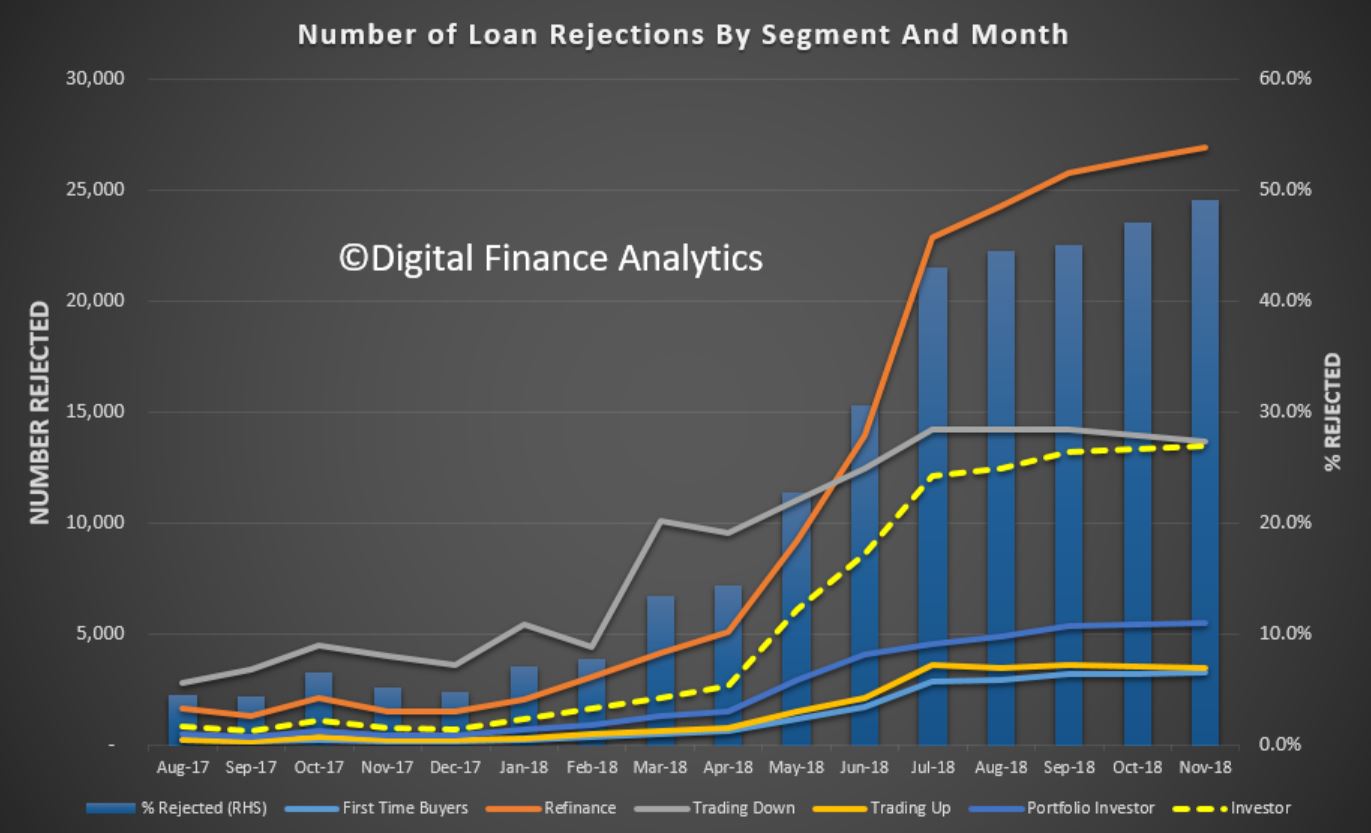
Indeed, the fact that significant numbers of households have had their potential borrowing power crimped by lending standards belatedly being tightened, and are therefore mortgage prisoners, is significant. More than 49% of those seeking to refinance are now having difficulty. This is strongly aligned to those who are registering as stressed. These are households urgently trying to reduce their monthly outgoings”.
In addition, negative equity is now rearing its head. See our post where we discuss this in detail. Data from APRA, the Property Exposures figures – showed that banks wrote nearly 26,000 new mortgages with a loan to value ratio of more than 90%, and a further 51,000 with an LVR of between 80 and 90 percent in the past year. That is 20% of all loans written in the same period. I would expect these numbers to fall significantly, as lenders tighten their standards further. But it’s also worth remembering that in some cases existing borrowers have pulled more equity out to allow them to pass funds to their kids – the so called bank of Mum and Dad, and in the case of a forced sale, the market value may well overstate the true recovery value of the property. Using a property as an ATM does not work in a falling market. Last month, a Roy Morgan survey of 10,000 borrowers found 8.9 per cent were slipping into negative equity — up from 8 per cent 12 months prior — which would work out to around 386,000 Australians. We have run our own analysis with data to the end of November and on my modelling currently there are around 400,000 households across the country in negative equity, both owner-occupiers and investors. There are about 3.25 million owner-occupier borrowers and at least 1.25 million investors, so around 10 per cent of properties are currently underwater. And it will get worse.
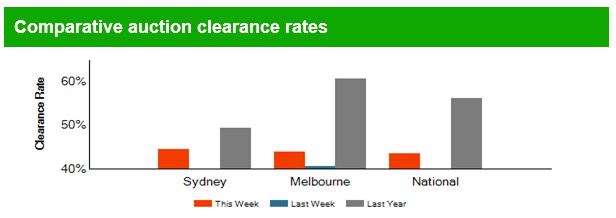
The property market news continues to highlight the cracks, as prices continue to ease. Last week, Corelogic says 2,749 homes were taken to auction across the combined capital cities, slightly higher than the week prior when 2,701 auctions took place. But the higher volumes saw the final clearance rate weaken further with only 41.3 per cent of homes selling at auction; making it the lowest result seen since Oct 2011. In comparison, this time last year, 3,291 homes went to auction and a clearance rate of 60.3 per cent was recorded.
Melbourne’s final clearance rate was recorded at 42.7 per cent across 1,378 auctions last week, improving on the 41.4 per cent final clearance rate the previous week across a lower 1,132 auctions. Over the corresponding week last year 1,647 Melbourne homes were auctioned and a stronger clearance rate was recorded (65.4 per cent).
Sydney’s final auction clearance rate came in at 41.6 per cent across 937 auctions last week, falling from the 44.8 per cent across a higher 1,035 auctions over the previous week. Over the same week last year, 1,143 homes went to auction returning a clearance rate of 56.2 per cent. Across the smaller auction markets, clearance rates improved in Perth and Tasmania, while Adelaide, Brisbane and Canberra saw clearance rates fall week-on-week. The combined capital cities are expected to see a lower volume of auctions this week with CoreLogic currently tracking 2,498 auctions, significantly lower than the 3,371 over the same week last year. Melbourne is set to see volumes fall over the week, with 1,205 auctions being tracked so far, in Sydney, 840 homes are currently scheduled for auction this week and across the smaller auction markets, Brisbane is expected to be the only city to see a rise in volumes week-on-week, with fewer auctions scheduled in Adelaide, Canberra, Perth and Tasmania. Of the non-capital city auction markets, Geelong was the best performing in terms of clearance rate (46.4 per cent).
And more economists are predicting bigger falls. For example, AMP’s Shayne Oliver believes there is still plenty of room for property prices to head south as homes weaken to GFC levels. “The decline in property prices is being driven by a perfect storm of tighter credit conditions, poor affordability, rising unit supply, reduced foreign demand, the switch from interest only to principle and interest mortgages for a significant number of borrowers, fears that negative gearing and capital gains tax concessions will be made less favourable if there is a change of government, falling price growth expectations and FOMO (fear of missing out) risking turning into FONGO (fear of not getting out) for investors”.
He believes the decline in Sydney and Melbourne property prices has much further to go as Comprehensive Credit Reporting kicks in, making it even harder to get multiple mortgages. Many homebuyers will be watching out for changes to negative gearing and capital gains tax, which could become the new reality after a change of government at the coming federal election. “In these cities we expect to see a top to bottom fall in prices of around 20 per cent spread out to 2020,” Mr Oliver said. “However, the plunge in clearance rates and the uncertainty around credit tightening and tax concessions indicate that the risks are on the downside. So there is more to go yet.
Yet still the bulls are roaring – this as reported in new.com.au: Buyer’s agent Nick Viner believes now is the time to buy in Sydney and Melbourne, with many discounted premium properties available with minimal competition. “This environment is the absolute perfect time to buy because you’ve got more time to consider your options and there’s more choice in terms of available homes,” Mr Viner, principal of Buyers Domain Australia, said. “You also have the ability to focus on really blue chip properties in your budget. You can bag a more superior property that you can really only get for cheaper in markets like this.” Most economists believe the total property price falls in Sydney will be within the vicinity of 15 per cent, which means some prime suburbs have already bottomed out. Oh Yeh?
And Domain continues to hype up the first time buyer opportunity, as the Western Australian Government announced that it would expand its Keystart loan book by more than $420 million to help stimulate demand in the housing market, saying it’s evident APRA’s credit control measures of the past three to four years, and further tightening to come from the Banking Royal Commission, has dampened activity across the nation. “To respond to this situation … Western Australia will be expanding its Keystart loan … to stimulate demand, and allow more first homebuyers the ability to enter the market”. More unnatural acts. My message to first time buyers is simple, hold your fire, prices have further to drop, and next year you could spend less and get more.
And Jonathon Mott from UBS said this week that “the banking sector is facing a period of substantial and sustained earnings pressure which is likely to last several years. The risk of the current credit squeeze turning into a credit crunch is real and rising, with the housing market now falling sharply. Mott added, If the use of the household expenditure measure benchmark is deemed to not meet the requirements of responsible lending this further increases the risk that the banks face mortgage mis-selling actions. We see this as a large and significant tail-risk which appears to becoming increasingly likely as house prices fall.
RBA’s Debelle addressed home prices in his Q&A session on Thursday, saying they are watching home prices. “From what I can tell what we haven’t seen anywhere in the world is a decent fall in house prices in two capital cities at the same time unemployment is going down and the economy is growing at a reasonable pace. This is uncharted territory. Credit is still flowing but at a much slower rate and it’s something we are watching – but that is as much a function of banks willingness to lend and not so much the price. No, RBA, it’s simply the reduction in the credit impulse – the rate of credit growth is sufficient to explain the falls, and no, it’s not time to loosen credit standards again!
Turning to the local markets, the banks were weaker though the week, though with a small upward tick on Friday. The local volatility – or fear index – was still in risk on territory, if down 0.23% to 16.73. CBA closed at 70.37, up 1%, NAB was at 24.00, up 0.25%, ANZ was up 0.16% to 25.71 and Westpac was up 0.23% to 25.73. They are all way down on a year ago. Macquarie closed at 113.32 up 1.13%, having been driven lower by the poor global finance news. Regionals fared less well, with Bank of Queensland down 0.31% to 9.74, as they announced a search for a new CEO, as Jon Sutton resigns. Suncorp was down 0.45% to 13.31 on Friday, and Bendigo and Adelaide Bank slide a little, down 0.09% to 10.61. AMP, continues lower, down 3.32% to 2.33, and Mortgage Insurer Genworth was down0.85% to 2.34, having moved a little higher earlier in the week. The ASX Financials index is sitting near recent lows, if up 0.09% on Friday to 5,621.70, and the ASX 100 ended at 4,676.50, up 0.47%, but below the earlier April 2018 dip. Expect more weakness ahead. The Aussie slide 0.48% to 71.99, having been as high as 73.00 in the week, but the weaker local economic news will likely drive it lower, and we think mid 60’s is possible in the new year. Aussie Gold cross was up 1.31% to 1,733.31 and the Aussie Bitcoin cross was down 6.59% to 4,708.4. We will discuss cryptos more in a moment.
Across to the US, where the Dow erased its gains for the year after plunging Friday on a weak jobs report and concerns over U.S-China trade tensions. In addition, the session was soured by a U.S. labour market report showing the US economy created fewer jobs than expected, and wage growth fell short of forecasts. The fear index was higher, up 9.63% to 23.23, indicating significant concerns and higher volatility. The Dow Jones Industrial Average fell 2.24% to end at 24,389 and is down 1.34% year-to-date. The S&P 500 fell 2.33% to 2,633.08, while the Nasdaq Composite fell 3.05% to 6,969.25. The S&P 100 was also lower down 2.39% to 1,167.57.
U.S.-China trade tensions were thrown into further turmoil after President Donald Trump’s trade adviser Peter Navarro said if issues with China are not resolved during the 90-day ceasefire, the administration would raise existing tariffs on $200 billion worth of Chinese goods.
Tech also contributed meaningfully to the selloff on Wall Street, led by Apple which was down3.57% to 168.49 after Morgan Stanley cut its price target on the tech giant’s shares on fears over a slowing smartphone market in China. That was the third Apple price cut this week following cuts by both Rosenblatt and HSBC, sending Apple’s share price more than 3% lower. Other tech stocks also fell, with Intel down 4.40% to 46.24, Alphabet (Google) down 2.92% to 1,046.58 and Amazon down 4.12% to 1,629.13. The financials index was 1.84% to 415.44, well down over the year now, with Goldman Sachs Group down another 2.40% to 179.67.
Energy, meanwhile, struggled to take advantage of the rally in oil prices, which had followed an agreement by OPEC and its allies to cut production by 1.2 million barrels a day for the first six months of 2019. The oil price was up 1.51% to 52.27.
We need to look in more detail at Cryptos. Bitcoin continued to fall and close to 90% from record highs. Virtual currencies have fallen dramatically in recent weeks, with news of regulatory scrutiny and a hard fork in Bitcoin cash cited as major headwinds for the crypto industry. Cryptocurrencies overall were lower, with the total coin market capitalization at $107 billion, compared to $120 billion on Thursday. Bitcoin was down 7.13%, having traded near a session low of $3,377.40, to end at 3,430.8. Meanwhile the creation of a Bitcoin exchange traded fund is unlikely anytime soon, said SEC Commissioner Hester Peirce, who dissented with the authority’s decision to reject a Bitcoin ETF.
I recorded an interview with local Crypto expert Alex Saunders from Nuggets News, in which we discuss current trends.
The U.S. dollar was lower on Friday amid worry that the Federal Reserve could pause its hike rate increases due to concerns of slowing global growth. The Wall Street Journal reported on Thursday that the Fed is likely to consider a wait-and-see approach after hiking rate increases at its next meeting in December. The U.S. dollar index, which measures the greenback’s strength against a basket of six major currencies, inched up 0.10% to 96.85. However, on a weekly basis, the dollar was set for its biggest drop in more than two months against a basket of its rivals.
Falling U.S. yields have also weighed on the dollar, with the benchmark 10-year Treasury yield at 2.854, down 0.74% after dipping overnight to its lowest level since late August. The 3 month was down 0.57% to 2.396, and the inverted yield curve between the 2 year and 10 year suggests more trouble ahead. Gold was stronger reacting to the market uncertainty, up 0.85% to 1,254,15.
With Brexit still in the mix, the Euro US Dollar ended up 0.27% to 1.1409, and the British Pound US Dollar was down 0.31% to 1.2744. Deutsche Bank ended at 7.719, having broken below 8.000 this week, and was up 0.77% in Friday. Many have said if the bank dropped below 8.000 this would be a significant event – well now it has happened, so risk is on.
So we can conclude that market weakness will continue up to the end of the year, and locally home prices will continue to fall. So to answer my own question, no we are not there yet, in fact I suspect we are still in the early stages of the correction which is coming. And 2019 looks like being THE year!
Global growth is slowing and becoming less well-balanced, while downside risks are rising, particularly for 2020, says Fitch Ratings in its new Global Economic Outlook (GEO).
“The world economy is still
expanding at a rapid pace, but cracks are starting to appear in the
global growth picture,” said Fitch Chief Economist, Brian Coulton
“Eurozone
growth outturns have disappointed once again, world trade is
decelerating and the China slowdown is now fact, not forecast,” added
Coulton.
Growth dynamics within the three main economies have
become more divergent, with US growth still rising on a year-on-year
basis, while growth in the eurozone and China is falling.
A
historically tight US labour market and the ongoing fiscal boost to
growth from higher government spending will keep the Fed on a course for
three more rate hikes in 2019 despite a softer external environment. US
GDP growth remains on track to reach around 3% this year. While we
expect growth to slow next year, the economy will still expand at an
above-trend pace of 2.6%.
But downgrades to the eurozone growth
outlook, which continue a pattern seen in the last few editions of the
GEO, and stubbornly low core inflation now look likely to persuade the
ECB to hold off from raising interest rates until 2020. We are no longer
forecasting the ECB to raise rates in 2019. This will help provide
further support to the US dollar, keeping pressure on emerging markets
(EMs), where financing conditions have tightened significantly.
Our
base case remains a soft landing for global growth in 2020 as US fiscal
support fades. But downside risks – from a faster-than-expected
tightening of global financial conditions as central bank liquidity
shrinks, or an escalation in market fears about eurozone fragmentation –
have increased. Notably, this year has shown the capacity for
tightening global liquidity to adversely affect the growth outlook,
particularly for EMs. Trade protectionism also remains a key downside
risk despite some recent more positive news flow on the US/China trade
war, with the announcement of fresh negotiations and a 90-day extension
of the deadline before the next increase in US tariffs.
Fitch’s
December 2018 GEO sees global growth forecasts unchanged for this year
and next, with growth peaking in 2018 at 3.3% before moderating to 3.1%
in 2019 and then falling below 3% in 2020. Forecasts for eurozone growth
in 2018 and 2019 have been revised down to 1.9% and 1.7%, respectively
(compared with 2% and 1.8% in the September GEO). EM growth forecasts
for 2019 and 2020 have also been cut, partly reflecting tighter
financial conditions in India, Indonesia and Turkey. Our forecasts for
China have not changed in this edition of the GEO, but the slowdown we
have been expecting for a while is now materialising.
Economist John Adams and I discuss the RBA’s latest speech, in which we see confirmation that they are prepared to cut interest rates and run a QE programme in the event of a crisis.
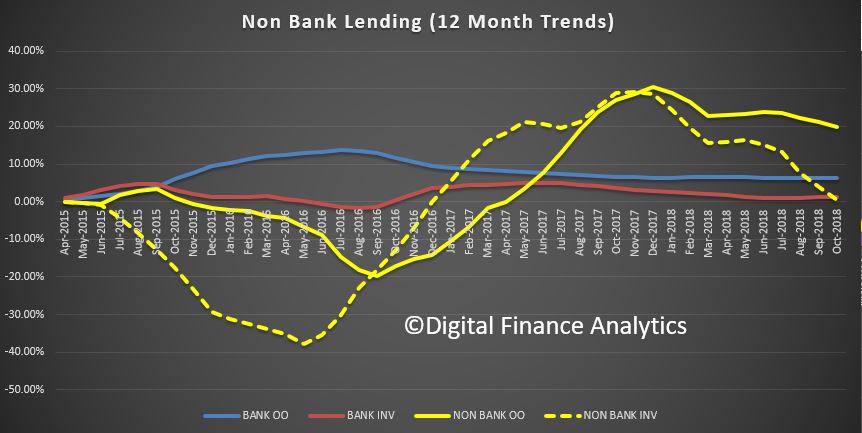
The analysis of the monthly banking stats out last week gives us the opportunity to look across the non-bank sector, relative to the banking sector by comparing the APRA data with the Reserve Bank data series.
We have plotting the rolling 12 month trends, and this chart shows the results.
The striking observation is the relatively stronger growth rate relative to the banks supervised more directly by APRA. Granted APRA does have some responsibilities for the non-bank sector, but appear not to be their main focus.
All lenders have the same obligation with regards to responsible lending, but non-banks are generally more flush with cash, and less constrained by the capital requirements which crimp ADI’s.
Thus we can expect the growth on non-ADI mortgage lending to continue at a faster pace than the bank sector. As a result, we think more risks are building in the financial system.
The Australian Prudential Regulation Authority (APRA) has announced a number of actions against IOOF entities, directors and executives for failing to act in the best interests of superannuation members.
APRA has commenced disqualification proceedings and is seeking to impose additional licence conditions and issue directions to APRA-regulated entities in the IOOF group.
APRA has issued a show cause notice setting out APRA’s intention to direct IOOF Investment Management Limited (IIML) to comply with its Registrable Superannuation Entity (RSE) Licence and impose additional conditions on the licenses of IIML, Australian Executor Trustees Limited (AET) and IOOF Ltd (IL). These entities have 14 days to respond to this notice.
The proposed conditions and directions to comply with conditions seek to achieve significant changes to the identification and management of conflicts of interest by IIML, AET and IL and facilitate APRA’s ability to take further enforcement action should this not occur. The proposed additional conditions on the licences of IIML, AET and IL are based on issues and concerns raised by APRA since 2015 relating to the entities’ organisational structure, governance and conflicts management frameworks, and require the entities to address these within specified timeframes. The proposed directions for IIML relate to an independent report issued by Ernst & Young, the findings of which provide a reasonable basis to conclude that IIML has breached section 52 of the Superannuation Industry (Supervision) Act 1993 (SIS Act), Prudential Standard SPS 520: Fit and Proper and Prudential Standard SPS 521: Conflicts of Interest.
APRA has also commenced proceedings in the Federal Court of Australia to seek the disqualification of five individuals that, at relevant times, were responsible persons of IIML and Questor Financial Services Limited (Questor). The proceedings also seek a court declaration that IIML and Questor (which at the material times were RSE Licensees owned by IOOF Holdings Limited) breached the SIS Act.
The individuals included in the disqualification proceedings are Managing Director Chris Kelaher, Chairperson George Venardos, Chief Financial Officer David Coulter, General Manager – Legal, Risk and Compliance and Company Secretary Paul Vine, and General Counsel Gary Riordan.
The Concise Statement seeks disqualification orders and declarations in relation to breaches of sections 52 and 55 of the SIS Act and Prudential Standards, and associated conduct. As outlined in the Concise Statement, APRA considers that IIML, Questor and the relevant individuals did not appropriately acknowledge and address issues concerning conflicts of interest raised by APRA from 2015 to date. In particular, APRA identified that on three separate occasions in 2015, Questor and IIML contravened the SIS Act by deciding to differentially compensate superannuation beneficiaries and other non-superannuation investors for losses caused by Questor, IIML or their service providers, with superannuation beneficiaries being compensated from their own reserve funds rather than the trustees’ own funds or third-party compensation.
If successful, the disqualification proceedings would prohibit the above individuals from being or acting as a responsible person of a trustee of a superannuation entity.
APRA Deputy Chair Helen Rowell said APRA had sought to resolve its concerns with IOOF over several years but considered it was necessary to take stronger action after concluding the company was not making adequate progress, or likely to do so in an acceptable period of time.
“APRA’s efforts to resolve its concerns with IOOF have been frustrated by a disappointing level of acceptance and responsiveness to the issues raised by APRA, which is not the behaviour we expect from an APRA-regulated entity,” Mrs Rowell said.
“The actions we are now taking are aimed at achieving enduring change to ensure that the trustees of the superannuation funds operated by IOOF fully meet their obligation to put the interests of members ahead of all other interests.
“Furthermore, the individuals included in the proceedings have shown a lack of understanding of their personal and trustee obligations under the SIS Act and at law, and a lack of contrition in relation to the breaches of the SIS Act identified by APRA.”
It was a reflection on 10 years after the GFC. One of the main lessons was an old one: leverage matters.
While acknowledging that household debt is higher in Australia than many other countries, there is little to form a strong conclusion about how much is too much, he said.
Leverage can turn a manageable macroeconomic event into a very hard to manage crisis. The regulatory response has been aimed at addressing this by reducing the leverage in the core of the financial system, while being mindful that the risk and leverage is not excessively relocated elsewhere.
The second lesson is that timely policy responses are effective. In a crisis, go fast and go hard. Don’t die wondering.
The third lesson is that the plumbing can sometimes really matter. Keep the credit pipes flowing.
Fourth, targeted policy responses/interventions are effective. Use Bagehot pricing, where these interventions are priced to work in bad times but not in the good times.
But the questions of how much debt is enough and how much is too much remain unresolved.
The lessons learned from the GFC will be useful, provided they are not forgotten. But there will be new challenges ahead and the source of the next crisis will probably be different.
Some are taking this as a hint the RBA is ready to cut rates and apply stimulus to the economy! Unnatural acts?
It is now just over 10 years since the date that people most associate with the Global Financial Crisis (GFC), namely 15 September, the day that Lehman Brothers filed for bankruptcy.[1] There have been quite a number of articles written in recent months looking back at that time and the period leading up to it.[2] It is interesting to read the differing perspectives on the same set of events, especially those that recount events that I had a ringside seat at, or was even in the ring itself. As I have said recently, it’s a bit like the standard line about the sixties, those who can remember the GFC probably weren’t there. The sleep-deprived haze that was pervasive at the time affects the memory. Critical decisions were made under extreme duress and fatigue, particularly in the US, which by and large stack up well with the passage of time.
Today I am not going to give another detailed account of what happened. I will talk about some of the events, but the main thing I intend to do is to talk about some of the lessons learned and relearned from the crisis. This list of lessons is by no means comprehensive. I will also discuss some questions that arise from the crisis that remain unresolved, at least in my mind. They are questions which I think should be a focus of the economics profession. Answering them will help guide policymakers should they be faced with similar situations to the one we confronted in 2008.
I am going to talk about both macro and finance today. Some events can be seen through mostly a macro lens with finance playing a lesser role (the seventies in Australia is an example), some events can be seen with the spotlight on finance with macro as a sideshow (e.g., the dotcom bubble). I don’t think it is possible to look at the GFC and talk about one without the other.
It is clearly important to integrate finance into macroeconomic analysis. Indeed, the failure to do that is a criticism that is often levelled at central banks and the macroeconomic profession in the aftermath of the crisis. I think this criticism is overstated. One obvious counter example is the work of Ben Bernanke himself on the Great Depression, Japan and the financial accelerator. His large body of work very much informed the Fed’s actions during the GFC.
How should this integration occur? Should finance be built directly into the models that inform (though do not dictate) policymaking decisions? There is a body of work directed at that goal currently underway.[3] Building finance into macro models is one approach but by no means the only one. At the very least though, macroeconomics should have an understanding of finance and vice versa. Macroeconomics is like the model of the engine, finance is the oil that lubricates the engine. One can understand how the engine works without really needing to worry about the oil, as long as the oil is flowing. But at least a basic understanding of the plumbing is useful when the oil dries up.
The key lesson that comes from the crisis that I will highlight today is leverage really matters. Leverage significantly magnifies the effect of any shock that hits the economy. Leverage might not start the fire, but it will pour petrol on a burning platform. At the same time, you need to keep the credit flowing to prevent the economy from seizing up.
Ballad of a Thin Man
Something’s happening here but you don’t know what it is, do you Mr Jones?
That is the Dylan version of the question Queen Elizabeth posed: why didn’t anybody see this coming? There were those who saw the storm clouds on the horizon. Michael Lewis wrote a book about some of them. Though often the storm didn’t quite take the form these people were expecting. Very few appreciated the extent of the financial interconnectedness and what that implied. For example, one common prediction was there would be a US dollar crisis with consequent calamity, but, in the event, the US dollar appreciated through the crisis.
Looking back on how financial markets reacted through 2007, the onset of the crisis is often dated from BNP Paribas shutting three funds with subprime mortgage exposure on 9 August. That caused a short-lived wobble in equity markets, but after that it was onwards and upwards for much of the rest of the year, with the equity market peaking in November. The equity market was the lens through which the public saw events unfold. So by that metric, 2007 was fairly benign.
Macroeconomists generally looked at what was unfolding in the US housing market and expected that its spillover to the rest of the economy would be contained. The slowdown would be mild and, to an extent, welcome in containing the inflationary pressures that had been building.
But the fixed income market took fright and got more and more scared through 2007. Uncertainty increased about the quality and value of asset-backed securities and the assets that underpinned them. There was further uncertainty about whose books these assets resided on, generating a marked rise in counterparty risk aversion amongst financial institutions. That is, institutions became less willing to lend to each other, both because of concerns about the financial strength of the counterparty as well as a desire to hoard any available liquidity, should they themselves need it. The indicator of the tension in fixed income markets is the LIBOR/OIS spread (BBSW/OIS here in Australia), which summarises the unfolding of the crisis well (Graph 1).
Graph 1
These tensions continued to increase with a rolling series of flare-ups, including notably the rescue of Bear Stearns by JP Morgan in March 2008. By this stage, these concerns were increasingly reflected in the equity market too. GDP growth in a number of economies started to slow, but it was not until the fourth quarter 2008 when the economic forces took hold with a vengeance.
Lehmans filed on the Monday morning Australian time. It is interesting to look back at the time. That day was a relatively quiet one in financial markets. Lehmans wasn’t the turning point. The actual zenith of the crisis was still to come in the following weeks. AIG, the poster child of financial connectedness, was rescued. TARP was rejected by Congress and then passed after financial tumult broke out. The prime mutual fund Reserve broke the buck. Washington Mutual failed.
Markets were driven by fear, with huge swings in prices. Many of these swings occurred late in the New York trading day, which was early in the Australian day. The correlation between the Australian dollar and the US equity markets through those periods was indicative of the extremely high degree of co-movement across all markets. Markets regularly recorded ‘25 standard deviation events’ in the words of then Goldmans CFO David Viniar. These sorts of events are only supposed to be happening once in the lifetime of the universe, which says something about the risk models that were being used at the time.
My recollection of the worst of it was in the early hours of Saturday morning 11 October after we had been intervening in the foreign exchange market through the Friday evening to provide liquidity into an almost completely illiquid market. Talking on the phone to the RBA desk in New York, they reported that US Treasuries, the most liquid market in the world, had effectively seized up.
It is worth recounting this, just to recall how dislocative and disruptive these developments were. It was really not clear how this was going to end, except badly.
The fourth quarter of 2008 was bad. Global GDP declined by 1.5 per cent. GDP in the US fell by 2.2 per cent. In Australia, GDP contracted by 0.5 per cent (Graph 2). The impact was particularly severe in global trade, which collapsed as trade finance dried up because of extreme counterparty risk aversion (Graph 3). Companies and banks were unwilling to accept the guarantee of another bank that underpinned the trade lines of credit. They had little confidence they were going to be paid.
Graph 2
Graph 3
The breadth and depth of the impact was remarkable. Output fell by more in the Great Depression, but the Great Depression was not synchronised nor as widespread as this was.
These macroeconomic and financial developments very much underpin the nature of the global policy response, both monetary and fiscal.
There was a fiscal response in many (though not all) countries, buttressed by the G20 leaders meeting in April 2009.[4]
Central banks responded by reducing policy rates rapidly to very low levels. Some of these actions were coordinated in a hitherto unprecedented manner. Central bank balance sheets expanded rapidly (Graph 4). The re-intermediation by central banks mitigated the withdrawal of intermediation by the banking sector. A part of that increase in the balance sheet addressed the large counterparty risk aversion. Central banks were willing to stand between institutions that were unwilling to deal with each other, as well as accommodate the rapid increase in demand for liquidity. That large increase in central bank balance sheets mitigated the large contraction in the financial sector, which goes a long way to explaining why it has still yet to lead to a marked rise in inflation, despite this being foreshadowed by a number of commentators over the past decade.
Graph 4
The central bank actions were designed to alleviate the credit crunch. An alphabet soup of programs was implemented in the US to address the dysfunction in a number of markets,[5] with similar programs in other countries. The aim was to keep the credit flowing and limit the need for fire sales wherever possible.
An important motivation for this first phase of quantitative easing (QE) in the US and elsewhere was addressing the market dysfunction. Indeed, for a time, the Fed characterised it as credit easing. This first phase of QE was particularly effective. My view is that subsequent phases of QE had diminishing returns, though I acknowledge that much of the empirical evidence tends not to find that.
A question worth considering about QE is: if QE was effective on the way in, then surely there must be a large degree of symmetry? Hence we should expect to see similar but opposite effects on the way out. If there were diminishing returns to QE, then it might take a little while before we see the full impact of the reduction in the Fed’s balance sheet that is currently underway, but the effect should grow over time.
Turning to Australia, why did Australia come through the crisis better than many other countries? There were a number of contributing factors.[6] Good luck certainly played a role. But the policy actions made an important contribution too. Monetary policy was eased rapidly. The Australian banking system was much less affected by the problems bedevilling banking systems in other countries (partly through good luck). This meant that the transmission of the significant easing in monetary policy to the economy worked pretty much as normal. The exchange rate depreciation combined with the fact that the Australian economy could adapt flexibly to the depreciation were beneficial.
Fiscal stimulus in Australia in my view was absolutely necessary and was a critical factor behind Australia’s good economic outcomes.[7] While one can argue about the exact nature of the implementation, the fact that it was designed to take effect quickly was vital in the circumstances: ‘go hard, go early, go to households’ as Ken Henry put it.
China was certainly a major contributor to Australia’s resiliency. But it is important to remember that China’s strong growth at the time was a direct consequence of their large fiscal stimulus. Hence it seems inconsistent to me to argue that China ‘saved’ Australia, as a result of its fiscal stimulus, while simultaneously dismissing the direct impact of fiscal stimulus here in Australia.
What lessons did we learn (and relearn) from this experience?
Policy capacity matters, both monetary and fiscal. Fiscal space is really important. We still have that in Australia. It is less clear there is fiscal capacity in some other countries.
Monetary capacity matters too. The Reserve Bank has repeatedly said that our expectation is that the next move in monetary policy is more likely up than down, though it is some way off. But should that turn out not to be the case, there is still scope for further reductions in the policy rate. It is the level of interest rates that matters and they can still move lower. We have also been able to examine the experience of others with other tools of monetary policy and have learned from that. Hopefully, we won’t ever have to put that learning into practice. QE is a policy option in Australia, should it be required. There are less government bonds here, which may make QE more effective. But most of the traction in terms of borrowing rates in Australia is at the short end of the curve rather than the longer end of the curve, which might reduce the effectiveness of QE. The RBA’s balance sheet can also expand to help reduce upward pressure on funding, if necessary, as occurred in 2008.[8]
Finally, the floating exchange rate matters and remains an important shock absorber for the Australian economy.
Everything Flows
I will now step into the plumbing and talk briefly about the lessons learned on liquidity provision and other measures undertaken to keep financial markets functioning as best as possible.
The RBA’s balance sheet expanded in Australia for a number of reasons.[9] Exchange settlement balances at the RBA increased as banks’ preference for liquidity increased. We were able to accommodate this in our daily market operations. Part of the increased demand for liquidity arose from the large rise in counterparty risk aversion that I referred to earlier. We also offered more repos at longer terms to our counterparties, which saw our domestic repo book approximately double in size and the average maturity increase from 20 days to four months. This helped to provide some additional certainty to funding and mitigate some of the upward pressure on bank funding costs.
The balance sheet of the central bank, and that of the public sector more generally, has the capacity to intertemporally smooth more than any other balance sheet in the economy, be it financial institutions, corporates or households. The capacity to do this is particularly important when you are dealing with a systemic risk event, as was the case in the GFC. The central bank can intermediate extreme counterparty risk, functioning as much as intermediary of last resort as lender of last resort.
Another example of this was the provision of the FX swap lines.[10] These facilities were introduced to address the global shortage of US dollars (outside the US), which was causing a substantial dislocation in swap markets. In our case, we were able to intermediate the provision of US dollars into the Asian time zone, where this shortage was particularly acute. By the end of the trading day in the US, these shortages had often abated. Note that the swap lines were not about providing US dollars to the Australian banks to meet US dollar obligations. The Australian banks were predominantly funding Australian dollar assets (the hedges on their US dollar borrowing provided them with the US dollars as these matured). They needed Australian dollars rather than US dollars.
On 12 October, the Australian Government introduced a guarantee on wholesale debt and deposits. This followed on from the introduction of the guarantee in Ireland on 30 September. With the guarantee in place in many other countries, Australian banks would have been at a significant disadvantage in terms of funding costs without the guarantee. In addition, the guarantee allowed the banks to access another group of investors who had an appetite for sovereign credit but not bank credit.
It is interesting to consider the question of how much the guarantee addressed the issue of quantity or price. There was a period of time where debt markets were closed at any price in the last quarter of 2008. But at some point it became more an issue of price rather than quantity. As an indication of the price that might have had to be paid, Goldmans issued a bond around this time at a spread of 500 basis points. It is also worth noting that short-term funding continued to be issued by the Australian banks without the need for a guarantee.
Both the RBA operations and the government’s funding guarantee were priced such that usage would decline as market conditions improved, and, indeed, that is what happened. The many Fed facilities introduced to address market dysfunction were priced the same way. That is an important lesson which has been around since the time of Bagehot. These facilities were introduced to facilitate the flow of credit to the real economy at a reasonable price and, in some cases, alleviate the need for asset fire sales, which have the capacity to tip markets and the economy into a worse equilibrium.[11]
It is also worth noting that the depreciation of the exchange rate also helped out on the funding side. With a lower exchange rate, a given amount of $US funding translates into more Australian dollars to fund Australian dollar assets. Unlike in some other countries, the maturity-matched hedging of the banks’ offshore funding meant there was no issue of currency mismatch. Indeed the CSAs (Credit Support Annexes) associated with those hedges actually provided a short-term source of additional funding.[12]
Finally, the similarity of the business models of the Australian banks was probably beneficial in the GFC. There was not much to differentiate between them, which meant that the counterparty uncertainty present in other banking systems was nowhere near as prevalent here.
The Australian banks’ similarity is not so obviously beneficial in the current circumstance. Their similar behaviour and similar reaction functions to events such as falling house prices run the risk of amplifying the downturn in the housing market.
The crisis very much demonstrated the critical importance of keeping the lending flowing. The lesson is that countries that did that fared better than countries that didn’t. That lesson is relevant to the situation today in Australia, where there is a risk that a reduced appetite to lend will overly curtail borrowing with consequent effects for the Australian economy.
Karma Police
After the crisis has come the regulatory response, coordinated by the Financial Stability Board (FSB).[13] In the banking space, the regulation has included:
The Basel capital standards have required the banks to hold more capital thereby reducing leverage.
The Liquidity Coverage Ratio (LCR) had addressed liquidity/runnable funding.
The Net Stable Funding Ratio (NFSR) has addressed funding mismatch/maturity transformation.
The Volcker rule (in the US), and increased balance sheet costs more generally, have reduced banks’ capacity to provide services such as market-making and repo in other jurisdictions.
The first of these has clearly reduced the leverage in the core banking system. Some argue that the leverage should be reduced further (see below), but unambiguously banks hold more capital than they did pre-crisis.
The enhanced liquidity regulation in Australia has been in place since the beginning of 2015, and its effects have been present even before then as the banks adjusted their funding and assets to meet the new requirements. In other parts of the world, I think the effect of the liquidity regulation has been diluted by the large liquidity provided by the greatly expanded central bank balance sheets.
As the Fed balance sheet is shrinking, it is likely that the liquidity regulation will start to bite more in the US. Indeed it is possible we are starting to see some effects now, not necessarily in aggregate, but in particular parts of the money markets.
As important as the liquidity regulation is, in my view, asset quality matters more than funding in the end.[14] If asset quality remains sound, as a creditor of the bank, I should be confident of being repaid. An example of this is to compare the German domestic banks and the Australian banks. The German banks were predominantly deposit funded. However, with relatively low returns on offer in Germany, they sought out higher-yielding assets offshore including RMBS (residential mortgage-backed securities) and CDOs (collateralised debt obligation) in the US. In contrast, the Australian banks utilised more wholesale funding but were able to earn high returns on their domestic Australian assets. During the crisis, the German banks were faced with much greater asset quality issues than the Australian banks. They had $US asset positions that were difficult to fund in the market, notwithstanding the fact that their funding (in euros) is regarded as more stable.
One (intended) impact of the Volcker rule and similar regulations is that banks have retreated from their former role as market makers and risk warehousers. This was by design, to ensure that the core part of the intermediation process would not be affected by concerns about the quality of assets on their books accumulated through these activities, particularly given the difficulty in distinguishing between risk warehousing and speculation (which can be observationally equivalent).
What does this imply for market dynamics? It is distributing the risk from the banking sector to real money such as asset managers. That is fine in principle, as asset managers have more capacity to absorb and manage the risk with less disruption to the real economy. But it still remains an open question as to how quickly people with deployable capital respond to dislocations in market prices, given that the banks play a considerably smaller role.
That said, one should be careful not to look at the past with rose-coloured glasses. Banks didn’t rush in to catch a falling knife when asset prices were falling. Liquidity pockets occurred at least as much in the past, with one good example being the frequency of large big figure movements in foreign exchange rates. Bid-ask spreads used to widen a lot in the past too. The ultimate widening in bid-ask spread back then was not to answer the phone.
In addition, the market liquidity provision mechanism is now more machines and less people. The shape of liquidity has changed and with it market dynamics in a stress environment. The potential volatility of markets has increased (even though actual volatility has generally been low).
In such circumstances, some have talked about central banks acting as market-maker of last resort, stepping in to provide liquidity in a dislocated market (like foreign exchange intervention). This is an interesting question to consider. I think it is a mischaracterisation to call this market-making. It is more likely the central bank will be the buyer of last resort. It may well be some time before the central bank can sell on the asset at a reasonable price. This might well be justified to prevent fire-sale dynamics taking hold, but it should be recognised for what it is, which is not market-making. The potential implications for central bank balance sheets also need to be thought through.
One lesson from any number of crises past is that it is almost inevitable the next crises will originate somewhere different. The inevitability of this in part arises because of the reforms introduced to address the sources of the previous crisis. So where might one possible location of the next crisis lie?
To me, one possibility is that it will involve central counterparties (CCPs). They have a high degree of interconnectedness, considerably greater than before, and very much sit at the heart of the financial system today. Their resilience is of first order importance, as they potentially constitute single points of failure. Much has been done to increase their resilience, recovery planning and resolvability already, including by my colleagues at the RBA. The FSB has a work program to address CCP issues, but it remains a work in progress.
How Much Is Enough?
Finally, I will pose a critical, but unresolved, question: what is the right amount of leverage in the system? When is there too much?
Leverage was at the heart of the GFC. Leverage in the banking system and highly leveraged non-bank institutions like Bear Stearns and Lehmans played a fundamental role in significantly amplifying the crisis. Excess leverage in housing sectors, such as those in the US, Ireland and Spain, was incredibly damaging. This has led to the long-lived effects we still see today, both economic and political.
But we still don’t really have a great handle on what level of leverage is dangerously excessive for governments, households, banks and corporates. This surely is a major challenge for the economics profession to address.
As I said earlier, banks have increased capital and reduced leverage. But those such as Anat Admati still make the argument that further reduction in leverage is necessary.[15]
In terms of government, public debt is sustainable until it is not. It is not at all clear whether there is a threshold of sustainability. We have seen crises erupt at very different levels of public debt. Public debt in Japan is currently at 240 per cent of GDP, but there has not been a crisis. We have seen other countries have debt crises at considerably lower levels of debt to GDP. The market can turn on these countries very quickly.
We do know that unhedged borrowing in foreign currency significantly increases the vulnerability. And, relatedly, the European situation highlights the issues that arise when the government doing the borrowing and the central bank are part of the same currency union but not the same country.
On the private sector side, what are the appropriate metrics?
Corporate debt sustainability is assessed in terms of debt to equity ratios or serviceability. It is probably the form of debt about which we have the best understanding of sustainability.
But what about household debt? Debt to income is commonly used, but that is dividing a stock by a flow, a metric not commonly used for corporates. We can look at household leverage, but that is very much dependent on the value of the denominator, house prices in this case, and we know they can decline quite rapidly. Serviceability can be a useful metric, but we don’t have a good sense of sustainability at the aggregate level.[16] The quality and distribution of household debt matters as well as the level. The policy measures implemented in Australia over recent years have been aimed at improving the quality, and hence sustainability, of household debt.[17]
While acknowledging that household debt is higher in Australia than many other countries, there is little to form a strong conclusion about how much is too much.[18]
How much debt is enough and how to best manage the risks are two of the large questions remaining unanswered, ten years after the GFC.
The ABS released their Retail Turnover stats for October 2018. Still looks pretty sluggish. Perhaps Christmas will accelerate the spend. We will see! New South Wales reported a fall, well behind Victoria and Queensland.
They say:
The trend estimate rose 0.2% in October 2018. This follows a rise of 0.2% in September 2018, and a rise of 0.2% in August 2018.
The seasonally adjusted estimate rose 0.3% in October 2018. This follows a 0.1% rise in September 2018, and a rise of 0.3% in August 2018.
In trend terms, Australian turnover rose 3.5% in October 2018 compared with October 2017.
The following industries rose in trend terms in October 2018: Food retailing (0.2%), Other retailing (0.5%), Cafes, restaurants and takeaway food services (0.2%), and Clothing, footwear and personal accessory retailing (0.2%). Household goods retailing (-0.1%), and Department Stores (-0.1%) fell in trend terms in October 2018.
The following states and territories rose in trend terms in October 2018: Victoria (0.4%), Queensland (0.5%), South Australia (0.3%), Tasmania (0.3%), and the Australian Capital Territory (0.2%). Western Australia was relatively unchanged (0.0%). New South Wales (-0.1%), and the Northern Territory (-0.8%) fell in trend terms in October 2018.
Online retail turnover contributed 5.9 per cent to total retail turnover in original terms in October 2018, a rise from 5.6 per cent in September 2018 and the highest level recorded in the series. In October 2017 online retail turnover contributed 4.7 per cent to total retail.
DFA has released the November 2018 mortgage stress and default analysis update. Across Australia, more than 1,015,600 households are estimated to be now in mortgage stress (last month 1,008,000). This equates to 30.9% of owner occupied borrowing households. In addition, more than 22,500 of these are in severe stress. We estimate that more than 61,000 households risk 30-day default in the next 12 months.
We continue to see the impact of flat wages growth, rising living costs and higher real mortgage rates. The latest RBA data on household debt to income to June reached a new high of 190.5[1]. This high debt level helps to explain the fact that mortgage stress continues to rise. Bank losses are likely to rise a little ahead.
Our analysis uses the DFA core market model which combines information from our 52,000 household surveys, public data from the RBA, ABS and APRA; and private data from lenders and aggregators. The data is current to the end of November 2018. We analyse household cash flow based on real incomes, outgoings and mortgage repayments, rather than using an arbitrary 30% of income.
Households are defined as “stressed” when net income (or cash flow) does not cover ongoing costs. They may or may not have access to other available assets, and some have paid ahead, but households in mild stress have little leeway in their cash flows, whereas those in severe stress are unable to meet repayments from current income. In both cases, households manage this deficit by cutting back on spending, putting more on credit cards and seeking to refinance, restructure or sell their home. Those in severe stress are more likely to be seeking hardship assistance and are often forced to sell.
Martin North, Principal of Digital Finance Analytics says this rise in stress, which has continued for the past 6 years, should be of no surprise at all. “Continued rises in living costs – notably child care, school fees and food – whilst real incomes continue to fall and underemployment is causing significant pain. Many are dipping into savings to support their finances.” The latest ABS GDP numbers confirmed the falling savings ratio.
Indeed, the fact that significant numbers of households have had their potential borrowing power crimped by lending standards belatedly being tightened, and are therefore mortgage prisoners, is significant. More than 49% of those seeking to refinance are now having difficulty. This is strongly aligned to those who are registering as stressed. These are households urgently trying to reduce their monthly outgoings”.
In addition, negative equity is now rearing its head. Data from APRA, the Property Exposures figures – showed that banks wrote nearly 26,000 new mortgages with a loan to value ratio of more than 90%, and a further 51,000 with an LVR of between 80 and 90 percent. That is 20% of all loans written in the same period. I would expect these numbers to fall significantly, as lenders tighten their standards further.
But it’s also worth remembering that in some cases existing borrowers have pulled more equity out to allow them to pass funds to their kids – the so called bank of Mum and Dad, and in the case of a forced sale, the market value may well overstate the true recovery value of the property. Using a property as an ATM does not work in a falling market.
Last month, a Roy Morgan survey of 10,000 borrowers found 8.9 per cent were slipping into negative equity — up from 8 per cent 12 months prior — which would work out to around 386,000 Australians.
We have run our own analysis with data to the end of November and on my modelling currently there are around 400,000 households across the country in negative equity, both owner-occupiers and investors. There are about 3.25 million owner-occupier borrowers and at least 1.25 million investors, so around 10 per cent of properties are currently underwater.
We run a range of potential scenarios, but if our central case works out, with an average fall of 20-25 per cent, our modelling suggests that around 650,000 households would fall into negative equity. My more severe case, if an international crisis hits is for a 40 per cent price fall. Then you’re getting close to one million households. That would be catastrophic for the economy. That’s analogous to what happened in Ireland where prices dropped 40 per cent. A decade later, there are still people in negative equity who’ve never recovered.
The next question to consider is which households are being impacted. In fact, negative equity is touching “lots of different segments” of the market for different reasons, but collectively it is an “early warning sign” for what is to come.
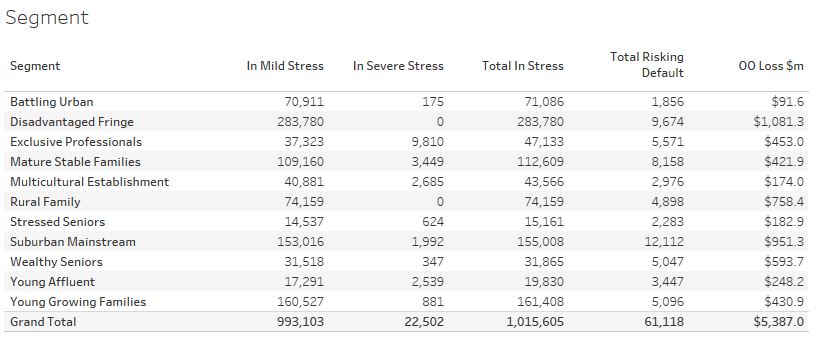
Probability of default extends our mortgage stress analysis by overlaying economic indicators such as employment, future wage growth and cpi changes. Our Core Market Model also examines the potential of portfolio risk of loss in basis point and value terms. Losses are likely to be higher among more affluent households, contrary to the popular belief that affluent households are well protected. This is shown in the segment analysis below:
Stress by the numbers.
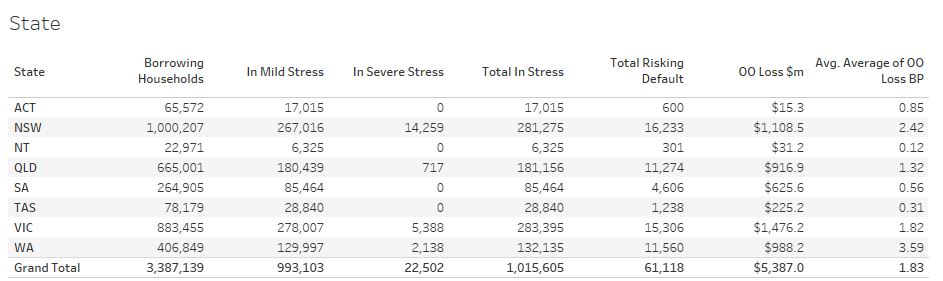
Regional analysis shows that NSW has 281,275 households in stress (272,536 last month), VIC 283,395 (281,922 last month), QLD 181,156 (178,015 last month) and WA has 132,135 (132,827 last month). The probability of default over the next 12 months rose, with around 11,560 in WA, around 11,300 in QLD, 15,300 in VIC and 16,200 in NSW.
The largest financial losses relating to bank write-offs reside in NSW ($1.1 billion) from Owner Occupied borrowers) and VIC ($1.47 billion) from Owner Occupied Borrowers, though losses are likely to be highest in WA at 3.6 basis points, which equates to $1,000 million from Owner Occupied borrowers.
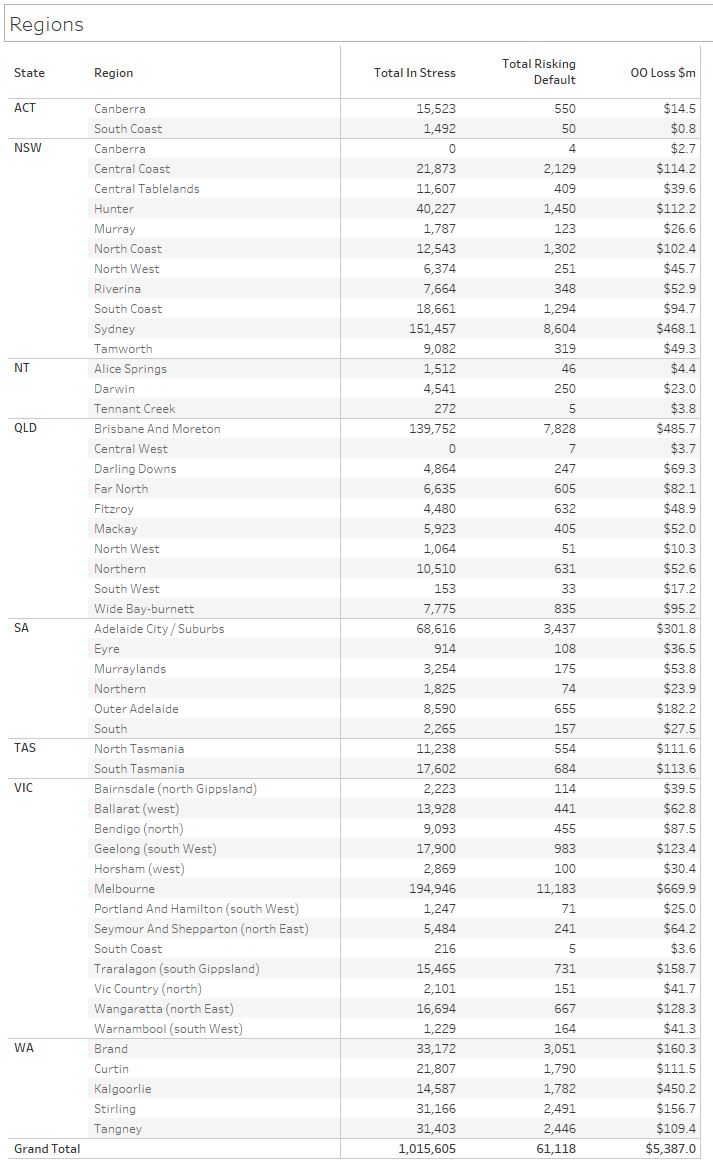
A fuller regional breakdown is set out below
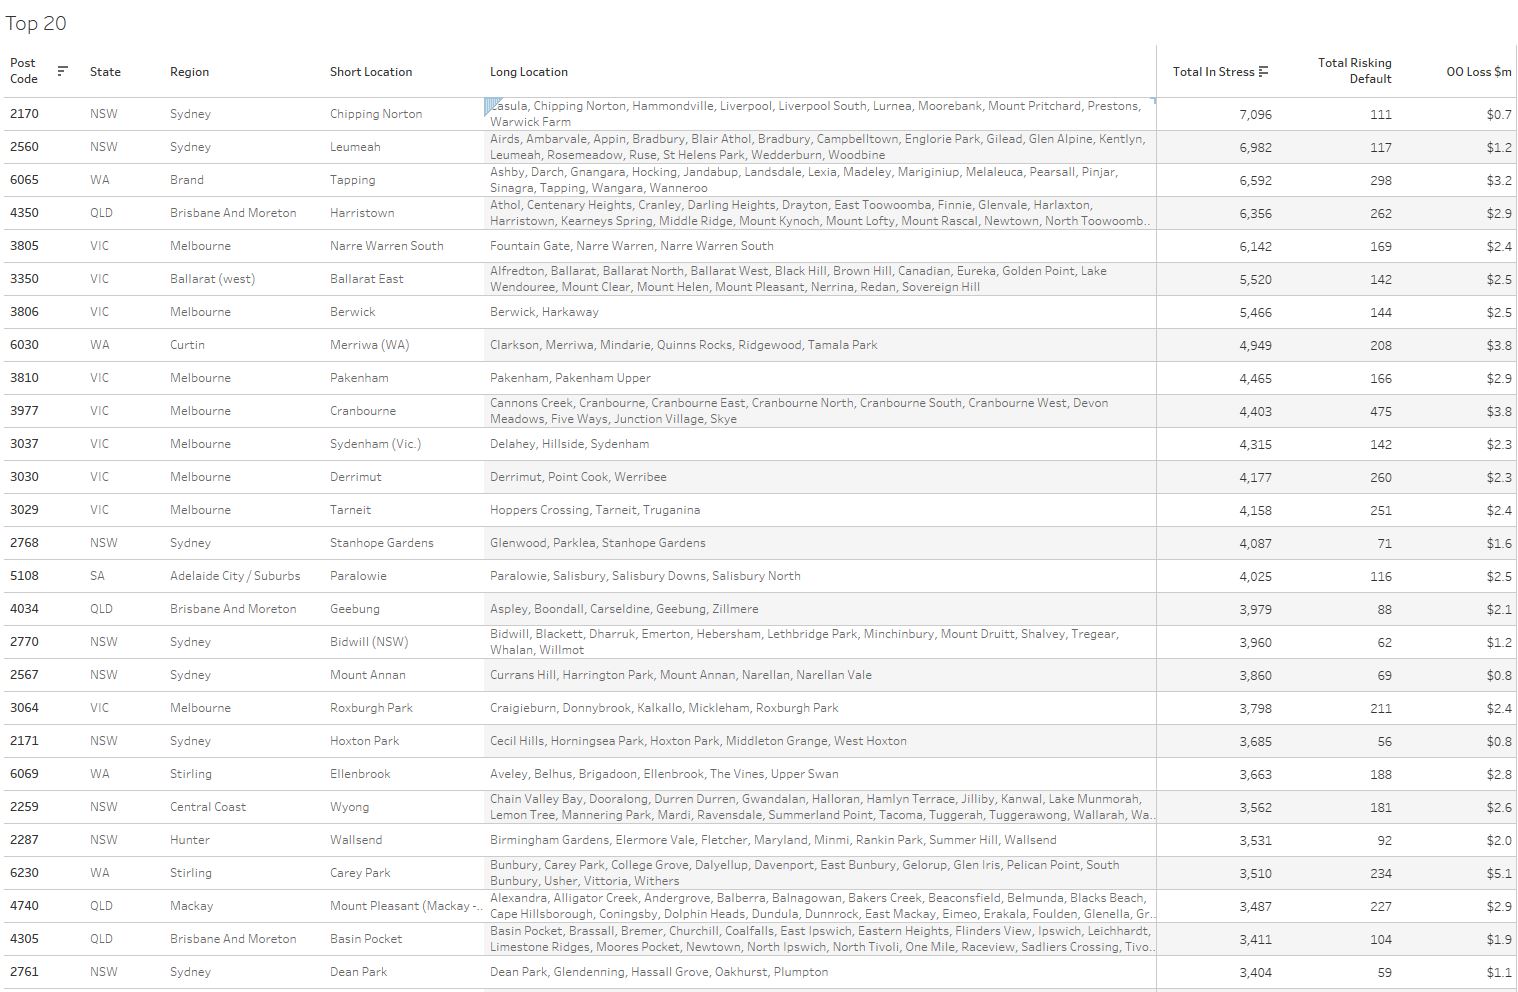
Here are the top postcodes sorted by number of households in mortgage stress.
[1] RBA E2 Household Finances – Selected Ratios June 2018
You can request our media release. Note this will NOT automatically send you our research updates, for that register here.
[contact-form to=’mnorth@digitalfinanceanalytics.com’ subject=’Request The November 2018 Stress Release’][contact-field label=’Name’ type=’name’ required=’1’/][contact-field label=’Email’ type=’email’ required=’1’/][contact-field label=’Email Me The November 2018 Media Release’ type=’radio’ required=’1′ options=’Yes Please’/][contact-field label=”Comment If You Like” type=”textarea”/][/contact-form]
Note that the detailed results from our surveys and analysis are made available to our paying clients.