In Sydney 665 properties were listed and 291 were sold. 79 were withdrawn. Last week Sydney ended up with a 48.7% clearance result, so it will be interesting to see if there is any final recover today, as more results come in.
Melbourne listed 963 properties and 468 sold with 15 withdrawn. Last weeks final result was 57.3%.
Brisbane listed 82 and sold 22, with 3 withdrawn, Adelaide listed 57 and sold 25, with 6 withdrawn and Canberra listed 62 and sold 36 with 3 withdrawn.
For more on how the results are collated, and how believable they are see, see our video “Auction Results Under The Microscope”.
Welcome to our latest summary of finance and property news to the 26th May 2018 with a distinctively Australian flavour.
Watch the video, listen to the podcast, or read the transcript.
I had a number of interesting discussions with people who follow our analysis of the property market this past week. One in particular which stood out was from Melbourne who told me that in February 2017 he decided to sell his home, and got an indication it would sell conservatively for 1.3 million dollars. After a delay he took it to auction in August 2017 and struggled to see $1.25 million. But that property is now worth $1.15m a $150,000 drop from Feb 2017 to May 2018 or 11%. He also told me that back in 2017 he could have got a mortgage of $980,000, but now, on the same financial basis he can only access $670,000 today.
That in a nutshell is what is happening in the major markets, with people’s mortgage borrowing power being curtailed, and as a result home prices are falling. And they will fall further.
We had a bevy of analysts revising down their forecasts for future home prices this week. It is tricky to determine the extent of any fall ahead, and most predictions will of course be wrong. But the more significant factor in play is the significant change in the atmospherics around the housing sector. More are going negative. And when the largest lender in Australia signals they expect a fall, even a mild one, this is significant.
Recently Morgan Stanley said it is predicting property prices could fall by about 8% in 2018, and lending by more than a third. Morgan Stanley suggests there’ll not only be further price weakness in the months ahead, but also the likelihood of renewed softening in building approvals. It says these two factors will likely weigh on household consumption and building activity, seeing Australian economic growth decelerate, rather than accelerate, this year.
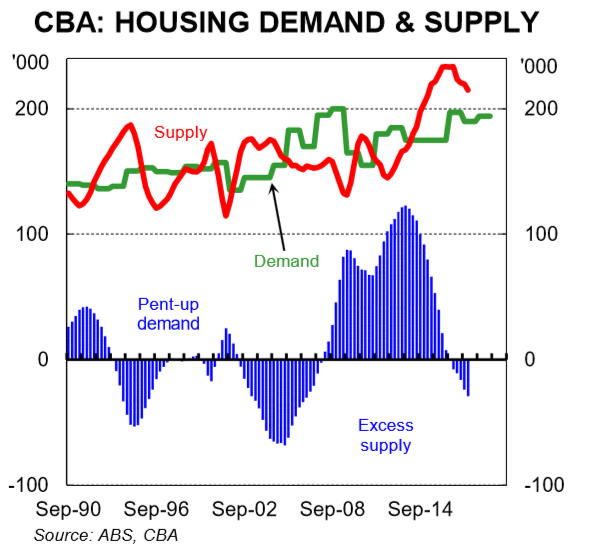
CBA has also gone negative on housing, now forecasting a mild correction. Gareth Aird, senior economist at CBA says that Australian residential property prices have fallen over the past six months. Additional declines appear likely over the next 1½ years due to a further tightening in lending standards, a continued lift in supply, potentially higher mortgage rates and more rational price expectations from would-be buyers. But he says a hard landing, however, looks unlikely and “is not our central scenario”.
We discussed this analysis in more detail in our recent release “Another Bank Goes Negative On Housing” which is still available. And remember CBA is the largest mortgage lender for owner occupied loans. Until recently they were bullish on prices, so this reversal is significant.
And UBS, who called the top of the market earlier than most, says macroprudential tightening ‘phase 3’, is a ‘game changer’ that will materially further tighten credit ahead, with higher living expense assumptions & debt to-income limits cutting borrowing capacity ~30-40%. Indeed, they says, housing is already weakening more quickly than our bearish view, with home loans dropping by ~10% since Aug-17, before the full Royal Commission impact. We have shifted our base case towards our ‘credit tightening scenario’, where home loans falls ~20%, credit growth drops to ~flat, prices fall persistently, & the RBA holds for longer. This coupled with record housing supply in coming years & a slump in foreign buyers sees us downgrade our house price outlook to fall 5%+ over the next year; below our prior 0 to -3% y/y. They conclude that housing activity will correct & prices to fall; still with downside risk: We still expect commencements, activity & prices to have an ongoing ‘downturn’ until at least 2019 – with downside risk from a ‘credit crunch’ scenario amid regulatory tightening & the Royal Commission. But housing should not ‘crash’ without (unexpected) RBA rate hikes or higher unemployment. So that’s ok then…
CoreLogic added some colour to the question of home prices by assessing home price growth across each decile, which confirms that values have fallen fastest at the premium end of the market. The broad trend findings in the CoreLogic May Decile Report showed that values have been falling on an annual basis across the 10th decile (the premium end of the market), while all other valuation deciles enjoyed positive (albeit restrained) growth over the twelve months to April 2018. National dwelling values were 0.2% higher over the 12 months to April 2018 – the slowest annual rate of growth since values fell -0.3% over the 12 months to October 2012. Analysing deeper at a decile level, it was only the most expensive 10% of properties that recorded a fall in values over the year (-4.3%) and all other sectors recorded annual growth greater than 0.2%.
In Sydney the most expensive decile, have fallen 7.2% over the past year, while in Melbourne the same decile fell just 2.4%. In contract the cheapest 10% of houses rose 1.5% in Sydney, and 11.9% in Melbourne over the past year. This is thanks partly to first home buyer stamp duty concessions implemented by both state governments from 1 July 2017. But be warned, if Perth is any guide, the top of the market falls first, but other sectors soon follow. This is one reason why we continue to hold the view prices will drop further than many analysts are predicting.
The credit tightening is real, borrowing power is being reduced, and investors are voting with their feet. We continue to see investors planning to exit the market before prices fall further. If you want further evidence, look no further than the latest auction clearance rates. CoreLogic says the combined capital city auction market continues to soften throughout 2018; while volumes have remained relatively steady over each of the last 3 weeks the weighted average clearance rate has continued to decline. Last week, the combined capitals returned a final auction clearance rate at a record year-to-date low of 56.8 per cent, the last time clearance rates were tracking at a similar level was in early 2013. With 2,100 homes taken to auction last week almost half of these failed to sell, over the same period last year the clearance rate was a much higher 73.1 per cent across 2,824 auctions.
In Melbourne, the final auction clearance rate increased last week across a slightly lower volume of auctions, with 62 per cent of the 1,033 auctions reported as selling, up on the previous week when the final clearance rate across the city dropped below 60 per cent (59.8 per cent- 1,099 auctions).
Sydney’s final auction clearance rate fell to 54 per cent last week, the lowest recorded since late 2017, with 672 homes taken to auction which was lower than the week prior when 787 auctions were held and a higher 57.5 per cent cleared.
Across the remaining auction markets, Adelaide was the only capital city to see a rise in clearance rate last week with volumes also increasing across the city.
This trend is set to continue with CoreLogic currently tracking 2,164 auctions, increasing slightly on last week’s final figures which saw 2,100 auctions held. Sydney is expected to see the most notable difference in volumes this week; increasing by 15 per cent on last week with a total of 775 homes scheduled for auction. Australia’s other largest auction market Melbourne is set to host 1,064 auctions this week, remaining somewhat consistent on the 1,033 auctions held last week at final results. In any case there are doubts about the auction stats, as we discussed in “Auction Results Under the Microscope”.
Across the smaller auction markets, Tasmania is the only other auction market to see a rise in week-on-week volumes, with Adelaide and Perth down more than 30 per cent on last week, while Brisbane and Canberra’s volumes are down to a lesser degree.
When compared to activity last year, both volumes and clearance rates were tracking considerably higher, with 2,885 auctions held on this same week one year ago when the success rate of auctions were tracking consistently above the 70 per cent mark throughout the first half of 2017; a much different trend to what we are currently seeing.
All the indicators are for more falls.
As the property market rotates, and demand slackens, property developers with a stock of newly built, or under construction dwellings – mostly high-rise apartments are trying tactics from deep discounting, cash bribes, or 100% mortgages to persuade people to buy. Remember there are around 200,000 units coming on stream over the next year or two and demand is falling. So we were interested to see (thanks to a tip off from our community) a WA initiative which was recently announced by Apartments WA – “Backed by the foundations of the BGC Group – Western Australia’s largest residential home builder and largest private company, we make your buying journey a seamless process from finding you the right apartment, assisting with obtaining finance, right through to settlement and key handover”.
I have been following the latest rounds of hearings at the Royal Commission into Misconduct in the Banking, Superannuation and Financial Services Industry, which is exploring lending for small businesses.
It’s been quite dramatic, with stories of business owners with impossible dreams, walking into commercial ventures which had a limited chance of success. The banks on the stand appear to have made procedural mistakes, and when things go wrong often went for the jugular to cover their losses. This included relying on guarantees even if it meant selling the guarantors property, and the case studies included sad stories of people losing their homes. This included a disabled pensioner, blind and riddled with medical problems; her daughter, a budding small business operator. Or an ambitious woman trying her hand at running a pie shop with the hope of retiring early.
But the way the story is presented is only half the story. Yes, the banks failed in their duties on occasions, but on the other hand many businesses need finance if they are to start, and banks want to lend. What is really going wrong?
My theory is there small businesses are not get access to the advice they need to make a balanced assessment as to the viability of their operation. By default, they assume if the bank provides funding then the business must be viable – but this is not necessarily so. The bank is only concerned with protecting their loan, and ensuring they can cover the risk of loss – this is not the same as considering the business in the round. We discussed this analysis in more detail in our recent release “The Problem With Small Business Lending”. And remember about 53 per cent of the nation’s 2.2 million small to medium businesses need finance to continue trading.
The Australian Financial Review reported on our recent research on the Bank of Mum and Dad funding business start-ups. More than 33,000 business owners are estimated to have seed finance – or ongoing financial support – from loans that are secured with their parents’ home, analysis of home ownership and borrowing numbers reveals. The average cash injection is about $56,000 but loans typically range from few hundred dollars to more than $1 million, the analysis reveals. But while the number of parents providing direct cash support to their siblings’ business is increasing there has been a big fall in the number willing to put their houses on the line. That’s because of increased understanding that a lender could foreclose if there a default, which means parents’ best intentions risk the threat of homelessness by prodigal sons or daughters, according to financial advisers. said the number of parents guaranteeing a loan with their homes has fallen by about 8 per cent in the past year. This is because of the greater focus on financial advice and a better understanding of the risks involved with a guarantee, plus thanks to the strong rises in property there is more equity in a property.
Next, we look at the latest from the US where the adjustments to the Dodd-Frank Act (DFA) – sound familiar?) are expected to be signed into law next week. The changes ease the capital and regulatory requirements for smaller institutions and custody banks by raising the systemic threshold to $250 billion from $50 billion for enhanced prudential standards (EPS), reduce stress testing requirements and modify applicability of proprietary trading rules (the Volcker Rule). The legislation reduces regulations for U.S. small to mid-size banks in particular, while only providing de-minimis regulatory relief to the largest U.S. banks. The change to the systemic threshold reduces the number of banks subject to heightened regulatory oversight to 12 from 38. Regulators will still have discretion to apply EPS to banks with $100 billion-$250 billion in assets. Banks above $250 billion in assets would not see much benefit from the legislation.
Fitch Ratings says stress testing has provided discipline for banks and is an important risk governance practice that is considered in its rating analysis. The elimination or meaningful reduction of stress testing would likely have negative ratings implications. And this at a time when debt is very high.
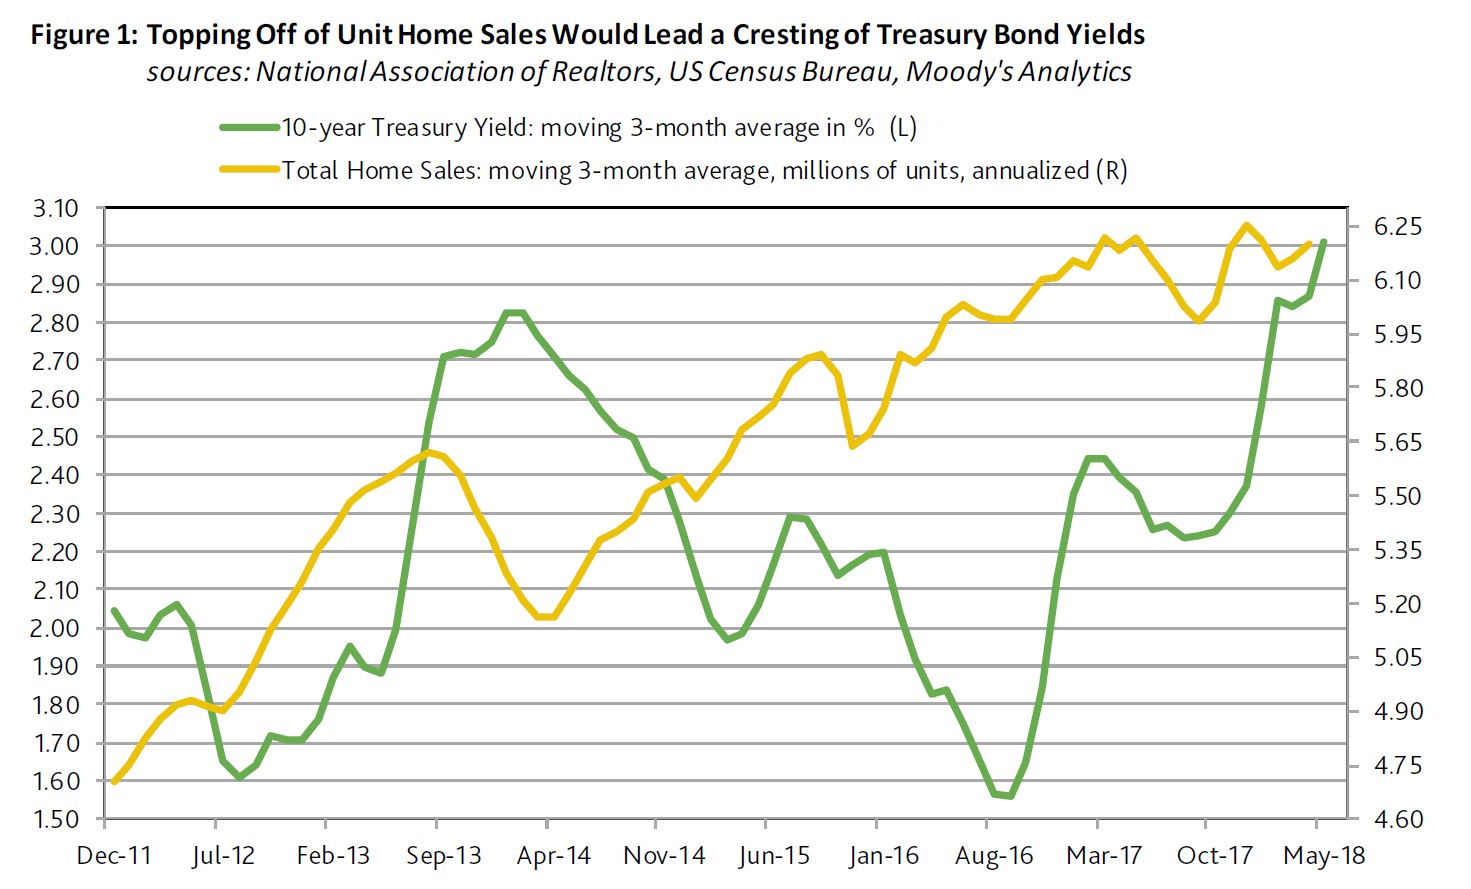
Moody’s says the return of a 3% 10-year Treasury yield is making itself known in the housing industry. Markets have already priced in a loss of housing activity to the highest mortgage yields since 2011. They conclude that just as it is overly presumptuous to predict the nearness of a 4% 10-year Treasury yield, it is premature to declare an impending top for the benchmark Treasury yield. Thus far in 2018, the 11% drop by the PHLX index of housing-sector share prices differs drastically from the accompanying 3% rise by the market value of U.S. common stock. In addition, the CDS spreads of housing-related issuers show a median increase of 78 bp for 2018-to-date, which is greater than the overall market’s increase of roughly 23 bp. Finally, 2018-to-date’s -1.97% return from high-yield bonds is worse than the -0.13% return from the U.S.’ overall high-yield bond market. Despite the lowest unemployment rate since 2000, the sum of new and existing home sales dipped by 0.7% year-over-year during January-April 2018. All this shows the impact on the housing sector as rates rise.
The highest effective 30-year mortgage yield in seven years has depressed applications for mortgage refinancings. For the week-ended May 18, the MBA’s effective 30-year mortgage yield reached 5.01% for its highest reading since the 5.04% of April 15, 2011. The effective 30-year mortgage yield’s latest fourweek average of 4.95% was up by 63 bp from the 4.32% of a year earlier. March 2018’s 7% yearly drop by the NAR’s index of home affordability showed that the growth of after tax income was not rapid enough to overcome the combination of higher home prices and costlier mortgage yields. March incurred the 17th consecutive yearly decline by the home affordability index. The moving three-month average of home affordability now trails its current cycle high of the span-ended January 2013 by 23%.
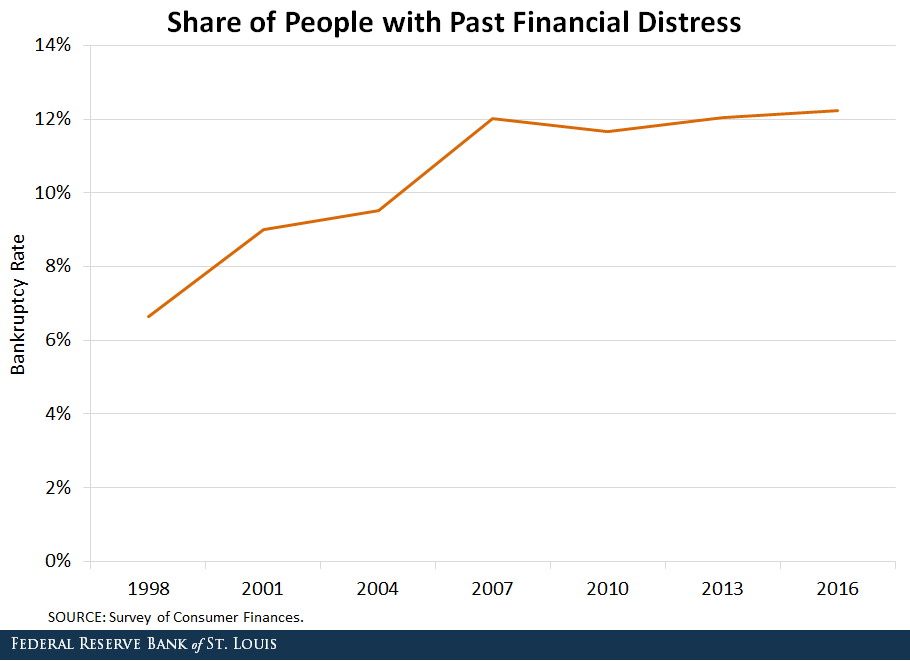
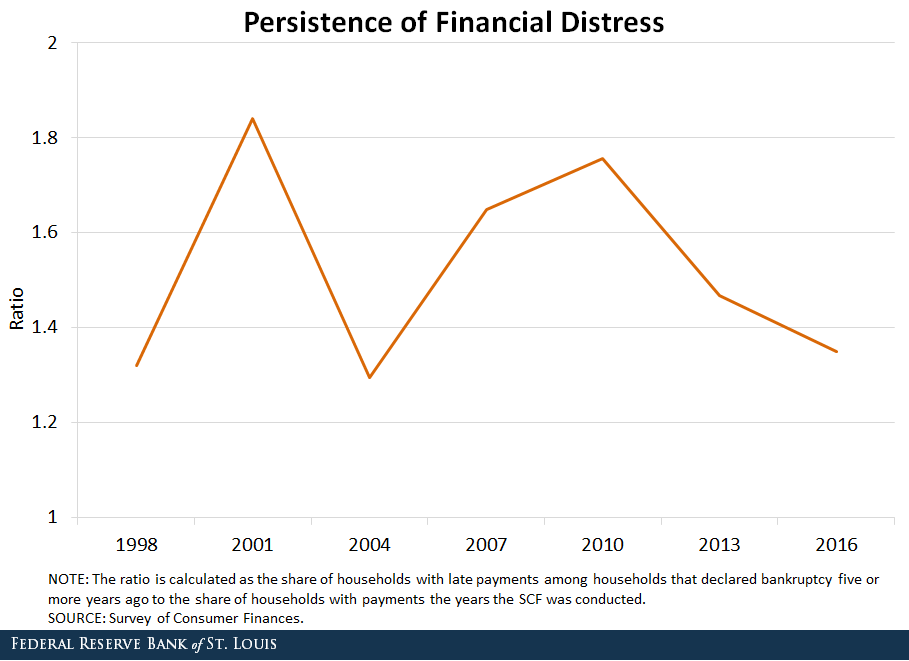
And according to the latest from The St.Louis Fed On The Economy Blog, individuals who were in financial distress five years ago were about twice as likely to be in financial distress today when compared with an average individual. They argued that financial distress is not only quite widespread but is also very persistent. They show that the share of households with past financial distress increased from approximately 6.6 percent in 1998 to 12.2 percent in 2016. They conclude that households that have encountered an episode of financial distress in the past are 1.5 times more likely to delay payment today, compared to average households.
Why is this US data relevant to us? Well first, the debt levels in the US are significantly lower than here as home prices relative to income are lower there. We have more households in financial difficulty as a result. Second, the higher rates are likely to impact local funding costs here, which will put pressure on local banks funding costs, and third, higher rates will further tighten credit availability, and as in the US, this is likely to impact the construction sector – so expect to see more unnatural acts to try to attract buyers into a falling market – to which I reply, caveat emptor – let the buyer beware!
Finally, the latest data from S&P Global Ratings using their Mortgage Performance Index (SPIN) to March 2018 shows a rise in arrears – they increased to 1.18% in March from 1.16% in February and there was a significant hike in 90+ defaults. WA and NT continue their upward trends, both above 2% and rising. Home loan delinquencies fell in New South Wales, Queensland, South Australia, and the Australian Capital Territory in March. Of note, mortgage arrears in South Australia appear to have turned a corner; the state’s March 2018 arrears of 1.35% are well down from a peak of 1.81% in January 2017. This reflects a general improvement in economic conditions in South Australia, in line with national trends. Western Australia remained the state with the nation’s highest arrears, sitting at 2.37% in March.
But S&P says say arrears more than 90 days past due made up around 60% of total arrears in March 2018, up from 34% a decade earlier. This shift partly reflects a change in the reporting of arrears for loans in hardship that came in response to regulatory guidelines. Even accounting for this, however, there has been a persistent rise in this arrears category, though the level of arrears overall remains low. And I recall Wayne Byers recent comment to the effect that at these low interest rates, defaults should be lower!
The pressure on households is set to continue. The crunch is getting nearer.
Congressional passage of financial reform legislation easing the Dodd-Frank Act (DFA) for smaller and custodial banks is not likely to be a near-term ratings issue but could be negative for some banks’ credit profiles over the long term, if it results in significantly reduced capital levels, Fitch Ratings says.
The congressional legislation, which is widely expected to be signed into law by the president as early as this week, eases the capital and regulatory requirements for smaller institutions and custody banks. Fitch views robust regulation and capital as supportive of bank creditworthiness.
Key attributes of the legislation raise the systemic threshold to $250 billion from $50 billion for enhanced prudential standards (EPS), reduce stress testing requirements and modify applicability of proprietary trading rules (the Volcker Rule). The legislation reduces regulations for U.S. small to mid-size banks in particular, while only providing de-minimis regulatory relief to the largest U.S. banks. The change to the systemic threshold reduces the number of banks subject to heightened regulatory oversight to 12 from 38. Regulators will still have discretion to apply EPS to banks with $100 billion-$250 billion in assets. Banks above $250 billion in assets would not see much benefit from the legislation.
The biggest potential change to regulatory and capital requirements is for banks under $100 billion in assets, exempting them from DFA stress test requirements. From Fitch’s perspective, stress testing has provided discipline for banks and is an important risk governance practice that is considered in its rating analysis. The elimination or meaningful reduction of stress testing would likely have negative ratings implications.
Technically, the Fed’s CCAR process is not considered EPS and therefore the lower $50 billion proposed threshold isn’t applicable to CCAR, which applies to banks over $50 billion in assets. However, exempting banks with under $100 billion in assets from stress testing requirements makes it likely the Fed would align its CCAR testing requirements with Congress’ new thresholds. Banks with over $250 billion in assets would still be required to run CCAR; however, banks between $100 billion and $250 billion in assets would be subject to periodic rather than annual stress testing requirements.
Trust and custody banks would benefit from the potential carve out of central bank deposits to their supplementary leverage ratios, allowing for increased leverage. However, the joint banking regulators’ notice of proposed rulemaking (NPR) on the enhanced supplementary leverage ratio (eSLR) noted the proposed recalibration of the eSLR was contingent on the capital rules’ current definitions of tier 1 capital and total leverage exposure, which is being significantly altered by this legislation. The NPR specifically stated: “Significant changes to either of these components would likely necessitate reconsideration of the proposed recalibration as the proposal is not intended to materially change the aggregate amount of capital in the banking system.” The regulators’ response to this definition change only for the custody banks remains unclear. Ultimately, how much custody banks increase their leverage will also dictate ratings implications.
Banks with less than $10 billion in assets would be exempt from Volcker Rule restrictions on speculative trading, and banks originating less than 500 mortgages annually would be exempt from some of the record-keeping requirements of the Home Mortgage Disclosure Act. The Volcker Rule exemption would not aid large banks that must still demonstrate compliance with the rule. The legislation would also require U.S. regulators to consider certain investment-grade municipal securities as high-quality liquid assets for liquidity coverage calculations.
As the property market rotates, and demand slackens, property developers with a stock of newly built, or under construction dwellings – mostly high-rise apartments are trying tactics from deep discounting, cash bribes, or 100% mortgages to persuade people to buy. Remember there are around 200,000 units coming on stream over the next year or two and demand is falling.
Building approvals are also slowing. There is an air of desperation.
So we were interested to see (thanks to a tip off from our community) a WA initiative which was recently announced by Apartments WA – “Backed by the foundations of the BGC Group – Western Australia’s largest residential home builder and largest private company, we make your buying journey a seamless process from finding you the right apartment, assisting with obtaining finance, right through to settlement and key handover”.
Finance is provided by Perth based Harrisdale Pty Ltd trading as The Loan Company. They hold a financial service licence.
There are few details on the Preposit site, and we have no idea of the financial arrangements below the surface. So we suspect any prospective buyer should ask some hard questions about the overall risks and real effective costs. Remember that they are not an Authorised Depository Institution, so any money “saved” with them for a deposit could be at risk.
I put in a call to the company, who said they would call back to discuss “Preposit”, but they never did!
The Apartments WA exclusive product allows you to move into an apartment immediately, then begin to make weekly payments that are stored away for you until you’ve saved your deposit.
Apartments WA Sales Manager Chad Toquero said Preposit addresses one of the biggest stumbling blocks in home ownership – the deposit.
“Preposit appeals to all buyers who can afford the loan repayments but are finding it difficult to save for a deposit – there is nothing else like this in the market and Preposit appeals to those looking to buy and those who are currently renting but want to own their own home in the future.”
Apartments WA have also partnered with Loan Co to offer their clients access to a wide range of lenders. As each person’s financial circumstance, and thus borrowing capacity is different, Loan Co will work with each individual to pre-qualify them for a loan upfront. Preposit just allows the buyer to live in the property, while saving for their deposit.
This new way of purchasing is flexible, negotiable and customised to suit the needs of every individual.
Mr Toquero believes Preposit has the potential to make home-ownership become a reality for more people.
“We want Preposit to make home ownership easier for those who want to take advantage of the property market now and their only hurdle is saving for a deposit,” he said.
“The only catch is you have to be able to afford your mortgage repayments and pre-qualify for a loan.
“As long as you can afford the repayments but don’t quite have the deposit right now, we can get you into one of our apartments.”
Here is their FAQ.
What is Preposit ?
Preposit is a unique initiative created by Apartments WA to help people save for their deposit, whilst being able to live in the apartment at the same time.
So how does it work?
We help you find your dream apartment and then introduce you to our finance experts to work out how much you can afford to borrow. The difference between the purchase price and what you can borrow is the deposit you’ll need to save. Once you receive finance pre-approval to purchase the apartment, we give you the keys to move in and you start saving for your deposit in weekly payments. We then store away these payments away until your deposit amount is achieved, which we give back to you as your deposit toward purchasing the apartment.
Is there a minimum amount required to qualify for Preposit?
No. Everyone’s individual situation is different, and we’ll work through finding the best solution for you.
What properties is Preposit applied to?
We have a range of apartments in selected areas across Perth currently available.
Is this a Government Scheme or Shared Equity?
No. Apartments WA understands that saving for a deposit is one of the biggest hurdles when looking to buy a property. And we want to help.
Sounds too good. What’s the catch?
There’s no catch. You agree to purchase the property upfront, and then get to move in whilst you save for your deposit. Once you’ve reach your deposit amount, you settle on the apartment and then its yours.
How do i know if i eligible?
Complete our enquiry form and we’ll give you a call.
The return of a 3% 10-year Treasury yield is making itself known in the housing industry. Markets have already priced in a loss of housing activity to the highest mortgage yields since 2011, according to Moody’s. They conclude that just as it is overly presumptuous to predict the nearness of a 4% 10-year Treasury yield, it is premature to declare an impending top for the benchmark Treasury yield.
Thus far in 2018, the 11% drop by the PHLX index of housing-sector share prices differs drastically from the accompanying 3% rise by the market value of U.S. common stock. In addition, the CDS spreads of housing-related issuers show a median increase of 78 bp for 2018-to-date, which is greater than the overall market’s increase of roughly 23 bp. Finally, 2018-to-date’s -1.97% return from high-yield bonds is worse than the -0.13% return from the U.S.’ overall high-yield bond market. Despite the lowest unemployment rate since 2000, the sum of new and existing home sales dipped by 0.7% year-over-year during January-April 2018. Unit home sales may not soon accelerate by enough to strengthen the case for higher Treasury yields. First-quarter 2018’s average index of pending sales of existing homes contracted by 11.5% annualized from 2017’s final quarter on a seasonally-adjusted basis, while shrinking by 3.7% year-over-year before seasonal adjustment. The recent record suggests that the 10-year Treasury yield will ultimately follow home sales.
March 2018’s 7% yearly drop by the NAR’s index of home affordability showed that the growth of after tax income was not rapid enough to overcome the combination of higher home prices and costlier mortgage yields. March incurred the 17th consecutive yearly decline by the home affordability index. The moving three-month average of home affordability now trails its current cycle high of the span-ended January 2013 by 23%.
Fewest Applications for Mortgage Refinancings since 2000
The highest effective 30-year mortgage yield in seven years has depressed applications for mortgage refinancings. For the week-ended May 18, the MBA’s effective 30-year mortgage yield reached 5.01% for its highest reading since the 5.04% of April 15, 2011. The effective 30-year mortgage yield’s latest fourweek average of 4.95% was up by 63 bp from the 4.32% of a year earlier.
The yearly increase by the effective 30-year mortgage yield’s moving four-week average last swelled by at least 63 bp during the span-ended July 12, 2013. The 10-year Treasury yield’s month-long average would climb from July 2013’s 2.56% to a December 2013 peak of 2.89%. Thereafter, a decline by unit home sales had helped to lower the 10-year Treasury yield to 2.53% by July 2014.
As of May 18, 2018, the Mortgage Bankers Association’s seasonally-adjusted weekly index of applications for mortgage refinancings sank to its lowest reading since December 29, 2000. Nevertheless, it should be noted that the MBA commenced a new sample on September 16, 2011. During the four-weeks-ended May 18, applications for mortgage refinancings sank by 19.6% year-overyear.
Moreover, the latest moving 13-week average of applications for mortgage refinancings is a very deep 77.8% under its current cycle high of October 12, 2012. By contrast, mortgage applications from prospective homebuyers are holding up much better. During the four weeks ended May 18, the MBA’s average index for homebuyer mortgage applications dipped by 0.9% from the contiguous four-weeks-ended April 20, 2018, as the year-over-year increase slowed from April 20’s 6.6% to May 18’s 3.5%.
The sum of new and existing sales of single-family homes sank annually in only nine of the calendar years since 1988. In eight of those nine years, the 10-year Treasury yield’s yearlong average fell in the following calendar year. For the nine years following a drop by single-family home sales, the median annual change for the 10-year Treasury yield’s yearlong average was -41 bp.
In summary, the longer that higher interest rates weigh on business activity and financial markets, the closer is a peak for bond yields. Nonetheless, just as it is overly presumptuous to predict the nearness of a 4% 10-year Treasury yield, it is premature to declare an impending top for the benchmark Treasury yield.
According to the latest from The St.Louis Fed On The Economy Blog, individuals who were in financial distress five years ago were about twice as likely to be in financial distress today when compared with an average individual.
Many households have experienced financial distress at least one time in their life. In these situations, households miss payments for different reasons (unemployment, sickness, etc.) and eventually file bankruptcy to discharge those obligations.
In a recent working paper, I (Juan) and my co-authors Kartik Athreya and José Mustre-del-Río argued that financial distress is not only quite widespread but is also very persistent. Using Federal Reserve Bank of New York Consumer Credit Panel/Equifax data, we reported that individuals who were in financial distress five years ago were about twice as likely to be in financial distress today when compared with an average individual.1
Consumer Bankruptcy
In this post, we focus our attention on a very extreme form of financial distress: consumer bankruptcy. We obtained financial distress data from the Survey of Consumer Finances (SCF), conducted by the Board of Governors. The data span from 1998 to 2016 with triennial frequency, and the respondents who are younger than 25 or older than 65 have been trimmed.2
We first measured the share of households that had previously experienced an episode of financial distress by looking at people who filed for bankruptcy five or more years ago.3 The figure below shows that the share of households with past financial distress increased from approximately 6.6 percent in 1998 to 12.2 percent in 2016.
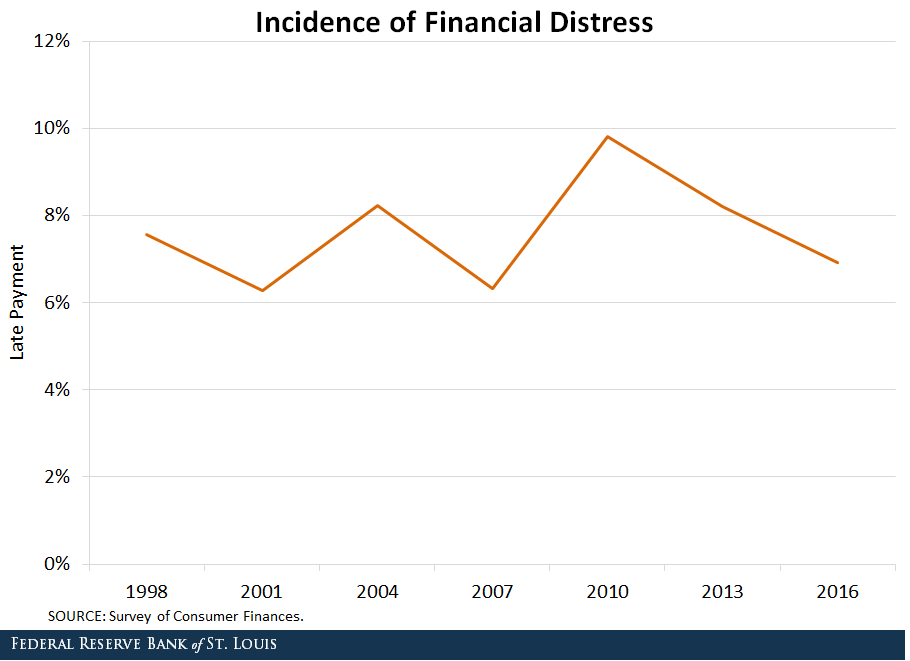
We then measured current financial distress by computing the share of households that delayed their loan payment on the year the survey was conducted.4 (We recognize that this measure is less extreme, as only a share of households that are late making payments will end up in bankruptcy.)5
The figure below shows that while there are minor fluctuations in the share of households with late payments throughout the sample period, the numbers remained around 8 percent.
Finally, we created a ratio to measure the persistence of financial distress. It compares the share of households with late payments among households that declared bankruptcy five or more years ago to the share of households with late payments the year the SCF was conducted.
If financial distress was not persistent at all, both shares would be equal, and the ratio would be one. Thus, a value greater than one indicates the persistence of financial distress. The figure below shows the evolution of the persistence of financial distress over the years.
The ratio fluctuates around 1.5, implying that the households that have encountered an episode of financial distress in the past are 1.5 times more likely to delay payment today, compared to average households.
Australians are urged to be on guard against unscrupulous, unsolicited callers, claiming to represent the Australian Banking Association and asking for bank details to issue a ‘refund’, survey customer satisfaction or record banking history.
According to the ACCC every year 33,000 Australians are targeted by scammers in this particular way, with callers pretending to represent banks and other financial institutions, with recent estimates placing the cost to victims at over $4.7 million. This scam targeting the ABA is ongoing and was first reported in 2016. Banks often encounter this type of scam, with callers claiming to contact customers on their behalf.
Some of the techniques used by these scammers include:
Asking who you bank with, how long you have banked with them and your level of satisfaction
Asking for personal and banking details, including your name and driver’s licence number, bank account or credit card number, PINs or internet banking login
Telling people they are owed a ‘refund’ for overcharged bank fees but they have to pay a fee for it. They ask people to send money via post or Western Union.
Executive Director of Consumer Policy Christine Cupitt said that it was important customers remain vigilant against scammers even if they claim to be from reputable organisations such as banks or associations.
“We’ve seen a concerning rise in the number of people falsely claiming to be from the ABA, preying on unsuspecting victims and asking for them personal financial details,” Ms Cupitt said.
“The ABA, or any member bank, will never call members of the public seeking information about their personal bank accounts or security information.
“If you think you’ve given your personal information to a scammer we urge you to urgently contact your financial institution.
“It’s vitally important that Australians keep their financial identity safe by following important measures such as not giving out your PIN, deleting spam e-mails, keeping antivirus software up to date and not responding to requests from unknown phone numbers.
“This week is ‘National Scams Awareness Week’, a timely reminder that if you think you’ve been the target of scammers, or indeed the victim of one, you should report it immediately to ACCC’s www.scamwatch.gov.au,” she said.
Tips to protect your financial identity
Don’t provide your financial details, including PIN or internet banking login or password to anyone.
Guard the following identity information carefully and only provide to trusted people and entities: date of birth, current address, driver’s licence number and passport details.
Delete spam and scam e-mail – if the offer sounds too good to be true, it probably is.
Keep your anti-virus and firewall software up-to-date.
Do not respond to requests that ask you to call unknown or unverified phone numbers.
Be very careful about clicking on links in emails. Do not use links to access trusted websites. Enter the correct address for websites into the address bar of your browser.
The Federal Court has determined ASIC failed to prove Westpac manipulated the bank bill swap rate, but the judge found the bank engaged in unconscionable conduct, via InvestorDaily.
Justice Beach of the Federal Court has handed down a 643-page judgement on a civil court case brought by ASIC that alleged Westpac manipulated the bank bill swap rate (BBSW).
In his judgement, Justice Beach found ASIC has “not made out its case against Westpac” concerning market manipulation or market rigging.
However, he did find that Westpac engaged in unconscionable conduct under s12CC of the ASIC Act on four occasions (6 April 2010, 20 May 2010, 1 and 6 December 2010) “by trading Prime Bank Bills in the Bank Bill Market with the dominant purpose of influencing yields and where BBSW is set”.
Westpac was also found to have contravened paragraphs 912A(1)(a), (c), (ca) and (f) of the Corporations Act, which relate to the obligations of financial services licensees to operate efficiently, honestly and fairly.
ASIC did not make out its case in respect to any of its other claims, said the judgement.
In his summary, Justice Beach said Westpac had failed to take “reasonable steps” to ensure its representatives did not engage in trading in Prime Bank Bills with the “sole or dominant purpose of manipulating the BBSW”.
“Further, in my view Westpac failed to ensure that its traders were adequately trained not to engage in trading with such a sole or dominant purpose,” said the judgement.
“This should have been reinforced and stipulated to them orally and in writing. In those circumstances, Westpac also contravened s 912A(1)(f).”
The government is reportedly considering a new tax on the digital economy. While no details of the tax are available yet, the digital services tax recently proposed by the European Commission may give us an idea what the tax might look like.
In essence, the proposal will impose a 3% tax on the turnover of large digital economy companies in the European Union. Similar ideas have been suggested in the UK and France.
The current international tax system was designed before internet was invented, so this new tax is a response to this problem. Under the current system, a foreign company will not be subject to income tax in Australia unless it has a significant physical presence in the country. The key word here is “physical”.
It is well known that modern multinationals such as Google can derive substantial revenue and profits from Australia without significant physical presence here. It is no surprise that this 20th-century tax principle struggles to deal with the 21st-century economy.
This problem is well known but the solution is far more elusive.
Attempts to tax digital companies
The best solution in response to the rise of the digital economy is to reword the laws to take more into account than the “physical” presence of a company in the international tax regime. However, this reform would require international consensus on a new set of rules to allocate the taxing rights on the profits of multinationals among different countries.
In particular, it would mean more taxing rights for source countries where the revenue is generated. The formidable political resistance is not difficult to imagine.
The OECD has attempted to address this fundamental issue, but in vain so far. Its report on the taxation of digital economy in the Base Erosion Profit Shifting project did not provide any recommendation to improve the system at all. The recent report on its continuing work on the digital economy again shows little progress.
While the EU also recognises that the long-term solution should be a major reform of the international tax regime, the slow progress of the OECD’s effort is seriously testing the patience of many countries. Therefore, the EU has proposed the digital services tax as an “interim” measure.
Google as an example
The Senate enquiry into corporate tax avoidance revealed that Google is deriving billions of dollars of revenue every year from Australia but has been paying very little tax. In particular, the revenue reported to the Australian Securities and Investments Commission in Australia in 2015 was less than A$500 million, with net profits of A$47 million.
The government responded by introducing the Multinational Anti-Avoidance Law in 2016, targeting the particular tax structures used by multinational enterprises such as Google.
Google Australia’s 2016 annual report states that the company has restructured its business. Though not stated explicitly, the restructure was most likely undertaken in response to the introduction of this law.
As a result of the restructure, both revenue and net profits of Google Australia increased by 2.2 times.
However, here is the bad news. Though Google has reported significantly more profits in Australia, the profit margins of the local company remain very low compared to its worldwide group. For example, the net profit margin of Google Australia was 9% while that of the group was 22%.
Of course, a business may have different profit margins in different countries for genuine commercial reasons. However, based on our understanding of the tax structures of these multinationals, it’s likely that significant amounts of profits are booked in low-tax or even zero-tax jurisdictions.
This example suggests that while the Multinational Anti-Avoidance Law is achieving its objectives, it alone is unlikely to be enough.
A digital services tax in Australia
The digital services tax is a turnover tax, not an income tax. This circumvents the restrictions imposed by the current international income tax regime.
The targets of this tax include income of large multinationals from providing advertising space (for example, Google), trading platforms (for example, eBay) and the transmission of data collected about users (for example, Facebook).
If Australia follows the model of the digital services tax, the new tax may generate substantial amount of revenue. For example, Google Australia’s revenue reported in its 2016 annual report was A$1.1 billion. A 3% tax on that amount would be A$33 million.
Along with the digital services tax proposal, the EU proposed the concept of “significant digital presence” as the long-term solution for the international tax system. The exact details are subject to further consultation. However, the relevant factors may include a company’s annual revenue from digital services, the number of users of such services, and the number of online contracts concluded on the platform.
The destiny of this proposal is unclear, but it’s likely to be subject to fierce debate among countries. In any case, the proposals of the digital services tax and the digital presence concept suggest there may be a paradigm shift in the thinking of tax policymakers in response to the challenges imposed by the digital economy that would be difficult, if not impossible, to resist.
Author: Antony Ting, Associate Professor, University of Sydney
ASIC says an ASIC surveillance found that Cash Converters Personal Finance Pty Ltd (‘Cash Converters’) had systematically failed to meet regulatory guidelines on debt collection practices, including by too frequently contacting consumers.
ASIC found that as a result of poor internal controls and policies Cash Converters routinely breached Regulatory Guide Debt collection guideline: for collectors and creditors (RG 96), which recommends that consumers be contacted regarding a debt not more than three times per week or 10 times per month. These guidelines are based on legislative prohibitions on harassment and coercion.
Cash Converters also provided incorrect information to consumer credit reporting agency Equifax. This may have resulted in up to 38,500 customers being reported with inaccurate amounts owing over a one-month period.
In response to ASIC’s concerns, Cash Converters is outsourcing all debt collection work to a specialist third party debt collector. ASIC has also imposed licence conditions on Cash Converters to require it to obtain ASIC’s consent before returning debt collection activity in-house. Cash Converters has also worked with Equifax to ensure all incorrect credit listings have been removed.
The company has paid a $650,000 community benefit payment to help fund the National Debt Helpline. The Helpline assists consumers who have trouble managing debt or paying bills.
ASIC Deputy Chair Peter Kell said, ‘Consumers expect to be treated fairly and in a manner that complies with consumer protection laws. ASIC expects all financial service providers to have appropriate systems and controls in place to ensure that debt collection practices are consistent with the Guidelines. It is also critical that licensees ensure that credit information provided to credit bureaus is accurate.’
Consumers seeking assistance can contact the National Debt Helpline on 1800 007 007.
Background
Safrock Financial Corporation (Qld) Pty Ltd, a related company to Cash Convertors, was responsible for providing the incorrect information to consumer credit reporting agency Equifax. The credit listings indicated the total amount of the debt owing by consumers, rather than the outstanding balance.
ASIC has issued Regulatory Guide RG 96Debt collection guideline: for collectors and creditors setting out guidance to help creditors who are directly involved in debt collection and specialist external agencies who provide debt collection services to comply with their legal obligations under Commonwealth consumer protection laws.
The National Debt Helpline, coordinated by Financial Counselling Australia, is a not-for-profit service that assists consumers in managing debt. Approximately half of the calls received by the Helpline involve debt collected by a debt collection agency. The volume of calls for the Helpline has increased each year since the inception of the Helpline in 2012. The Helpline currently receives, on average, over 14,000 calls per month.
ASIC’s MoneySmart website has information about dealing with debt collectors, including how and when they can contact consumers. MoneySmart also provides guidance for consumers about checking and correcting any wrong listings on their credit report.

 In Sydney 665 properties were listed and 291 were sold. 79 were withdrawn. Last week Sydney ended up with a 48.7% clearance result, so it will be interesting to see if there is any final recover today, as more results come in.
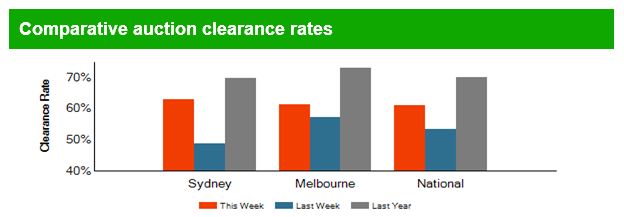 Brisbane listed 82 and sold 22, with 3 withdrawn, Adelaide listed 57 and sold 25, with 6 withdrawn and Canberra listed 62 and sold 36 with 3 withdrawn.
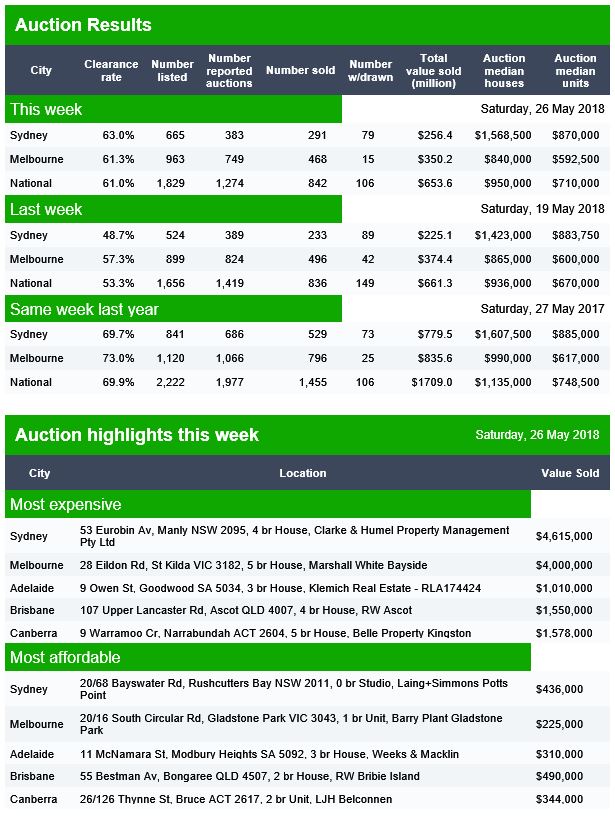 For more on how the results are collated, and how believable they are see, see our video “Auction Results Under The Microscope”.