The Limits of Interest-Only Lending – RBA

Christopher Kent, Assistant Governor (Financial Markets) spoke at the Housing Industry Association Breakfast.

Mortgages on interest-only terms have become an increasingly prominent part of Australian housing finance over the past decade. At their recent peak, they accounted for almost 40 per cent of all mortgages. While interest-only loans have a role to play in Australian mortgage finance, their value has limits.

Other things equal, interest-only loans can carry greater risks compared with principal-and-interest (P&I) loans. Because there’s no need to pay down principal initially, the required payments are lower during the interest-only period. But when that ends, there is a significant step-up in required payments (unless the interest-only loans are rolled over). This owes to the need to repay the principal over a shorter period; that is, over the remaining term of the loan. Also, because the debt level is higher over the term of the loan, the interest costs are also larger.

For housing investors, the key motivation for using an interest-only loan is clear. By enabling borrowers to sustain debt at a higher level over the term of the loan, interest-only loans maximise interest expenses, which are tax deductible for investors. They also free up funds for other investments.

For those purchasing a home to live in, there are other motivations for an interest-only loan. They provide a degree of flexibility when it comes to repayment. They can assist households to manage a temporary period of reduced income or heightened expenditure. That might occur, for example, when a household wants to work less in order to raise children, cover the cost of significant renovations or obtain bridging finance to buy and sell properties. They can also appeal to households without a steady flow of regular income, such as the self-employed. So there are understandable reasons why borrowers have taken out interest-only loans.

During interest-only periods, disciplined borrowers will be able to provision for future repayment of principal. They can accumulate funds in an offset or redraw account, or build up other assets. With sufficient saving over the interest-only period, the health of their balance sheet need be no different than it would have been with a P&I loan.

If, however, a borrower spends the extra cash flow available to them during the interest-only period (compared with the alternative of a P&I loan), they will need to make sizeable adjustments when that ends. They will have to either secure additional income by that time or reduce their consumption (or some combination of both). That will be more difficult and possibly come as a shock to the borrower if they haven’t planned for it in advance.

If the borrower has made no provisions and is unable to make the necessary adjustment, they may need to sell the property to repay the loan. Therein lies an additional risk inherent in interest-only lending. Moreover, the borrower’s ability to service the loan is not fully tested until the end of the interest-only period. If the borrower defaults, the potential loss for the lender will be larger than in the case of a P&I loan given that interest-only loans by design allow borrowers to maintain the debt at a higher level over the term of the loan.

That’s why, when providing interest-only loans, prudent lenders will carefully assess the borrower’s ability to make both interest and principal payments. Among other things, banks have to make their loan ‘serviceability assessments’ based on the status of the borrower’s income and expenditure at the time of origination. To help manage risks, lenders also typically limit the maximum interest-only period to five years.

The role of interest-only lending and its potential implications for financial stability have been of interest to the Reserve Bank for some time. The possible effects of the transition at the end of interest-only periods were discussed in the recent Financial Stability Review. I will come to that issue shortly, but first I want to review the regulatory responses to the strong growth of interest-only lending in recent years.

Tightening of Lending Standards

Interest-only loans had grown very strongly for a number of years in an environment of low mortgage rates and heightened competitive pressures among lenders. The share of housing credit on interest-only terms had increased steadily to almost 40 per cent by 2015 (Graph 1). The share of credit on interest-only terms has always been much higher for investors than owner-occupiers (consistent with the associated tax benefits for investors). But interest-only loans for owner-occupiers had also grown strongly.
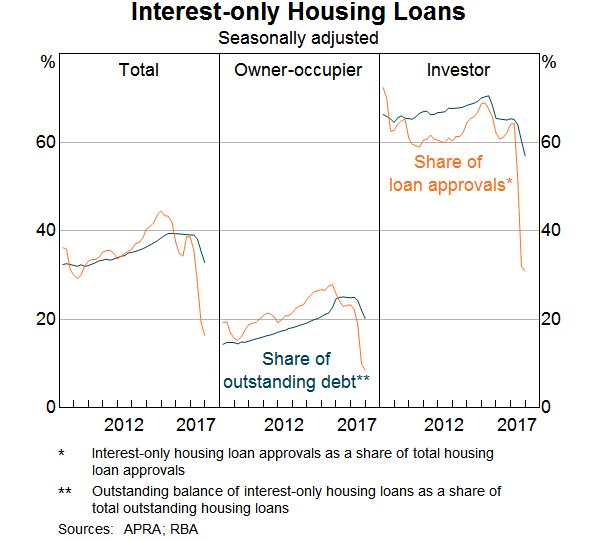
Graph 1
Graph 1: Interest-only Housing Loans


In 2014, the Australian Prudential Regulation Authority (APRA) acted to tighten standards for interest-only loans, and mortgages more generally. APRA required serviceability assessments for new loans to be more conservative by basing them on the required principal and interest payments over the term of the loan remaining after the interest-only period. (Previously, some banks were assuming that the principal was being re-payed over the entire life of the loan, which was clearly a lower bar for the borrower to meet.) At about the same time, APRA acted to ensure that the interest rate ‘buffer’ used in the serviceability assessments for all loans was at least 2 percentage points above the relevant benchmark rate (with an interest rate floor of at least 7 per cent). Also, that test was required to include other, existing debt (which is often substantial for investors). The application of such a buffer in serviceability assessments implies that borrowers should be able to accommodate a notable rise in required repayments.

When APRA tightened loan serviceability requirements, it also limited the growth of investor lending (to 10 per cent annually). The share of interest-only loans in total housing credit then stabilised for a time at around 40 per cent, having increased steadily up to that point.

In early 2017, in recognition that continued strong growth of interest-only loans was contributing to rising risks, APRA further tightened standards on interest-only lending. Among other things, banks were required to limit new interest-only lending to be no more than 30 per cent of new mortgage lending. Banks were also required to tightly manage new interest-only loans extended at high loan-to valuation ratios (LVRs).

The Past Year or So

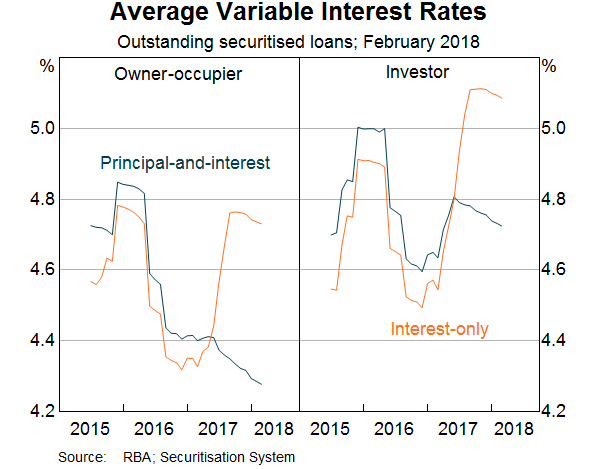
In response to those recent regulatory measures, the banks raised interest rates on investor and interest-only loans. From around the middle of 2017, the average interest rates on the stock of outstanding variable interest-only loans increased to be about 40 basis points above interest rates on equivalent P&I loans (Graph 2). Prior to that, there was little difference in interest rates on these loans.
Graph 2
Graph 2: Average Variable Interest Rates


The higher interest rates contributed to a reduction in the demand for new interest-only loans. In addition, because banks had raised interest rates on all of their (variable rate) interest-only loans, existing customers had an incentive to switch their loans from interest-only to P&I terms before their scheduled interest-only periods ended. Many took up that option.

The combination of higher interest rates and tighter lending standards contributed to the share of new loans that are interest-only falling comfortably below the 30 per cent limit. The stock of interest-only loans in total housing credit has also declined noticeably, from close to 40 per cent to almost 30 per cent.

This reduction in the stock of interest-only loans over the past year was substantial. It represented about $75 billion of loans (out of a total stock of interest-only loans of almost $600 billion in late 2016).

While many of the customers switching chose to do so in response to the higher rates on interest-only loans, there are likely to have been some borrowers who had less choice in the matter. Some borrowers may have preferred to extend their interest-only periods but may not have qualified in light of the tighter lending standards. We don’t have a good sense of the split between those borrowers that switched voluntarily and those that switched reluctantly. However, our liaison with the banks suggests that most borrowers have managed the transition reasonably well. Also, the share of non-performing housing loans over the past year remains little changed at relatively low levels. Moreover, the growth of household consumption has been sustained; indeed it picked up a touch in year ended-terms over 2017.

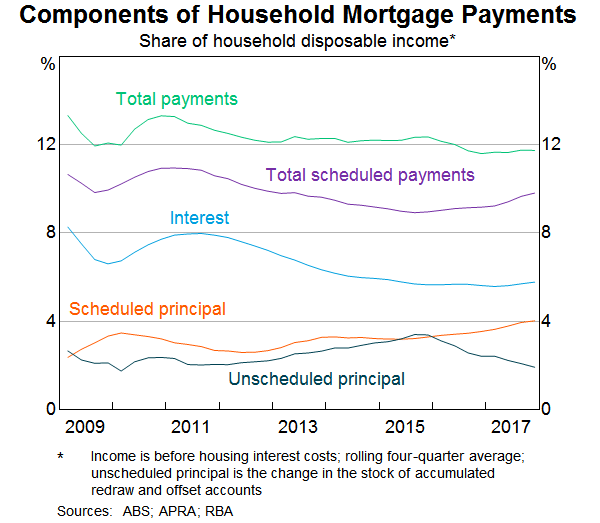
Given the large number of borrowers switching to P&I loans, it’s not surprising that scheduled housing loan repayments have increased over the past year (Graph 3). Meanwhile, unscheduled payments have declined. With total payments little changed, the rise in scheduled payments has had no obvious implications for household consumption.
Graph 3
Graph 3: Components of Household Mortgage Payments

The Next Few Years

So, many interest-only borrowers appear to have responded voluntarily to the pricing incentives and switched to P&I loans. This means that it is possible that the current pool of interest-only borrowers is a little more likely than usual to want to continue with their interest-only loans. For some of these borrowers, the decision not to switch to a lower interest rate P&I loan may reflect the higher required payments for such a loan.

Some commentators have gone so far as to suggest that when scheduled interest-only periods end, many borrowers will be forced onto P&I loans and will find it challenging to make the higher required payments. Commentators go on to suggest that such borrowers will either have to sell their property or reduce other expenditure significantly in order to service their loans.

In what follows, I’ll explore these concerns by providing some estimates of the effect of borrowers switching to P&I loans in the years ahead. I’ll focus my attention on the potential size of the change in households’ cash flows as well as the effect on the household sector’s consumption.

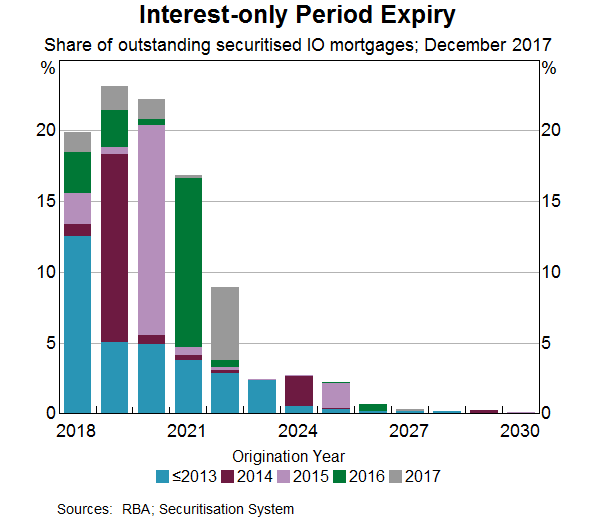
Around two-thirds of interest-only loans in the Reserve Bank’s Securitisation Dataset are due to have their interest-only periods expire by 2020 (Graph 4). That is consistent with interest-only periods typically being around five years. Only a small share of loans have interest-only periods of 10 years (or longer), with very few loans on these terms having been written (and securitised) since 2015. This is in line with the earlier measures to tighten lending standards.
Graph 4
Graph 4: Interest-only Period Expiry - share


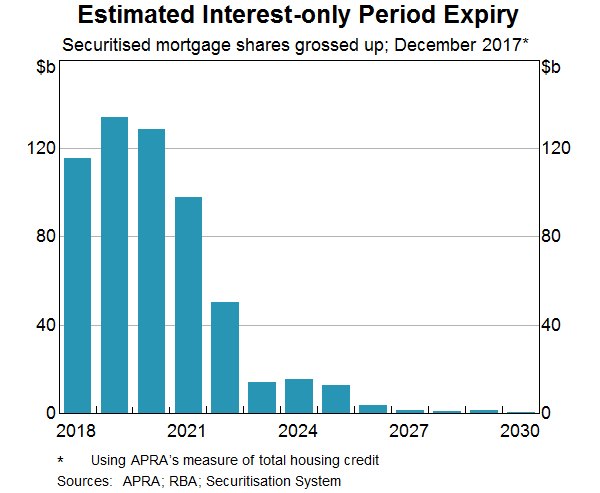
Applying this profile of expiries to the total value of all interest-only loans suggests that about $120 billion of interest-only loans is scheduled to roll over to P&I loans each year over the next three years (Graph 5). This annual figure is equivalent to around 7 per cent of the stock of housing credit outstanding.

While the value of loans scheduled to reach the end of the interest-only periods appears large, it is worth emphasising that expirations of this size are not unprecedented. At the end of 2016, a similar value of loans was due to have their interest-only periods expire in 2017. What is different now, however, is that many households have already switched willingly in 2017 in response to pricing differentials, and lending standards were tightened further in recent years. This could affect the ability of some borrowers to extend their interest-only periods or to refinance to a P&I loan with a longer amortising period so as to reduce required payments on the loan.
Graph 5
Graph 5: Estimated Interest-only Period Expiry


To estimate the effect the expiry of interest-only periods, I’ll consider the case where all of the interest-only periods expire as scheduled. While extreme, this provides a useful upper-bound estimate of the effect of the transition ahead.

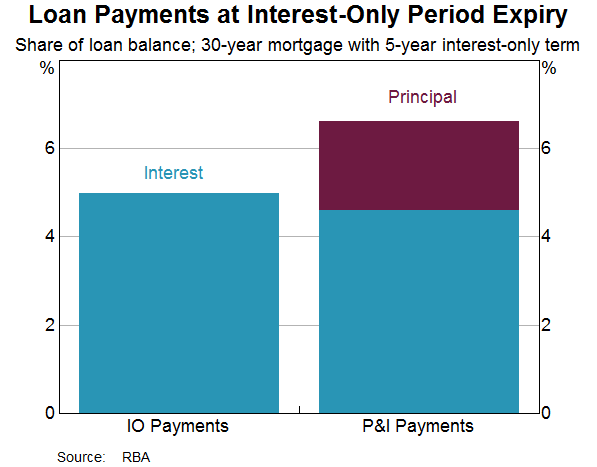
Consider a ‘representative’ interest-only borrower with a $400,000 30-year mortgage with a 5-year interest-only period. The left-hand side bar in Graph 6 shows the approximate interest payments (of 5 per cent) that such a borrower makes during the interest-only period. At the expiry of the interest-only period, required payments will increase by around 30–40 per cent (with an example shown in the bar on the right). (As shown in the graph, the interest rate applied to the loan is expected to be lower when it switches to P&I (by around 40 basis points) but this effect is more than offset by the principal repayments.)
Graph 6
Graph 6: Loan Payments at Interest-Only Period Expiry


The rise in scheduled payments amounts to about $7,000 per year for the representative interest-only borrower. This is a non-trivial sum for the household concerned.

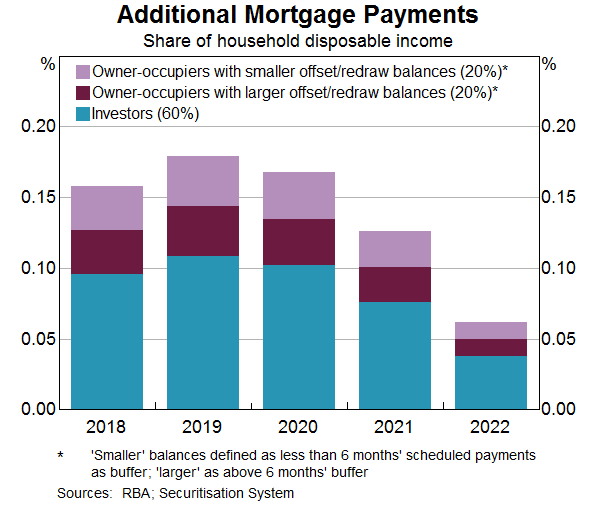
But how big is this cash flow effect when summed up across all households currently holding interest-only loans? Again, I adopt the extreme assumption that all interest-only periods expire as scheduled over the coming few years. As a share of total household sector disposable income, the cash flow effect in this scenario is estimated be less than 0.2 per cent on average per annum over each of the next three years (Graph 7).

For the household sector as a whole, this upper-bound estimate of the effect is relatively modest. Even so, there are a number of reasons why the actual cash flow effect is likely to be even less than this. More importantly, the actual effect on household consumption is likely to be lower still. So let me step through the various reasons.
Graph 7
Graph 7: Additional Mortgage Payments

Savings

Many borrowers make provisions ahead of time for the rise in required repayments. It is common for borrowers to build up savings in the form of offset accounts, redraw balances or other assets. They can draw upon these to cover the increase in scheduled payments or reduce their debt. Others may not even need to draw down on existing savings. Instead, they can simply redirect their current flow of savings to cover the additional payments. In either case, such households are well placed to accommodate the extra required payments without needing to adjust their consumption very much, if at all.

As shown in the chart above, about half of owner-occupier loans have prepayment balances of more than 6 months of scheduled payments. While that leaves half with only modest balances, some of those borrowers have relatively new loans. They wouldn’t have had time to accumulate large prepayment balances nor are they likely to be close to the scheduled end of their interest-only period.

There are borrowers who have had an interest-only loan for some time but haven’t accumulated offset or redraw balances of substance. Offset and redraw balances are typically lower for investor loans compared with owner-occupier loans. That is consistent with investors’ incentives to maximise tax deductible interest. However, in comparison to households that only hold owner-occupier debt, there is evidence that investors tend to accumulate higher savings in the form of other assets (such as paying ahead of schedule on a loan for their own home, as well as accumulating equities, bank accounts and other financial instruments).

Refinancing

Another option for borrowers is to negotiate an extension to their interest-only period with their current lender or refinance their interest-only loan with a different lender. Similarly, they may be able to refinance into a new P&I loan with a longer loan term, thereby reducing required payments. Based on loans in the Securitisation Dataset, a large majority of borrowers would be eligible to alter their loans in at least one of these ways.

Any such refinancing will reduce the demands on a borrower’s cash flows for a time. However, it is worth noting that by further delaying regular principal repayments, eventually those repayments will be larger than otherwise.

Extra income or lower expenditures

What about borrowers who have not built up savings ahead of time or are unable to refinance their loans? The Securitisation Dataset suggests that such borrowers are in the minority. More importantly, most of them appear to be in a position to service the additional required payments. Indeed, the tightening of loan serviceability standards a few years ago was no doubt helpful in that regard.

Some fraction of interest-only borrowers may have used the reduced demands on their cash flows during the interest-only period to spend more than otherwise. However, the available data, and our liaison with the banks, suggest that there are only a small minority of borrowers who will need to reduce their expenditure to service their loans when their interest-only periods expire.

Sale of the property

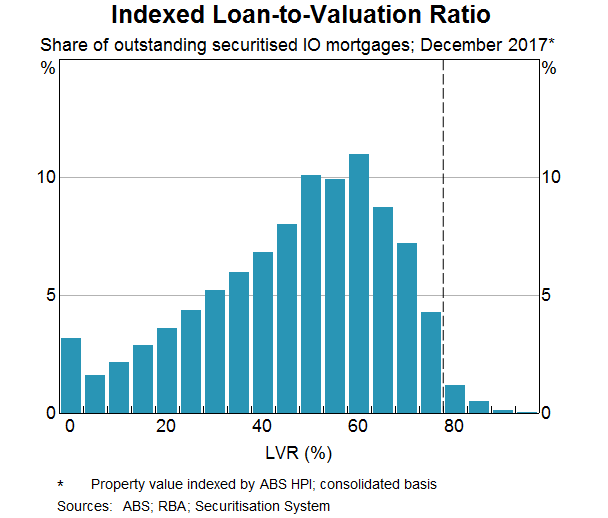
Finally, some interest-only borrowers may have to consider selling their properties to repay their loans. Difficult as that may be – most notably for owner-occupiers – doing so could free up cash flow for other purposes. It would also allow them to extract any equity they have in the property. The extent of that can be gauged by estimating LVRs from the Securitisation Dataset. The LVRs of almost all of those interest-only loans (both owner-occupier and investor) are below 80 per cent (based on current valuations and including offset balances) (Graph 8). This reflects the combined effects of loan serviceability tests and the increase in housing prices over recent years.
Graph 8
Graph 8: Indexed Loan-to-Valuation Ratio

Some risks remain

While the various estimates I’ve provided suggest that the aggregate effect of the transition ahead on household cash flows and consumption is likely to be small, some borrowers may experience genuine difficulties when their interest-only periods expire. The most vulnerable are likely to be owner-occupiers, with high LVRs, who might find it more difficult to refinance or resolve their situation by selling the property.

Currently, it appears that the share of borrowers who cannot afford the step-up in scheduled payments and are not eligible to alleviate their situation by refinancing is small. Our liaison with the banks suggests that there are a few borrowers needing assistance to manage the transition. Over the past year, some banks have reported that there has been a small deterioration in asset quality. For some borrowers this has tended to be only temporary as they take time to adjust their financial affairs to cope with the rise in scheduled payments. For a small share of borrowers, though, it reflects difficulty making these higher payments. That share could increase in the event that an adverse shock led to a deterioration in overall economic conditions.

Conclusion

Today, I have discussed some of the risks associated with interest-only loans, which imply that their value as a form of mortgage finance has limits. I have also presented rough estimates of the likely effect of the upcoming expiry of interest-only loan periods. The step-up in required payments at that time for some individual borrowers is non-trivial. For the household sector as a whole, however, the cash flow effect of the transition is likely to be moderate. The effect on household consumption is likely to be even less. This is because some interest-only borrowers will be willing and able to refinance their loans. Also, many others have built up a sufficient pool of savings, or will be able to redirect their current flow of savings to meet the payments, or have planned for, and will manage, this change in other ways.

Indeed, the substantial transition away from interest-only loans over the past year has been relatively smooth overall, and is likely to remain so. Nevertheless, it is something that we will continue to monitor closely.

Finally, the observation that the transition is proceeding smoothly is not an argument that the tightening in lending standards on interest-only loans was unwarranted; far from it. The tightening in standards starting in 2014 has helped to ensure that borrowers are generally well placed to service their loans. And the limit on new interest-only lending more recently has prompted a reduction in the use of those loans during a time of relatively robust growth of employment and still very low interest rates. In this way, it has helped to lessen the risk of a larger adjustment later on in what could be less favourable circumstances.

Shareholder class action looms for AMP

From InvestorDaily.

Global litigation firm Quinn Emanuel Urquhart & Sullivan is investigating a class action lawsuit against AMP for shareholder losses following revelations at the royal commission last week.

Giving evidence before the royal commission, AMP head of financial advice Jack Regan admitted his firm lied to ASIC on 20 separate occasions about its practice of providing ‘fees for no service’ to financial advice clients.

Quinn Emanuel has backing from global litigation funding firm Burford Capital for the potential class action.

The class action is open to shareholders who acquired shares between 24 May 2013 and 16 April 2018.

Quinn Emanuel partner Damian Scattini said: “The revelations of AMP’s misconduct are especially upsetting given the people who were hurt – the ordinary Mums and Dads who as shareholders gave AMP one of Australia’s largest shareholder registers, who have now lost their savings due to its dishonesty, and who as customers were charged for services AMP has admitted they never received, all so executives could make hefty bonuses.”

“QE has been investigating AMP’s precipitous share price fall even before the most recent revelations of misconduct, and having Burford, the world’s top litigation finance company, in place as our partner means we’re ready to move quickly on behalf of shareholders,” Mr Scattini said.

Burford managing director Craig Arnott said: “The conduct admitted at the Royal Commission is starkly at odds with AMP’s responsibilities and shareholders’ legitimate expectations, requiring redress so that AMP’s shareholders can recover the value that has been lost.

“Burford is glad to join forces with Quinn’s first-rate team so we can help deliver that result for shareholders, which we hope will be as swift as possible.”

Abbott suggests sacking bank regulators as ASIC feels the heat

From The Conversation.

Former prime minister Tony Abbott has strongly condemned the performance of financial sector regulators, suggesting they should be sacked and replaced by “less complacent” people.

With increasing attention on the apparently inadequate performance of the Australian Securities and Investments Commission (ASIC), Abbott raised the question of what the regulators had been doing as the scandals had gone on.

“We all know there are greedy people everywhere, including in the banks,” he told 2GB on Monday. “But banking is probably the most regulated sector of our economy. What were the regulators doing to allow all this to be happening?”

Abbott said his fear was “that at the end of this royal commission we will have yet another level of regulation imposed upon the banks when frankly what should happen is, I suspect, all the existing regulators should be sacked and people who are much more vigilant and much less complacent go in in their place.”

He said the analogy was, “yes, punish the criminals but if the police are turning a blind eye to the criminals, you’ve got to get rid of the police and get decent people in there”.

Meanwhile Malcolm Turnbull, speaking to reporters in Berlin, defended refusing for so long to set up a royal commission, although he said commentators were correct in saying that “politically we would have been better off setting one up earlier”.

Turnbull said that by taking the course it had the government “put consumers first”.

“The reason I didn’t proceed with a royal commission is this – I wanted to make sure that we took the steps to reform immediately and got on with the job.

“My concern was that a royal commission would go on for several years – that’s generally been the experience – and people would then say, ‘Oh you can’t reform, you can’t legislate, you’ve got to wait for the royal commissioner’s report.’

“So if we’d started a royal commission two years ago, maybe it would be finishing now and then we’d be considering the recommendations … With the benefit of hindsight and recognising you can’t live your life backwards, isn’t it better that we’ve got on with all of those reforms?”

Turnbull dismissed Bill Shorten’s call for the government to consider a compensation scheme for victims by saying this matter was already in the commission’s terms of reference.

Among the reforms it has made, the government highlights giving ASIC more power, resources and a new chair.

But Nationals backbencher senator John Williams, who has been at the forefront of calls for tougher action against wrongdoing in the financial sector, told the ABC that ASIC has got to be “quicker, they’ve got to be stronger, they’ve got to be seen as a feared regulator.

“That is not the situation at the moment,” he said.

He had sent a text message to Peter Kell, ASIC deputy chair, a couple of nights ago “and I said, mate, Australia is waiting for you to act”.

Asked how the culture within ASIC could be changed, Williams said, “I suppose you keep asking them questions at Senate estimates, keep the pressure on them, keep the message going on with the management of ASIC regularly.

“As I have said to the new boss [chair James Shipton], you’ve got to act quickly, you’ve got to be severe, you’ve got to be feared. If you’re not a feared regulator, people are going to continue to abuse the system, do the wrong thing without fear of the punishment”.

He welcomed the increased penalties announced by the government last week.

The chair of the Australian Competition and Consumer Commission (ACCC), Rod Sims, while declining to comment on ASIC, said he agreed with Williams “that you really do have to be feared. And frankly I’d like to think the ACCC is.

“I won’t comment on others but you want people to be really watching out – watch out for the ACCC, watch out that you don’t get caught because if they catch us it’s going to be really dire consequences. And I think we’ve got that mentality,” he told the ABC.

Updated at 4:30pm

In an interview on Sky late Monday, Finance Minister Mathias Cormann admitted, “With the benefit of hindsight, we should have gone earlier with this inquiry.” This was in stark contrast with his colleague, Minister for Financial Services, Kelly O’Dwyer, refusing to make the concession when she was repeatedly pressed in an interview on Sunday.

Author: Michelle Grattan, Professorial Fellow, University of Canberra

Another Steady Week For Auctions

From CoreLogic.

Auction activity remains relatively steady across the combined capital cities this week, with a total of 1,746 homes taken to market, returning a success rate of 63.1 per cent increasing from last week’s final clearance rate which saw the lowest weighted average result so far this year at 61.7 per cent (1,915 auctions).

2018-04-23--auctionstats

The results segregated by property type showed that units outperformed houses this week, with 65 per cent of units selling, while the combined houses returned a 62.2 per cent success rate; conversely the house market accounts for a higher proportion of overall auction activity.

2018-04-23--auctionclearancerates


Melbourne saw a total of 905 auctions take place this week, returning a 63.8 per cent preliminary clearance rate, which was slightly higher than the 62.4 per cent over the week prior when 873 auctions were held.

The number of homes taken to auction across Sydney fell this week, with 551 held. The lower volumes returned a higher week-on-week clearance rate with 66.4 per cent of properties reportedly selling, increasing on the week prior’s 61.5 per cent final clearance rate when volumes were higher (795).

The performance across the smaller auction markets continues to be quite varied, with Tasmania returning the highest preliminary clearance rate of 75 per cent, while only 19 per cent of auctions were successful across Perth.

Will The Royal Commission Put Bank Profits Under Pressure?

Given the range of issues already exposed by the Royal Commission into Financial Services Misconduct, including selling loans outside suitable criteria, fees from advice not given and other factors; we need to ask about the impact on the profitability of the banks and so share prices.

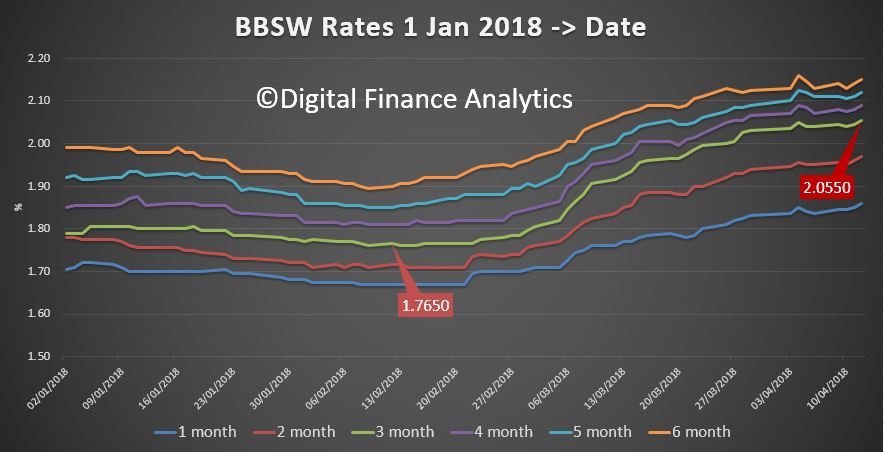
And all this is in the context of higher funding costs already hitting.

A number of international investors and hedge funds have placed shorts on the major banks, signalling an expectation of further falls in share price ahead, but the majors have already dropped by around 15% in the past year.

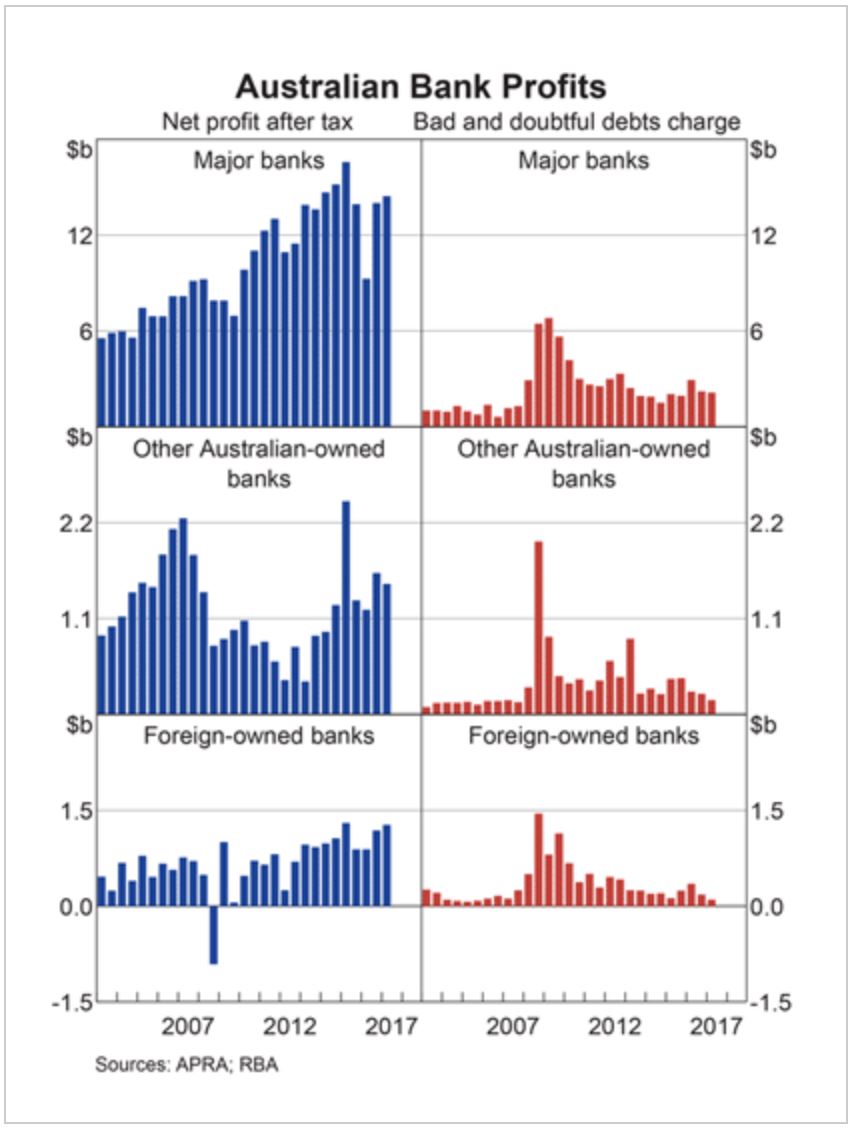
The recent RBA chart pack contained this picture on profitability. Bad and doubtful debts are very low, thanks to low interest rates. But that may change if rates were to rise, and “liar loans” are wide spread.  There is no good data on the potential impact so far.

It is important to remember the Productive Commission recently called out that :

Australia’s major banks have delivered substantial profits to their shareholders — over and above many other sectors in the economy and in excess of banks in most other developed countries post GFC

A quick survey of the banks from last year show that the return on equity – a measure of absolute profitability – or ROE range from 14.5% for CBA, 10.3% from NAB, 10.9% for ANZ and Westpac was 13.3% while AMP was 11.5%.
Looking overseas, US based Wells Fargo, which happens to be a key Warren Buffett holding, was 11.5% , the Bank of America earned less than 6.8% and  Lloyds  earns 4%. Barclays was -2.7%. In fact among western markets, only Canadian banks come close to our ROE’s – for example of Bank of Montreal was 11.3% but then they have the same structural issues that we do.

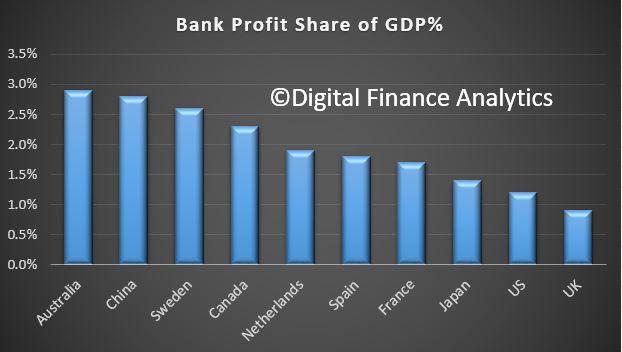
Data from news.com.au from 2016 shows the relative profit to GDP across several countries. Australia Wins.

That means 2.9 per cent of every $100 earned in Australia ends up as bank pre-tax profit, compared to the US and UK at $1.2 and 90 cents per cent respectively.

China is the highest after Australia at $2.80, Sweden $2.60 and Canada $2.30.

The Australia Institute also pointed to public money being used to secure the banking sector.

“Excessive profits provide a drag on the economy and hurt consumers who pay higher margins on bank products. The Reserve Bank found the big four banks enjoy an implicit government subsidy worth up to $4 billion dollars a year,”

The Royal Commission revelations have the potential to impact the market value of the banks as reflected in their share prices, and also  raises questions about the financial stability of the entire system in Australia.  APRA, in particular and the RBA have been (over?) focussed on financial stability, as the recent Productive Commission draft report highlighted.

Regulators have focused on a quest for financial stability prudential stability since the Global Financial Crisis, promoting the concept of an unquestionably strong financial system.

The institutional responsibility in the financial system for supporting competition is loosely shared across APRA, the RBA, ASIC and the ACCC. In a system where all are somewhat responsible, it is inevitable that (at important times) none are. Someone should.

The Council of Financial Regulators should be more transparent and publish minutes of their deliberations. Under the current regulatory architecture, promoting competition requires a serious rethink about how the RBA, APRA and ASIC consider competition and whether the Australian Competition and Consumer Commission (ACCC) is well-placed to do more than it currently can for competition in the financial system.

Over the next few days we will try to assess the potential impact ahead, from higher loss rates, lower fee income and potential fines and penalties. Then of course, there is the question, will these additional costs be passed on to investors and shareholders, or simply recovered from the current customer based by higher fees.

We expect banks to start making provisions for the revenue hits ahead. ANZ, for example, said their RC legal bill will be around $15 million.  CBA made a $200 million expense provision for expected costs relating to currently known regulatory, compliance and remediation program costs, including the Financial Services Royal Commission.

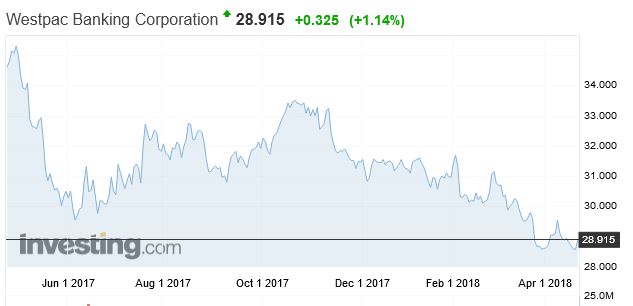
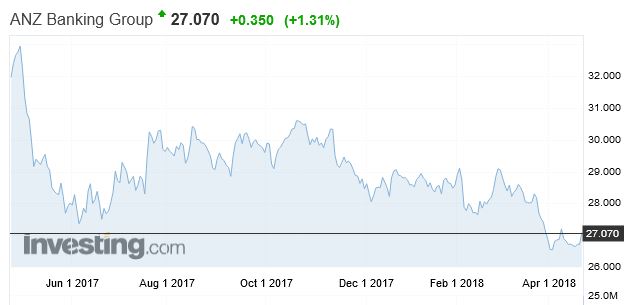
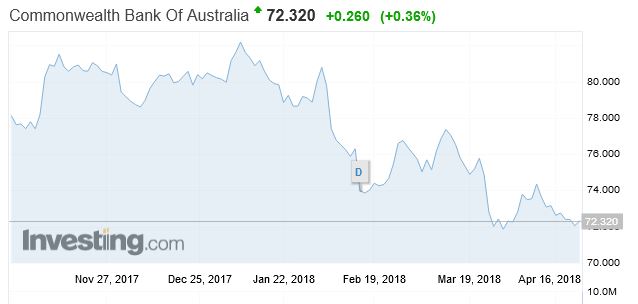
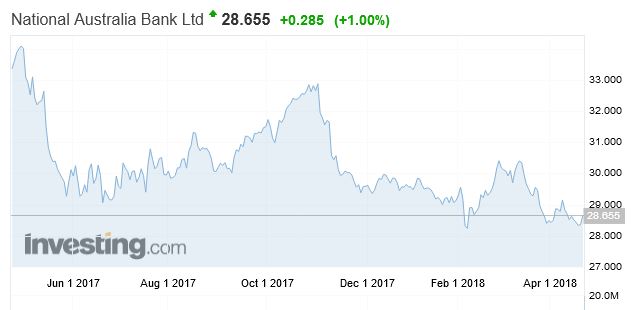
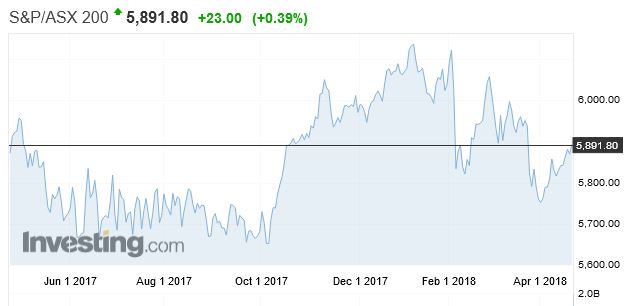
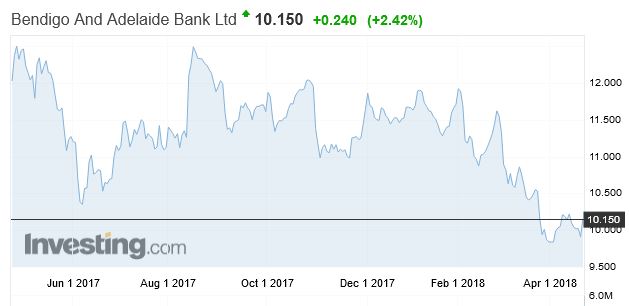
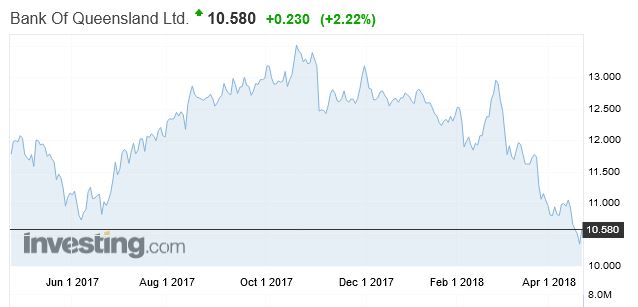
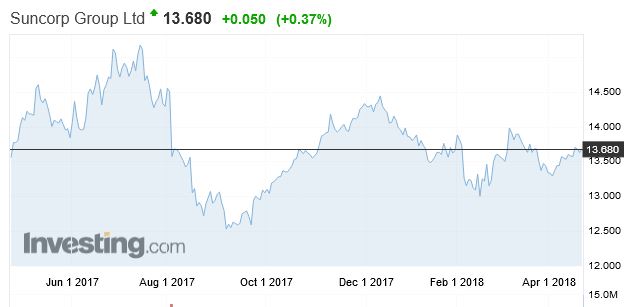
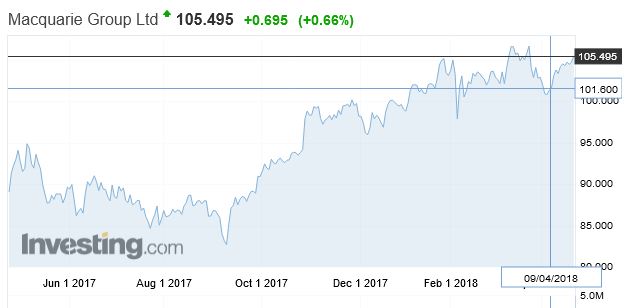
To start the journey lets look at the relative performance of the banks’ share prices over the past year. Westpac share price is 16.8% lower compared with a year ago.

ANZ is down 16% over the same period

CBA has fallen 15.9% in the past 12 months.

and NAB’s share price dropped 14.2% over the same period.

In comparison, the ASX 200 is up 0.25% over the past year.

Among the regional banks,  Bendigo Bank has fallen 16.6%

Bank Of Queensland has fallen 11.7% over the past year.

In contrast Suncorp is 0.74% higher

and Macquarie Group was up 19.5%. They of course have more than half their business offshore now.

Next time, we try to size the revenue hits ahead, and think about what that may mean for the banks and their customers.

Government Re-spins The Royal Commission Spin

The ABC is reporting that Malcolm Turnbull said in hindsight it would have been better for the Government to have set up a banking royal commission two years ago.

Mr Turnbull and his senior colleagues have spent the past two years arguing against a royal commission into the financial sector, although some of his backbenchers were campaigning vigorously for a royal commission.

ABC Insiders did a nice montage yesterday showing the evolution of the spin, from initially vehemently resisting a commission.

The PM finally called a royal commission late last year and shocking revelations have emerged as it has been taking evidence.

This was after an appalling interview with Kelly O’Dwyer who has been the Minister for Revenue and Financial Services, since July 2016.

BT considered ending ‘share of revenue’

From InvestorDaily.

Public hearings into the financial advice sector continued on Friday as BT Financial Advice general manager Michael Wright continued giving evidence.

Counsel assisting Rowena Orr grilled Mr Wright on the remuneration practices of Westpac/BT and whether its planners could be considered professionals when they are incentivised with sales targets.

Mr Wright said that while advisers are not viewed as ‘professionals’ by Australians in the same way that doctors are, the perception is changing for the better.

Furthermore, he said, the ‘balanced scorecard’ for Westpac advisers will be changed to include more non-financial factors.

“We’ll be setting peoples’ remuneration off their qualifications, based off their competency as an adviser, based off the standards that they go through with advisers,” he said.

“We will not set people’s remuneration – fixed or variable – based off how much money they write,” Mr Wright said.

However, Ms Orr pointed out that one-fifth of the ‘balanced scorecard’ for the company’s advisers will include financial measures.

“We debated this long and hard. The reality is we want to have a viable, sustainable, professional business. We’ve not a charity,” he said.

“We considered removing revenue from the scorecard and having 100 per cent non-financials,” Mr Wright said.

From 1 October 2018, Mr Wright said, BT will be ending grandfathered commissions for superannuation and investments – although risk commissions will remain (as per the Life Insurance Framework).

When it comes to the advice business he oversees, Mr Wright said he would be “delighted” if BT moved to a completely fee-for-service model.

However, with his “BT product provider hat on”, he said there is a first-mover disadvantage to being the first institution to end grandfathering completely.

Sydneysiders more supportive of foreign investment

From The Conversation.

Property investors are more likely to support foreign investment in the property market than people without such investments, we have found in a survey of Sydneysiders’ views about foreign real estate investment. Perhaps more surprising, would-be buyers, who might be expected to worry about demand pushing up prices, were also more likely to be supportive than those who were not looking to buy a property.

We reported previously that over 60% of Sydneysiders do not want more individual foreign investment in residential real estate in Sydney.

Within this context, we surveyed almost 900 people in Sydney to examine the relationships between home ownership, real estate investment, housing stress and views about foreign investment. Our analysis shows:

  1. Those who have property market investments are more likely to be supportive of foreign investment than those who don’t have such investments.
  2. Comparing those who are in housing stress to those who are not in housing stress, there are no significant differences in the two groups’ beliefs about foreign real estate investment.

Property investors’ views

We know that rising house prices, the era of Generation Rent and foreign real estate investment are creating the social conditions that could increase cultural tension between foreign and local buyers.

One group with a strong interest in Sydney’s real estate market are local real estate investors. We were interested in whether those with investment properties and those without differed in their views about individual foreign investment in residential real estate.

We found those with investment properties were likely to be more supportive of foreign investment in Sydney’s housing market than those without investment properties.

For example, 29% of the investment property owners agreed that “foreign investors should be able to buy properties in Sydney” compared to 17% of those without investment properties. They were similarly supportive of foreign students being allowed to buy properties while studying in Australia, with 32% agreeing with this compared to 19% among those without investment properties.

Property investors were more positive about the government’s regulation of foreign investment as well: 28% agreed it has been effectively regulated, compared to 16% of those without investment properties.

House hunters’ views

House prices in Greater Sydney have increased rapidly over the last decade and household debt has grown too.

We might expect people who are actively looking to buy a property to be particularly concerned about foreign real estate investment, as they may feel they are competing against and being priced out of the market by foreign buyers.

For this reason, we asked survey participants whether they were actively looking to buy a property. In response, 23% said they were. Of this group, 31% agreed that foreign investors should be able to buy properties in Sydney, compared to 15% of those not looking for a property.

Housing-stressed households’ views

Increasing mortgage and rental costs are a source of discontent within Sydney’s population. Measurements of housing stress are disputed, but are nonetheless used to give a comparative value to how hard it is for a household to meet housing costs. A ratio of housing costs to income of 30% and above is a common benchmark for housing stress.

Using this measure, we found that more than half (52%) of our survey participants were experiencing housing stress. Another 33% spent less than 30% of their income on their housing and 15% indicated they did not know.

Comparing those over the 30% threshold with those who spend less of their income on housing, we found no significant differences in beliefs about foreign real estate investment.

Other drivers of concern

We found those who are active in the local real estate market remain concerned about foreign investment in general.

If housing stress levels do not lead to differences in attitudes to foreign investment, as our findings suggest, cultural or other factors may be at work in the general discontent about foreign investors in Sydney.

We need to investigate further how being active in the housing market informs Sydneysiders’ views about the right of foreign investors to use real estate as a vehicle for growing capital.

Sydneysiders with equity in the housing market, such as home owners or investors, might view foreign buyers pushing up housing values as positive. As a result, they might fear that restricting foreign investors might depress their assets.

If this type of shared commitment to real estate investment were present across the domestic-foreign investor divide, this could reinforce the idea of treating real estate as an asset class at the global scale, while cultural tensions between foreign and local investors remain at the local level.

Authors: Dallas Rogers, Program Director, Master of Urbanism. School of Architecture, Design and Planning, University of Sydney; Alexandra Wong, Engaged Research Fellow, Institute for Culture and Society, Western Sydney University; Jacqueline Nelson, Chancellor’s Postdoctoral Research Fellow, University of Technology Sydney

US Mortgage Rates Higher Again

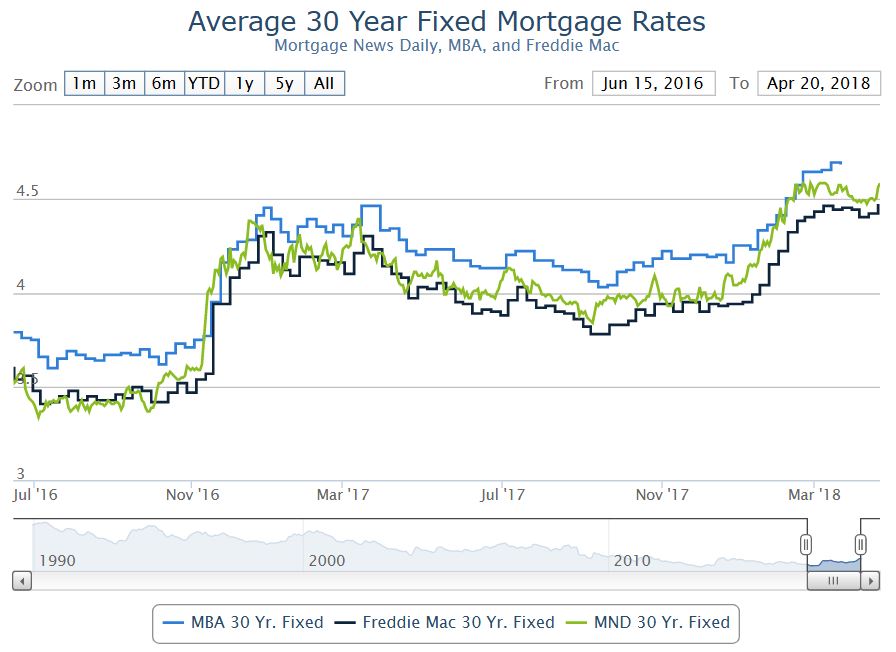
The latest US data shows mortgage rates in the US continue higher.  And more to come.

Here is the latest commentary from the Mortgage Rates Newsletter.

Let’s clear one thing up before we begin.  Freddie Mac, MBA, and Ellie Mae all noted new 4-year highs in mortgage rates this week.  They are all technically wrong.  This has to do with the way their data is collected and/or averaged.  And while I have no doubt that they are accurately conveying the results of their data collection efforts according to their methodology, there is a more accurate way to do things.  Specifically, we can track actual lenders’ rate sheets every day.

Even if we take an average of that daily data, we still find that rates aren’t quite back to 4-year highs just yet.  Depending on the lender, these occurred on one of the days near the end of February.  In fact, some lenders’ rates from March 21st are still higher than today’s.  Are we talking about very big differences between now and then?  Not at all!  But if we’re going to talk about rates hitting 4-year highs, we might as well be precise about it.

One thing everyone can agree on is that today’s rates are higher than yesterday’s, which in turn, were higher than Wednesday’s.  The lion’s share of that move higher happened yesterday, but today’s underlying bond market movement suggests there’s a bit more pain yet to be priced-in to the average lender’s mortgage rate sheets.

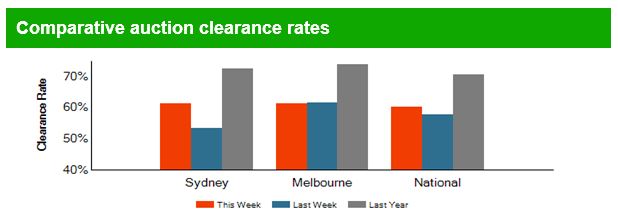
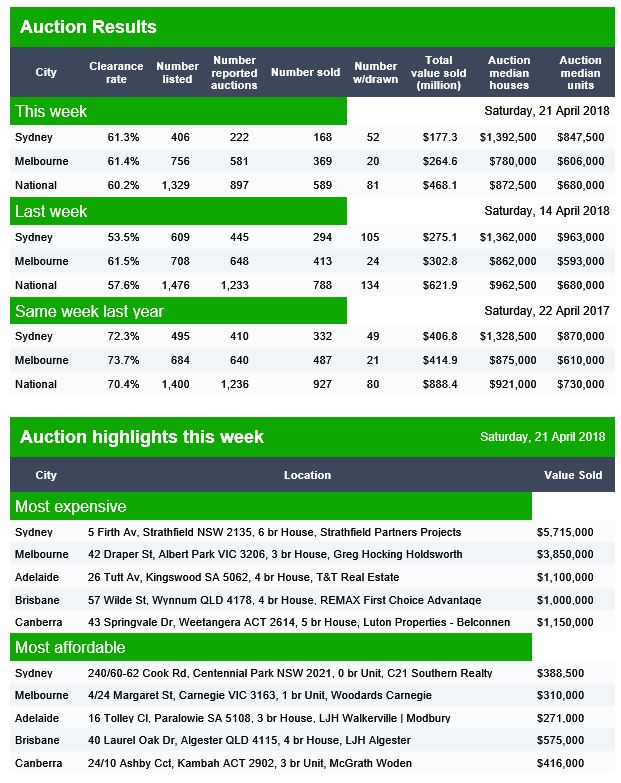
Auction Results 21 Apr 2018

The preliminary auction results are in from Domain.  Once again volumes are down, and clearance rates will settle lower than last year.  Also, it looks like more property is being withdrawn.

Brisbane sold 15 of 38 reported auctions from 67 scheduled.  Adelaide ran 31 auctions from the 69 listed, with 23 sold. Canberra ran 25 auctions from 31 listed with 14 sold.