In another sign of weakening banking supervision, the FED proposes new rules to “tailor leverage ratio requirements“. Tailoring appears to mean reduce!
The Federal Reserve Board and the Office of the Comptroller of the Currency (OCC) on Wednesday proposed a rule that would further tailor leverage ratio requirements to the business activities and risk profiles of the largest domestic firms.
Currently, firms that are required to comply with the “enhanced supplementary leverage ratio” are subject to a fixed leverage standard, regardless of their systemic footprint. The proposal would instead tie the standard to the risk-based capital surcharge of the firm, which is based on the firm’s individual characteristics. The resulting leverage standard would be more closely tailored to each firm.
The proposed changes seek to retain a meaningful calibration of the enhanced supplementary leverage ratio standards while not discouraging firms from participating in low-risk activities. The changes also correspond to recent changes proposed by the Basel Committee on Banking Supervision. Taking into account supervisory stress testing and existing capital requirements, agency staff estimate that the proposed changes would reduce the required amount of tier 1 capital for the holding companies of these firms by approximately $400 million, or approximately 0.04 percent in aggregate tier 1 capital.
Enhanced supplementary leverage ratio standards apply to all U.S. holding companies identified as global systemically important banking organizations (GSIBs), as well as the insured depository institution subsidiaries of those firms.
Currently, GSIBs must maintain a supplementary leverage ratio of more than 5 percent, which is the sum of the minimum 3 percent requirement plus a buffer of 2 percent, to avoid limitations on capital distributions and certain discretionary bonus payments. The insured depository institution subsidiaries of the GSIBs must maintain a supplementary leverage ratio of 6 percent to be considered “well capitalized” under the agencies’ prompt corrective action framework.
At the holding company level, the proposed rule would modify the fixed 2 percent buffer to be set to one half of each firm’s risk-based capital surcharge. For example, if a GSIB’s risk-based capital surcharge is 2 percent, it would now be required to maintain a supplementary leverage ratio of more than 4 percent, which is the sum of the unchanged minimum 3 percent requirement plus a modified buffer of 1 percent. The proposal would similarly tailor the current 6 percent requirement for the insured depository institution subsidiaries of GSIBs that are regulated by the Board and OCC.
As Facebook’s Mark Zuckerberg testifiesbefore Congress, he’s likely wondering how his company got to the point where he must submit to public questioning. It’s worth pondering how we, the Facebook-using public, got here too.
Repugnant as its methods were, Cambridge Analytica did not create this crisis on its own. As I argue in my forthcoming book, “The Known Citizen: A History of Privacy in Modern America,” big corporations (in this case, Facebook) and political interests (in this case, right-wing parties and campaigns) but also ordinary Americans (social media users, and thus likely you and me) all had a hand in it.
The allure of aggregate data
Businesses and governments have led the way. As long ago as the 1840s, credit-lending firms understood the profits to be made from customers’ financial reputations. These precursors of Equifax, Experian and TransUnion eventually became enormous clearinghouses of personal data.
Police forces and national security analysts, too, gathered fingerprints and other data in the name of social control. Today, they employ some of the same methods as commercial data miners to profile criminals or terrorists, crafting ever-tighter nets of detection. State-of-the-art public safety tools include access to social media accounts, online photographs, geolocation information and cell tower data.
Citizens were not just unwitting victims of these schemes. People have regularly, and willingly, revealed details about themselves in the name of security, convenience, health, social connection and self-knowledge. Despite rising public concerns about privacy and data insecurity, large numbers of Americans still find benefits in releasing their data to government and commercial enterprises, whether through E-ZPasses, Fitbits or Instagram posts.
Revealing ourselves
It is perhaps particularly appropriate that the Facebook scandal bloomed from a personality test app, “This is your digital life.” For decades, human relations departments and popular magazines have urged Americans to yield private details, and harness the power of aggregate data, to better understand themselves. But in most situations, people weren’t consciously trading privacy for that knowledge.
In the linked and data-hungry internet age, however, those volunteered pieces of information take on lives of their own. Individual responses from 270,000 people on this particular test became a gateway to more data, including that belonging to another 87 million of their friends.
Today, data mining corporations, political operatives and others seek data everywhere, hoping to turn that information to their own advantage. As Cambridge Analytica’s actions revealed, those groups will use data for startling purposes – such as targeting very specific groups of voters with highly customized messages – even if it means violating the policies and professed intentions of one of the most powerful corporations on the planet.
The benefits of aggregate data help explain why it has been so difficult to enact rigorous privacy laws in the U.S. As government and corporate data-gathering efforts swelled over the last century, citizens largely accepted, without much discussion or protest, that their society would be fueled by the collection of personal information. In this sense, we have all – regular individuals, government agencies and corporations like Facebook – collaborated to create the present crisis around private data.
But as Zuckerberg’s summons to Washington suggests, people are beginning to grasp that Facebook’s enormous profits exploit the value of their information and come at the price of their privacy. By making the risks of this arrangement clear, Cambridge Analytica may have done some good after all.
Author: Sarah Igo, Associate Professor of History; Associate Professor of Political Science; Associate Professor of Sociology; Associate Professor of Law, Vanderbilt University
RBA Governor Philip Lowe discussed “Regional Variation in a National Economy” today in an address to the Australia-Israel Chamber of Commerce (WA). It is worth reading, not least because of the regional variations he highlights. However, the section on monetary policy piqued my interest.
In particular, that the next cash rate move is likely to be up. Recently a number of pundits have started to say there will be a cut. Perhaps not!
The Reserve Bank’s responsibility is to set monetary policy for Australia as a whole. We seek to do that in a way that keeps the national economy on an even keel, and inflation low and stable. No matter where one lives in Australia, we all benefit from this stability and from being part of a national economy. This is so, even if, at times, in some areas, people might wish for a different level of interest rates from that appropriate for the national economy. In setting that national rate, I can assure you we pay close attention to what is happening right across the country.
As you are aware, the Reserve Bank Board has held the cash rate steady at 1½ per cent since August 2016. This has helped support the underlying improvement in the economy that I spoke about earlier.
In thinking about the future, there are four broad points that I would like to make.
The first is that we expect a further pick-up in the Australian economy. Increased investment and hiring, as well as a lift in exports, should see stronger GDP growth this year and next. The better labour market should lead to a pick-up in wages growth. Inflation is also expected to gradually pick up. So, we are making progress.
There are, though, some uncertainties around this outlook, with the main ones lying in the international arena. A serious escalation of trade tensions would put the health of the global economy at risk and damage the Australian economy. We also have a lot riding on the Chinese authorities successfully managing the build-up of risk in their financial system. Domestically, the high level of household debt remains a source of vulnerability, although the risks in this area are no longer building, following the strengthening of lending standards.
The second point is that it is more likely that the next move in the cash rate will be up, not down, reflecting the improvement in the economy. The last increase in the cash rate was more than seven years ago, so an increase will come as a shock to some people. But it is worth remembering that the most likely scenario in which interest rates are increasing is one in which the economy is strengthening and income growth is also picking up.
The third point is that the further progress in lowering unemployment and having inflation return to the midpoint of the target zone is expected to be only gradual. It is still some time before we are likely to be at conventional estimates of full employment. And, given the structural forces also at work, we expect the pick-up in wages growth and inflation to be only gradual.
The fourth and final point is that, because the progress is expected to be only gradual, the Reserve Bank Board does not see a strong case for a near-term adjustment in monetary policy. While some other central banks are raising their policy rates, we need to keep in mind that their economic circumstances are different and that they have had lower policy rates than us over the past decade, in some cases at zero or even below. A continuation of the current stance of monetary policy in Australia will help our economy adjust and should see further progress in reducing unemployment and having inflation return to target.
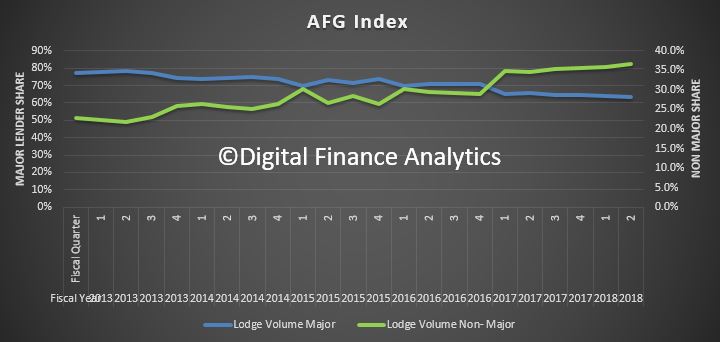
… and more loans going to the non-major lenders, as the big four hunker down. Whilst it is myopic, as it looks at volumes through their channels, it is a pretty good indicator of what is happening more widely.
Lower credit volumes will drive prices lower.
They of course emphasis the importance of brokers, as one might expect, given their position in the market:
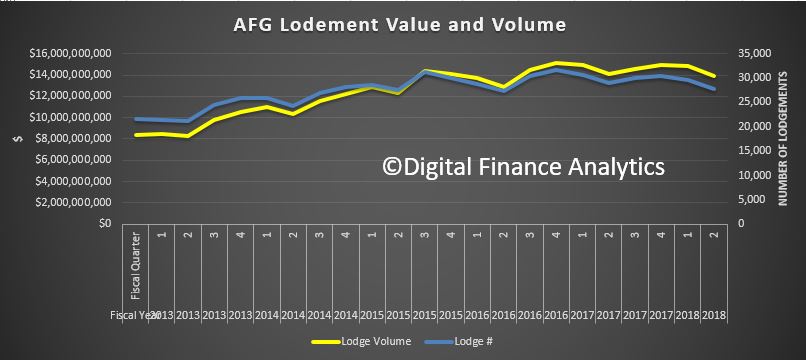
The release today of the AFG Mortgage Index (ASX:AFG) highlights that the ongoing regulatory intervention into the sector is potentially stifling growth in mortgage applications. Further growth in non-major market share reinforces an increasing appetite for these lenders and highlights the vital role mortgage brokers play in enabling these lenders to compete.
AFG Chief Executive Officer David Bailey explained the results, “Whilst there is likely to be some small seasonal impact on numbers for the quarter, the Index highlights some marginal softening compared to the same period in 2017 with lodgements down just 1.8% on the prior period and just 0.8% on a rolling 12-month basis.
“Given the timing of public holidays and suggestions that Sydney house prices are coming off a little, the fact that there does not seem to be any growth is not surprising,” he said. The only market in the country which appears to be generating ongoing growth is Victoria.
“Western Australia, whilst initially showing signs of some green shoots earlier in the quarter appears to have softened. First home buyers are a known stimulant for an economy, so we hope that the recently announced increased GST allocation to WA will be used in part to stimulate this sector.
Interest Only home loans appear to have levelled off at around 20% over the past three quarters. “With some lenders indicating they again have an appetite for this type of lending, we would probably call this the bottom for this segment of the market.
AFG’s data also shows the non-majors have continued to pick up market share to now be sitting at more than 36%.
“AFG has 45 lenders on its panel,” said Mr Bailey. “This distribution model creates competitive tension in the lending market which leads to increased consumer choice and, most importantly, improved loan pricing and service across the entire market which benefits all Australian borrowers.
Industry regulator ASIC concluded in its recent examination of the sector that mortgage broking promotes competition by playing a valuable role in providing a distribution channel for lenders, particularly smaller lenders, and exerting downward pressure on home loan pricing,” said Mr Bailey.
“The presence of the mortgage broking channel is one of the few drivers of competitive tension in the Australian lending market.
More data showing the impact of the fleeing of property investors on the property market. We suspect the decline will continue as credit rules are tightened.
The HIA begs for no further constraints on this sector of the market, but with one third of loans for investment purposes, it is still too high. Remember the Bank of England got twitchy at 16%.
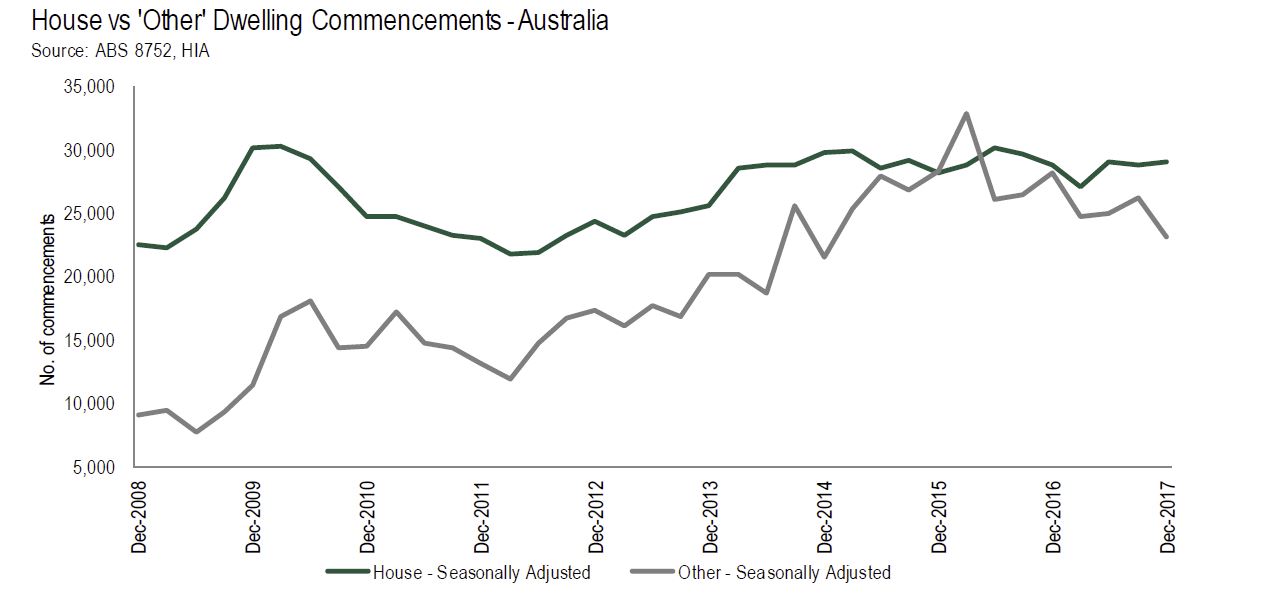
“Investors have been the target of a number of regulatory interventions and we are now seeing this impact on residential building activity,” said HIA Senior Economist, Geordan Murray.
The ABS today released building activity data for the final quarter of 2017. Detached house commencements increased by 0.7 per cent over the December 2017 quarter, while starts for other dwelling types (predominantly apartments) declined by 11.2 per cent.
“The decline in multi-unit dwelling starts has dragged down the total number of new home starts during the final quarter of 2017. The total number of dwellings starts fell by 5.0 per cent in the December 2017 quarter and was down by 8.3 per cent on the level recorded a year earlier,” added Mr Murray.
“In contrast to the decline in multi-unit starts, the resilience of the detached house market continued to shine through. The number of detached house starts during the December quarter of 2017 increased by 0.7 per cent over the quarter and was up by a similar amount compared with the level of a year ago.
“Despite the soft starts result in the quarter, the pipeline of multi-unit activity remains quite large. There were still over 150,000 multi-unit dwellings under construction at the end of the 2017, which is only slightly below the 155,000 level at the peak of the cycle. There are a further 33,800 dwellings in projects that have been approved and are yet to start work, this is a record high.
“The combination of falling commencements and the build-up of dwellings in projects awaiting commencement is somewhat concerning. It is likely to indicate a slowdown in pre-sales activity. New projects will not commence construction until they achieve a satisfactory level of pre-sales.
“Pre-sales to investors, both domestic and from overseas, have been important for many multi-unit developments. With additional taxes on foreign investors and regulators clamping down on investor lending, investors have retreated from the market.
“If we see investors return to the market and the approved projects continue to progress through to work on the ground then residential building work could potentially make a stronger contribution to economic growth this year than we are expecting.
“Now is not the time to impose additional taxes or constraints on investors,” concluded Geordan Murray.
Mark this date – 10th June 2018. This is the date of the Swiss Federal referendum on the Sovereign Money Initiative (or “Vollgeld-Initiative” in German). Swiss voters will be asked who should be allowed to create new Swiss francs: UBS, Credit Suisse and other private commercial banks or the Swiss National Bank which is obliged to act in the interest of Switzerland as a whole.
This is the latest incarnation of the so-called Chicago Plan, which is an alternative proposal as to how banking, and central banking should be set up.
The ideas are not new, they emerged in the 1930’s, at the height of the Great Depression when a number of leading U.S. economists advanced a proposal for monetary reform that later became known as the Chicago Plan.
It envisaged the separation of the monetary and credit functions of the banking system, by requiring 100% reserve backing for deposits. Irving Fisher (1936) claimed the following advantages for this plan: (1) Much better control of a major source of business cycle fluctuations, sudden increases and contractions of bank credit and of the supply of bank-created money. (2) Complete elimination of bank runs. (3) Dramatic reduction of the (net) public debt. (4) Dramatic reduction of private debt, as money creation no longer requires simultaneous debt creation. It was supported by other luminaries such as Milton Friedman.
The ideas were brought to more recent attention following the release of an IMF paper – The Chicago Plan Revisited. We discussed the report in an earlier blog.
As we discussed more recently, the classic theory of banking, that deposits lead to banks making loans is incorrect. In fact banks create loans from “thin air”, and have all but unlimited capacity to do so. As customers take the loans, and use them to buy things, or place into deposit, money is created. No other party needs to be involved. The trouble is, not many central bankers get this alternative view, so continue to execute flawed policies, such as Quantitative Easing, and ultra-low interest rates. Banks are intermediaries, not credit creators, they say; when in fact the create funds from nowhere. But this leads to problems as we see today.
But, be clear, when a loan is created, it does indeed generate new purchasing power.It becomes part of a self-fulling growth engine. But at what cost?
Understand that the only limit on the amount of credit is peoples ability to service the loans – eventually. The more loans the banks can make, the larger they become, and the more of the economy banks consume. This is what has happened in recent times. It leads to the financialisation of property, asset price inflation and massive and unsustainable increases in debt. The only way out is the inevitable crash, so we get a state of booms and busts.
Whilst there are some controls on the banks thanks to the Basel requirement to hold a certain proportion of liquid assets against the loans, but it is a fraction of the total loans made, and there is a multiplier effect which means that very little of the shareholders capital in the banks are required to support the loans. In other words, Banks are hugely leveraged. In addition, Basel capital rules favours unproductive lending for secured property (houses and apartments) over productive lending to businesses.
In addition, Central banks have very limited ability to control the money supply, contrary to popular belief, and so their main policy control is interest rates. Lift rates to slow the economy, drop rates to drive the economy harder, against a target inflation outcome. But this is a very blunt tool. This also means that the idea of narrow money, spilling out from a multiplier effect is also flawed.
Well, now perhaps the tide is turning.
In the aftermath of the 2008 financial crisis, Iceland commissioned a report “Monetary Reform – A better monetary system for Iceland” which was published in 2015, and suggests that money creation is too important to be left to bankers alone.
Back in 2014 I discussed this, based on an insight from the Bank of England. Their Quarterly Bulletin (2014 Q1), was revolutionary and has the potential to rewrite economics. “Money Creation in the Modern Economy” turns things on their head, because rather than the normal assumption that money starts with deposits to banks, who lend them on at a turn, they argue that money is created mainly by commercial banks making loans; the demand for deposits follows. Rather than banks receiving deposits when households save and then lending them out, bank lending creates deposits.
More recently the Bank of Norway confirmed this, and said “The bank does not transfer the money from someone else’s bank account or from a vault full of money. The money lent to you by the bank has been created by the bank itself – out of nothing: fiat – let it become.”.
And even the arch conservative German Bundesbank said in 2017 recently “this means that banks can create book money just by making an accounting entry: according to the Bundesbank’s economists, “this refutes a popular misconception that banks act simply as intermediaries at the time of lending – ie that banks can only grant credit using funds placed with them previously as deposits by other customers“.
So, the Chicago Plan is a alternative approach. Here banks cannot lend by creating new deposits.
Rather, their loan portfolio now has to be backed by a combination of their own equity and non-monetary liabilities. If we assume that this funding is supplied exclusively by the government treasury, private agents are limited to holding either bank equity or monetary instruments that do not fund any lending. Under this funding scheme the government separately controls the aggregate volume of credit and the money supply. The transition to this new balance sheet conceptually takes place in two stages that both happen in a single transition period. In the first stage, banks instantaneously increase their reserve backing for deposits from 0% to 100%, by borrowing from the treasury. In the second stage, the government can independently control money and treasury credit. It exercises this ability by cancelling all government debt on banks’ balance sheets against treasury credit, and by transferring part of the remaining treasury credit claims against banks to constrained households and manufacturers, by way of restricted accounts that must be used to repay outstanding bank loans. This second stage leaves only investment loans outstanding, with money unchanged and treasury credit much reduced. Net interest charges from the previous period remain the responsibility of the respective borrowers.
Part of the transition plan would be the full buy-back of household debt by the government, making all households effectively debt free. This of course means that household consumption is likely to rise.
In the transition period households only pay the net interest charges on past debts incurred by constrained households to the banking sector. The principal is instantaneously cancelled against banks’ new borrowing from the treasury, after part of the latter has been transferred to the above-mentioned restricted private accounts and then applied to loan repayments. From that moment onward the household sector has zero net bank debt, while their financial assets consist of government bonds and deposits, the latter now being 100% reserve backed.
Now this approach to me has significant merit, and I believe it should be considered as a platform to deal with the current economic situation we face. This appears to be a better, if more radical approach than the so called Glass-Steagall separation of speculative banking assets from core banking operations, but which still perpetuates the current rocky banking road. The Chicago Plan offers significantly more benefits, and the opportunity to reset the economy, and household debt.
So, if the vote is successful on 10th June, the sovereign money bill would give the Swiss National Bank a monopoly on physical and electronic money creation, “while the decision concerning how new money is introduced into the economy would reside with the government,” says Vollgeld.
This also means that Central Banks have the ability to managed the overall money supply, rather than just narrow money and interest rates. And the flows of credit can go to productive business investment, rather than inflated housing loans.
So the bottom line is, The Chicago Plan deserves to go mainstream, despite the howls from bankers, as their businesses get rightsized. It can also deal with the problem of highly indebted households and offers a path potentially to economic success. Current models have failed, time to move on!
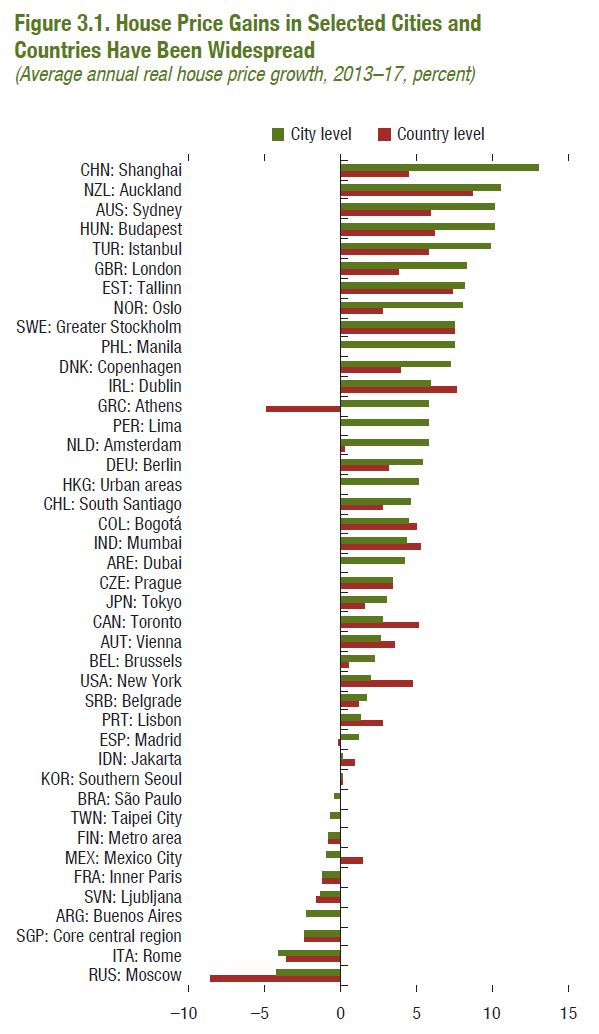
The IMF’s latest Global Financial Stability Report April 2018, includes a chapter on housing. They look at the global hike in home prices and attribute much of it to the globalisation of finance.
Australian cities are well up the list in terms of gains and also global impact. However, to me they missed the key link. It is the ultra-low interest rates result from QE, across many of these markets, either formally, or informally, which have driven the home prices higher; it is credit led. Sure credit can move across borders, but it was monetary policy which has created the problem.
The fall out of higher international finance rates will now flow directly to our doors, thanks to this same globalisation. Not pretty. So they also warn of risks as this all unwinds.
The chapter finds an increase in house price synchronization, on balance, for 40 advanced and emerging market economies and 44 major cities.
Countries’ and cities’ exposure to global financial conditions may explain rising house price synchronization. Moreover, cities in advanced economies may be particularly exposed to global financial conditions, perhaps because they are integrated with global financial markets or are attractive to global investors searching for yield or safe assets.
Policymakers cannot ignore the possibility that shocks to house prices elsewhere will affect markets at home. House price synchronization in and of itself may not warrant policy intervention, but the chapter finds that heightened synchronicity can signal a downside tail risk to real economic activity.
Macroprudential policies seem to have some ability to influence local house price developments, even in countries with highly synchronized housing markets, and these measures may also be able to reduce a country’s house price synchronization. Such unintended effects are worth considering when evaluating the trade-offs of implementing macroprudential and other policies.
A timely warning from the IMF about the rapid growth in credit, especially to risky areas, just before a financial crisis. I suspect this is just where Australia is currently!
Supervisors who monitor the health of the financial system know that a rapid buildup of debt during an economic boom can spell trouble down the road. That is why they keep a close eye on the overall volume of credit in the economy. When companies go on a borrowing spree, supervisors and regulators may decide to put the brakes on credit growth.
Trouble is, measuring credit volume overlooks an important question: how much of that additional money flows to riskier companies – which are more likely to default in times of trouble—compared with more creditworthy firms? The IMF’s latest Global Financial Stability Report seeks to fill that gap by constructing measures of the riskiness of credit allocation, which should help policy makers spot clouds on the economic horizon.
Our researchers crunched 25 years of data for nonfinancial companies in 55 emerging and advanced economies. They found that when credit grows rapidly, the firms where debt expands faster become increasingly risky in relation to those with the slowest debt expansions. Such an increase in the riskiness of credit allocation, in turn, points to greater odds of a severe economic downturn or a banking crisis as many as three years into the future.
Extra dose
This buildup of lending to relatively less creditworthy companies adds an extra dose of risk – on top of the dangers that may come with the rapid growth of credit overall. Of course, lending to risky firms may be perfectly rational and profitable. But it can also spell trouble if it reflects poorer screening of borrowers or excessive risk-taking.
Fortunately, regulators can take steps to protect the financial system, if necessary. They can require banks to hold more capital or impose limits on bank loan growth, restraining their risk-bearing capacity and increasing their buffers. Ensuring the independence of bank supervisors, enforcing lending standards, and strengthening corporate governance by protecting minority shareholders can also help keep risks in check.
Why does more credit flow to risker firms in good times? It’s possible that investors are unduly optimistic about future economic prospects, leading them to extend credit to more vulnerable firms. If interest rates are unusually low, banks and investors may be tempted to lend money – in the form of loans or bonds – to riskier companies that pay relatively higher rates of interest. We have seen this “search for yield” in advanced economies in recent years because of the prolonged period of ultra-low interest rates. The riskiness of credit allocation may thus be a good barometer of risk appetite.
Global pattern
Our study found a clear global pattern in the evolution of this new measure of financial vulnerability. Starting at elevated levels in the late 1990s, the riskiness of credit allocation fell from 2000 to 2004, in the aftermath of financial crises in Asia and Russia and the dot-com equity bubble. From a historic low in 2004, riskiness rose to a peak in 2008, when the global financial crisis erupted. It then declined sharply before rising again to a level near its historical average at the end of 2016, the last available data point. Riskiness may have continued to rise in 2017 as market volatility and interest rates remained very low in the global economy.
The Global Financial Stability Report holds a clear lesson for policy makers and regulators: both the total volume of credit and the riskiness of its allocation are important. A period of rapid growth is more likely to be followed by a severe economic downturn if more of that credit is flowing to riskier firms. Policy makers should pay close attention to both measures – and take the appropriate steps when warning signals flash.
There is a lot of hype in the business world surrounding the emerging blockchain technology and so called “smart contracts” – computer programs which execute the terms of an agreement. But like all computer programs, smart contracts can malfunction and even develop a mind of their own.
Smart contracts are popular because they promise cheaper, more secure and more efficient commercial transactions, so much so that even the federal government is investing millions of dollars into this technology.
Transactions in smart contracts are enforced by a network of people who use the blockchain– a decentralised, digital global ledger recording transactions. The blockchain effectively replaces traditional intermediaries such as banks, credit companies and lawyers because smart contracts can perform the usual “middleman” functions themselves.
Smart contracts can not only perform the terms of a contract autonomously, but can also be programmed to enter the human parties that created them into subsequent, separate follow-on contracts.
Whether these follow-on contracts are legally binding is not so straightforward. In fact, it highlights the complex intersection of new technology and old law.
What are smart contracts used for?
US law professor Harry Surden says financial firms often program computers to contract with other parties in security trades. Another example of smart contracts is the pricing and purchasing of certain types of advertisements on Google, which are negotiated autonomously between computers without any human intervention.
Companies are now using smart contracts to instantaneously buy and sell real estate, compensate airline passengers with travel insurance, collect debts, make rental payments, and more. But if a smart contract goes rogue, there can be significant consequences.
For example, in June 2017 Canadian digital currency exchange QuadrigaCX lost US$14 million worth of the cryptocurrency Ether when its underlying smart contract platform reacted to a software upgrade. The contract merely locked itself and subsequently lost the money.
Smart contracts on the blockchain are designed to be immutable, meaning the transactions they carry out cannot be amended or interrupted. So if things go wrong, there is little recourse.
When smart contracts make new agreements
So what would happen if a smart contract, which has been coded to make decisions, decided to enter parties into a another contract? In some cases, the human has final say to approve or reject the follow-on contract.
However, if the coding of a smart contract allowed sufficient intuition, it could bypass a human’s consent. Contracts written with code are capable of learning and may occasionally behave in a manner inconsistent with their instructions.
This possibility, and the questionable status of follow-on contracts, was raised in a white paper issued by renowned international law firm Norton Rose Fulbright in November 2016. The paper highlighted a number of possible legal views regarding follow-on contracts.
One view is that a programmed smart contract might be seen as the legal “agent” of its human creator and therefore has the power to make binding agreements on their behalf. This view has been rejected by some English courts on the basis that computer programs lack the consciousness of a human mind.
Some American courts have gone the opposite way, deeming a computer program acting autonomously in entering and violating contracts as acting with the dispatcher’s authority. In Australia, section 15C of the Electronic Transactions Act 1999(Cth) makes clear that a contract formed entirely through the interaction of automated message systems is:
…not invalid, void or unenforceable on the sole ground that no natural person reviewed or intervened in each of the individual actions carried out by the automated message systems or the resulting contract.
The law can imply an agency relationship in certain circumstances. Legally, then, a follow-on contract might be regarded as pre-authorised by the human creator of the original smart contract.
An alternative view is that a follow-on contract is not enforceable because the parties did not necessarily intend to create them. Legal intent is one of the core elements of contract validity.
However, in law, this is determined objectively: would a reasonable person in the position of the parties think a follow-on smart contract was acting with the legal authority of its human creator?
Some academics suggest that the answer may be yes, as the parties made the initial decision to enter into the smart contract and therefore indirectly assented to be bound by the system in which it operates.
As one commentator has argued, if a human intentionally coded a smart contract to make its own decisions, they must have intended to accept those decisions as their own.
The law generally presumes that commercial contracts are intended to be legally binding, even where computers play a part in the bargain.
Should we pull the plug?
So should we be hesitant to use smart contracts? Not necessarily: they offer enormous opportunity for businesses and consumers.
Blockchain technology is maturing rapidly and so it is only a matter of time before smart contracts feature more prominently in commerce.
Rather than being fearful, prospective users should be aware of and address the legal risks, including that autonomous smart contracts may be programmed with the capacity to spontaneously enter binding follow-on contracts.
Author: Mark Gianca, Lecturer in Law, University of Adelaide
In the second part of our series on the anatomy of the property auction results, we dive deeper into the numbers.
We compared data from CoreLogic and Domain, two of the players who report auction clearance rates. We summarised the research in our latest video blog.
In each case, there is an interim step, where both Domain and CoreLogic adjust to a lower number of actual auctions on the day. Domain calls them “the number of reported auctions” and CoreLogic “CoreLogic Auctions”.
So, this takes us to two questions. First how are the figures collated and second, what adjustment are made between the listed auctions and final figures?
Domain says their data comes from Australian Property Monitors (APM). APM is of course part of the Domain Group which is a subsidiary of Fairfax Media Limited. APM publishes auction activity results for the Sydney, Melbourne, Brisbane and Adelaide capital cities every Saturday evening, providing a snapshot of how demand and supply in the auction market is behaving and as a leading indicator for the overall property market. (Auction activity for the other capital cities is also monitored and made available by mid week)
APM adopts the Australian Bureau of Statistics geographic definition for capital cities, referred to as the Statistical Division (SD).
APM publishes Auction Clearance Rates (ACR) on the Saturday evening, based on the majority sample collected on that day, for release across various publications on the Sunday, while the process of collecting results continues throughout the week.
When reporting auction activity, APM monitors the following five key elements that can occur to properties listed for auction. These are;
a) Sold prior to auction;
b) Sold at auction (under the hammer)
c) Passed in
d) Withdrawn from auction, or
e) Sold after auction
Including some or all of these five elements of auction activity in the calculation used will affect the reported clearance rate.
APM’s definition of the reported clearance rate calculation is defined as: Sold at auction plus sold prior, over all reported plus withdrawn.
On the “top-line” of the clearance rate calculation, APM considers only those properties sold either prior or during the auction to be “sold at auction”.
On the “bottom-line”, APM includes all reported auctions (including properties passed in), and any listed auctions withdrawn prior to the scheduled auction time.
APM includes withdrawn auctions in the calculation to prevent any bias in the clearance rate caused by properties being withdrawn due to expectations it may not sell or fail to achieve an expected price. It’s still counted as no sale.
I also examined in detail the weekly listings of property sold, each transaction is coded in line with the APM method. I also saw a small number of what appeared to be duplicate transactions across weeks, but not a significant number so I think we can lay to rest the idea that the results may be being inflated by duplicating the same results across multiple weeks.
Turning to CoreLogic, I spoke with Tim Lawless their research guru. This is what he told me:
Our auction data is collected directly from the industry, via a variety of channels including our call centre based in Adelaide, results which are pushed through from agents via our app or portal, or via direct data feeds from agency groups. Each week we publish three sets of clearance rates: Saturday night, Sunday morning (CoreLogic media release) and final results on Thursday morning. The collection of auction results progressively improves across each release as we receive more results from the industry. By the time we finalise our collection on Wednesday afternoon, on average, we collect 90% of auction results.
There has been some discussion that auction results which are not reported each week must also be unsuccessful auctions intentionally withheld by the agent. There may be an element of this – real estate agents aren’t obliged to provide us with their results, however each week it is generally the same agents who choose not to provide their auction results to us.
Regardless, we publish our results with full transparency, showing the number of auctions, together with the number of results collected segmented by successful auctions (sold before, at or prior to auction) and unsuccessful results (unsold, vendor bid, withdrawn). For those that believe the clearance rate should be adjusted lower based on unreported auctions, it’s pretty easy to do so… however the direction of the trend would be very similar, just a lower clearance rate.
For a long time there has been discussion around whether auction results are accurate or not. As a data aggregator and analytics provider, it’s in our best interest to publish results that are as accurate as possible; we have no interest in talking the market up or down.
Thanks Tim.
My take out of that is there may be some holding back of failed sales by some agents, but there is no way to triangulate the quantum of the problem, and there is no mandatory reporting of results. So the data must be seen as a best endeavours exercise. Tim also makes an excellent point that the trends really tell the tale.
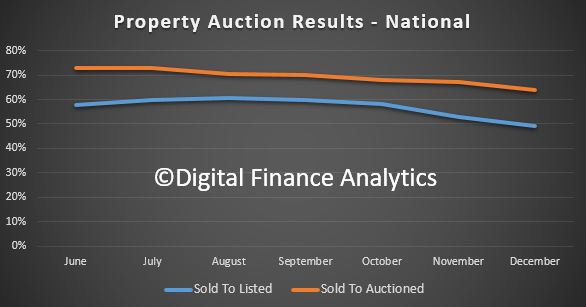
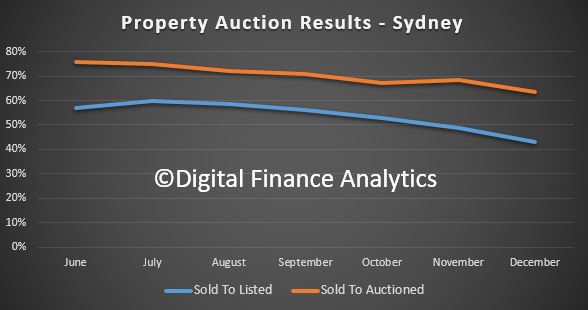
So, one final piece of the puzzle is some analysis we have done of the results, using both the percentage of all listings and sold property. I have charted the monthly trends for the second half of last year.
Here is the plot for Sydney. We see the clearance rates are declining, and the ratio of sold to listed is falling faster – suggesting that more properties are withdrawn (perhaps a sign of a fading market).
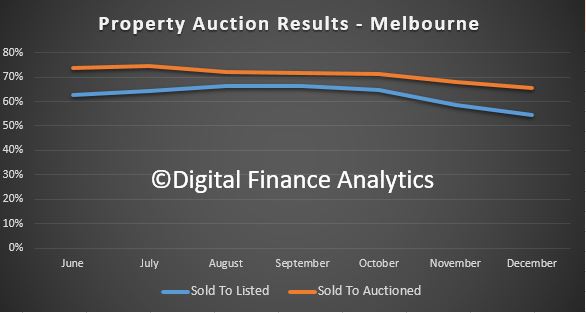
Compare this with Melbourne, where the momentum is also slowing, but the ratio of sold to listed is not so far below the sold to auctioned ratio – which suggests Melbourne is a little more buoyant (though is still slowing).
Finally, we can look at the national picture, which tells a similar story.
One final piece of the puzzle. If I then calculate the number sold properties compared with the transfer counts, which we discussed in a previous post, in the quarter to September 2017, the auctions comprised around 32% of all transfers made – allowing for an average 6-week delay in settling and completing the transaction. Looking back further, this ratio is pretty consistent. But in the December quarter, this shot up to 62% of transfers, which suggests that either there is now more false positives in the auction data, or the volume of non-auction sales has fallen. The former is, I think more likely than the latter, because in a falling market, I would expect a smaller number of auctions to run, compared with private sales. And we know that the listing volumes, and time in market, as well as discounts made to close a sale are all rising.
So, I think we need to be very careful when using the auction data. There is potential for agents to withhold negative results, but no one knows the extent of this. There is also some evidence of double counting, but only at the margin. Sydney looks the most suspicious.
In terms of the calculations, there are various tweaks made to the numbers and the two sources of data we looked at came out with different results. The trends are most telling, and the momentum was easing, up to the end of last year. We have not had enough normal weeks since January to trend the more recent weeks, and the ABS data will not be out for several weeks. We will revisit this later in the year
The most telling data is the mapping, or lack of it between the transaction data from the ABS and the auction results. This suggests to me there are more questions to ask. I have put some questions in to the ABS to dig further into their datasets, but I am still waiting for a reply. I will update you when I hear back. My suspicion is that ABS uses data feeds from CoreLogic, but the relevant page which outlines this, and the various terms report a missing page – 404 error – on the ABS site. Not good.
So here is the bottom line, be cautious with these numbers, and remember they have no statutory authority, may be contaminated with partial data, and of course the “marketing” use of the data may pull against the quest for accuracy, especially remembering Domain’s links to Fairfax and its property related businesses.
So, my conclusion is, we are without a really good chart and compass, here, just as we are with the RBA data series. More noise in the system!


 Finally, we can look at the national picture, which tells a similar story.