ACCC Report into Mortgage Pricing Includes ‘Some Surprises’

From The Adviser.

The chairman of the Australian Competition and Consumer Commission has revealed that there will be some “surprises” in the upcoming draft report into how the banks price residential mortgage products.

The inquiry into how the major banks price their mortgage is the first undertaking of the ACCC’s new Financial Sector Competition Unit, which is tasked with undertaking regular inquiries into specific competition issues across the financial sector.

Starting with the $1.2 million inquiry into residential mortgage product pricing, the ACCC is aiming to understand how the banks affected by the major bank levy explain any changes or proposed changes to fees, charges or interest rates in relation to residential mortgage products.

The inquiry relates to prices charged until 30 June 2018.

Speaking to The Adviser in May 2017, ACCC chairman Rod Sims said: “The purpose of this inquiry is to provide customers with greater understanding on how the major banks price their mortgage products and increase transparency around any changes or proposed changes to fees, charges or interest rates in relation to these products.”

In comments made to The Australian Financial Review and confirmed by the ACCC, Mr Sims noted that the commission’s draft report into mortgage pricing will be released in February or March and will contain “some surprises”.

Mr Sims said: “We were asked by the Treasurer to do an inquiry much like we are doing with gas and electricity… to get prices down and the market working as it should,” Mr Sims said.

“We will be bringing out a draft report in February or March which will provide more transparency on how the banks make their interest rate decisions and how the market structure and the level of competition in the banking sector impacts those decisions… that will be quite an important report… there are some surprises.”

While details of these surprises have not been revealed, there have been some suggestions that the banks could be passing on the cost of the government’s new major bank levy and macro-prudential measures to customers. AFG CEO David Bailey last year warned that “history suggests the big banks will undoubtedly pass this new cost on”.

Mr Bailey said: “The extent to which they are able to pass this levy on will depend on how strong our regulators are with the new supervisory powers also announced on budget night.”

The corporate watchdog has also previously warned that the big banks could be in breach of the ASIC Act over the reasons given for hiking interest rates.

However, some major bank heads, such as NAB chief executive Andrew Thorburn, have said that the major bank tax will “impact millions of everyday Australians” as any tax ”cannot be absorbed”. Likewise, Westpac CEO Brian Hartzer said that “the cost of any new tax is ultimately borne by shareholders, borrowers, depositors and employees.”

HashChing and DFA Top Eight Mortgage Predictions for 2018

Online mortgage marketplace HashChing has collaborated with research firm Digital Finance Analytics to produce the top eight mortgage predictions for 2018.

1. Mortgage interest rates are expected to continue rising. The consensus among HashChing brokers is that major banks will continue to nudge interest rates higher. HashChing broker George Kozah said the average home loan standard variable interest rate of 5.08 per cent (according to Finder.com.au) could rise approximately 75 basis points to 5.83 per cent by the end of the year.

2. Fixed rate deals to be a focus for many lenders. In 2018, there will be a greater mix of very low “special” rates to try and attract first time buyers and owner-occupied refinanced business. Many lenders will focus on fixed rate deals, taking account of lower funding rates. This may change later in the year in line with a strong likelihood that the RBA will lift the official cash rate.

3. Mortgage lending standards will continue to be tightened. This includes lower income multiples, less generous analysis of household expenses, and more conservative assessment of allowable incomes. In addition, the loan to value hurdles will be lower for many borrowers. This means that households who want to enter the market will need to be able to present with a larger deposit. “As a result, I expect more first time buyers will get help from the “Bank of Mum and Dad”, which can be worth as much as $88,000,” said Martin North, principal of Digital Finance Analytics.

4. Mortgage stress will affect more households. Last month, Digital Finance Analytics reported that mortgage stress – which is generally when a household spends more than 30 percent of its pre-tax income on home loan repayments – affected more than 921,000 households in Australia. This could climb to more than a million by the end of 2018, and Digital Finance Analytics attributes the problem to a range of issues, including rising living costs, slow wage growth, and larger mortgages (due to rising home prices).

5. More borrowers likely to refinance home loans away from the big four banks. This trend was demonstrated last year using data from HashChing which showed the greatest exodus (37 percent of national borrowers with the big four banks) from Commonwealth Bank. Smaller lenders are offering variable rate home loans as low as 3.56 per cent, and the clear savings compared to the major banks is prompting an increasing number of borrowers to jump ship.

6. Cooling property prices to continue into 2018. Tougher lending restrictions on investors and interest-only loans has increased the housing supply, leading to property prices in major cities such as Sydney and Melbourne to decline last year. The national median house price index fell to 0.3 per cent in December (according to CoreLogic data), and this trend is expected to continue in 2018. Overall, new residential construction will stay strong, as recent building approvals flow through, but there will be a fall in the number of high-rise units release to the market – especially in Melbourne and Brisbane.

7. First home buyers will make up a greater percentage of borrowers. Softening property prices, greater housing supply and government grants/stamp duty concessions (in states such as NSW, Victoria and Queensland) will see more first home buyers enter the market in 2018. In the first week of the year, HashChing has already seen a considerable uptick in web traffic, with a 12% increase in home loan enquiries from first home buyers compared to this time last year.

8. Mortgage brokers will continue to settle most residential mortgages. The latest industry data shows Australian mortgage brokers settled 55.7 percent of all residential mortgages during the September 2017 quarter, which is up from 53.6 percent in the same quarter last year. While the upcoming changes to mortgage broker commission structures (namely, the elimination of volume incentives) will result in lower lending volumes, brokers will still maintain significant share, and their overall footprint will likely continue to increase.

ANZ Job Ads Droop In December

The latest ANZ Job Ads data for December 2017, in seasonally adjusted terms, fell 2.3% largely unwinding the increase over the previous two months.

On an annual basis job ads are up 11.4%, a slight moderation from 12.0% y/y growth the previous month.

ANZ says:

The labour market in 2017 was characterised by widespread job growth (particularly in full time jobs), an increase in participation and a fall in the unemployment rate to a four-year low of 5.4%. Growth in ANZ Job Ads provided a leading signal of this strong performance.

As such, the fall in job ads in December might be a source of concern. There can be considerable volatility around this time of year, however. For this reason we are not unduly worried around the drop in December job ads. We note, for instance, that job ads fell nearly 2% in December 2016 without signalling a turn in labour market conditions. Having said this, the easing in the trend pace of job ads growth in the fourth quarter lends support to our view that we may see a slowing in employment growth over the coming months. We believe that, after 14 straight months of growth, employment has overshot the levels implied by job ads and as such a period of moderation in jobs growth is likely.

Building Approvals Rose In November 2017

The number of dwellings approved rose 0.9 per cent in November 2017, in trend terms, and has risen for 10 months, according to data released by the Australian Bureau of Statistics (ABS) today.

“Dwelling approvals have continued to rise in recent months, which has been driven by renewed strength in approvals for apartments,” said Justin Lokhorst, Director of Construction Statistics at the ABS. “Approvals for private sector houses have remained stable, with just under 10,000 houses approved in November 2017.”

Dwelling approvals increased in November in Victoria (5.6 per cent), Tasmania (3.1 per cent) and South Australia (0.1 per cent), but decreased in the Australian Capital Territory (21.9 per cent), Northern Territory (3.8 per cent), Queensland (1.2 per cent), New South Wales (0.9 per cent) and Western Australia (0.6 per cent) in trend terms.

In trend terms, approvals for private sector houses fell 0.1 per cent in November. Private sector house approvals fell in Western Australia (3.3 per cent), New South Wales (0.8 per cent) and Queensland (0.4 per cent), but rose in South Australia (1.3 per cent) and Victoria (1.1 per cent).

In seasonally adjusted terms, dwelling approvals increased by 11.7 per cent in November, driven by a rise in private dwellings excluding houses (30.6 per cent), while private house approvals fell 2.0 per cent.

The value of total building approved rose 1.5 per cent in November, in trend terms, and has risen for 11 months. The value of residential building rose 2.3 per cent while non-residential building rose 0.2 per cent.

RBA Charts Tell A Tale Of Household Woe

The latest RBA chart pack, a distillation of data to the end of the year, contains a few gems, which underscore some of the tensions in the consumer sector.

First, relative the the ultra-low cash rate, actual mortgage rates are rising – no surprise given the rise in mortgage stress we are registering.

Next, home loan approvals are on the slide – expect more of this as tighter underwriting standards bite, and many interest only borrowers are forced to switch to higher cost interest and principal loans.

Home price indices are trending lower (but still net positive growth overall at the moment). Expect more falls in the months ahead.

Household debt continues higher. Now double disposable income, and we have some of the most highly in debt households in the world. Lending growth is still three times income, so this is likely to continue higher.

All this is bearing down on household consumption as real income growth stalls. The savings ratio is falling, as households tap these to prop up their finances, OK in the short term, but unsustainable longer term.

January Consumer Confidence Higher – ANZ/RM

The Weekly ANZ/Roy Morgan, Australian Consumer Confidence Index jumped 4.7% to 122 last week, leaving it at the highest level since late 2013.

Strange considering some of the other indicators around, but then perhaps the holidays and ashes victory are colouring perspectives?  Compare and contrast our monthly Finance Security Index, published yesterday, which granted looks from a different perspective, and uses December data.

This from Business Insider.

“ANZ-Roy Morgan Australian Consumer Confidence starts the year on a high as the festive mood carries on to 2018,” said David Plank, head of Australian Economics at ANZ. “Continued strength in the labour market, and a strong performance in the Ashes series, likely helped sustain the cheer among consumers.”

“It needs to be acknowledged that consumer confidence usually rises in the first reading for January,” he says.

“Still, the increase this year is stronger than the 3.6% average lift in confidence for the past nine ‘annual turns’, indicating that the gain in confidence is more than just seasonal.

“Confidence has been trending higher since the low for 2017 in late August.”

Plank says that it’s encouraging that “consumers seemed willing to overlook their high debt burden, moderating house price gains and the impact of higher petrol prices”.

“We think the continued strong growth in employment is the key driver. We’ll find out in February when the next wages data is due whether a pick-up in wage growth has also contributed to the gain in sentiment.”

Explaining the lift in the headline index, ANZ said all five survey subindices rose last week, led by strong improvements in sentiment towards household finances and the economy.

“Consumers remained optimistic about financial conditions, which rose to the highest since early 2017. Both current and future financial conditions registered gains, rising 5.8% and 4.2% from last reported respectively,” Plank said.

“Economic prospects were also perceived to be much better. Current economic conditions rose 5.2% from last reported to 113.7, the highest since September 2013, while future economic conditions increased by 4.2% to 115.2.”

The final component within the survey — whether now was a good time to buy a household item — also rebounded, jumping 4.4%, offsetting a 1.2% fall in the final survey of 2017.

The strength in this component and the future financial conditions subindex is a good sign for household spending levels in the period ahead, helping to build confidence that the weakness seen in the September quarter last year may have reversed in recent months.


Global Rating Outlooks Most Positive Since Crisis, But…

The prospect of rating upgrades outnumbering downgrades this year and next is higher than at any time since the financial crisis, Fitch Ratings says in its latest global Credit Outlook report. But credit quality may start to weaken beyond this as ultra-supportive monetary policy is phased out and rising interest rates start to affect funding costs and asset quality.

“The rating outlook trend is the most upbeat in a decade, with positive outlooks outnumbering negatives. But the net bias is only just over 1% and occurs as the world is about to hit peak growth in the current cycle. The continued tightening of monetary policy, together with significant policy and political uncertainty, is likely to pose increasing challenges to ratings,” said Monica Insoll, Managing Director, in Fitch’s Credit Market Research team.

Global rating outlooks continue to improve. The average net outlook balance across all sectors globally turned positive for the first time since the financial crisis, at 1.1% as at 30 November 2017, up from -7.9% at the start of the year.

The trend is evident across sovereigns, corporates and financial institutions, with prospects brightening for developed and emerging markets alike. The outlook for structured finance has the most pronounced positive bias, at net 9%. Other sectors are largely experiencing rating stability, although there are pockets of rating pressure in some regions and certain subsectors.

The key drivers of the expected widespread improvement in credit quality are economic growth, still largely supportive monetary and fiscal policies, and more stable commodity prices. Fitch expects global growth to edge up to 3.3% in 2018, boosted by increased investment. However, beyond 2018 growth is likely to moderate, while monetary policy conditions will tighten.

The two main macro risks to ratings are the unwinding of quantitative easing and policy and political uncertainty, including from a heavy election cycle in emerging markets this year.

The QE unwind is likely to put pressure on sovereigns as government debt is high in many countries. Banks could be exposed to asset-quality problems following the long period of cheap credit, with high property prices in some countries at risk of deflating as the interest rate cycle turns. In the eurozone, banks will also need to rely more on market funding rather than the ECB.

In the corporate sector, emerging-markets issuer could be challenged by the reversal of capital flows but those in developed markets are likely to cope quite well. However, certain sub-sectors face rating pressure for idiosyncratic reasons, including traditional retail in the US and Europe, and utilities in the UK.

Geographic areas with negative rating outlook bias include the Middle East, Africa, China and Latin America, where several countries will hold elections this year and outcomes are uncertain.

The more positive outlook for rating activity in the short term should be seen against the backdrop of downward rating migration in several sectors in recent years. This trend has been most pronounced for sovereigns and financial institutions, with the share of ‘AAA’ to ‘A’ ratings in the latter hitting a low of 37% on 30 November 2017, having fallen steadily from 54% at end-2007.

Our six-monthly credit outlook report provides an overview of Fitch’s outlooks across all rated sectors and regions, identifying the main macro factors that will drive credit trends over the next 12-24 months. It focuses on outlook outliers – negative and positive – as the vast majority of ratings are typically stable. The data in today’s report is as of 30 November 2017.

The Fall Out From The Negative Gearing Expose

The FOI release, which the ABC covered yesterday, highlighted “the Coalition’s phoney defence of negative gearing and capital gains tax discounts before the last election”.

A number of economists at the time disputed the claims that winding back those two tax write-offs would “take a sledgehammer” to property prices because “a third of demand” would disappear from the market.

But as the excellent Rob Burgess has highlighted in the New Daily today, there are two consequential questions which need answering:

The two questions that need answering, is why were Mr Turnbull and Mr Morrison making such obviously false claims, and why were those claims not torn apart by the Canberra press gallery?

The answer to the first question is straightforward. They were either responding to an ideological commitment from the right-wing of their own party room that tax is somehow optional for asset-rich Australians, or they were following the advice of party strategists who could not see them re-winning government if wealthier Australians did not hear them loudly condemning Labor’s plans.

Historians will not doubt tell us which of those it was in years to come.

The answer to the second question is more complicated.

Journalists were not brazenly siding with the banks who had profited so much from the negatively-geared property investment mania, and they were not simply playing partisan politics in favour of a Liberal-led government.

Rather, the get-rich-quick culture of the then 16-year-old property boom, and the gradually normalised claim that tax avoidance is somehow a basic human right, has infected Canberra policy makers and fourth-estate critics alike.

That’s why in 2016 it was so refreshing to hear NSW planning minister Rob Stokes lay out the moral case against these tax write-offs.

He said at the time: “We should not be content to live in a society where it’s easy for one person to reduce their taxable contribution to schools, hospitals and other critical government services – through generous federal tax exemptions and the ownership of multiple properties – while a generation of working Australians find it increasingly difficult to buy one property to call home.”

While he told the truth, his federal colleagues were telling lies.

They lied on behalf of the 10 per cent of Australians who profit from the tax write-offs, and against the interests of the other 90 per cent.

Perhaps now that the nation’s best-equipped economic modellers have highlighted the benefits of these reforms – around $6 billion a year returned to the budget bottom line – the news media will finally call these laws out for what they are.

They are grossly unfair. They have helped pump up the Australian housing bubble. And they have redistributed tens of billions of dollars from poorer to wealthier Australians.

As interest rates start to rise around the world, and the interest-payment write-offs of property investors start to bite even harder into the federal budget, these laws need urgent reform.

A news media that vigorously holds the defenders of these laws to account would be a good start.

Who’s driving UK consumer credit growth?

From Bank Underground.

Consumer credit growth has raised concern in some quarters. This type of borrowing – which covers mainstream products such as credit cards, motor finance, personal loans and less mainstream ones such as rent-to-own agreements – has been growing at a rapid 10% a year. What’s been driving this credit growth, and how worried should policymakers be?

For many years regulators have relied on aggregated data from larger lenders to monitor which lenders and products are driving credit growth. These data are useful. But they also have important gaps. For example, they don’t include less-mainstream products that people with low incomes often rely on.

Crucially, such data do not show who is borrowing, or people’s overall debts across different lenders and products. This matters. If people borrow on many products, problems repaying one debt could rapidly spill over to others. Consumer surveys can offer some insights here. But surveys often have limited product coverage, are only available with a lag, and may suffer from misreporting.

To build a better, fuller picture of borrowing, the FCA requested credit reference agency (CRA) data for one in ten UK consumers. CRAs hold monthly data on most types of borrowing – including consumer credit, mortgages, and utilities. These data are really rich, going back six years, and can be studied at many different levels. For example, it is possible to scrutinise individual borrowing across products, or to focus on particular lenders or types of products.

We examined these data to assess possible risks from recent credit growth. This article summarises three particular insights which have emerged from this work:

  1. Credit growth has not been driven by subprime borrowers;
  2. People without mortgages have mainly driven credit growth;
  3. Consumers remain indebted for longer than product-level data implies.

Insight 1: Credit growth has not been driven by subprime borrowers

CRA data enables us to examine the distribution of credit scores among groups of borrowers. This is valuable because credit scores are excellent predictors of which types of borrowers are most likely to default or have high risks of suffering broader financial distress. A lower credit score indicates a greater risk of a person being unable to repay their debt. Those with very low credit scores are often referred to as ‘subprime’ borrowers.

In Figure 1 we show the share of outstanding consumer credit debt (net of repayments) by people’s credit scores. We divide the range of credit scores into ten buckets – the lowest bucket contains people with scores in the bottom tenth of the range (the riskiest borrowers).

Doing so reveals that a small proportion of all consumer credit debt is held by subprime consumers. There are some important differences when we compare people holding different credit products. Borrowing on credit cards with 0% offers and motor finance is concentrated among people with the highest scores. This contrasts with people borrowing on interest-bearing (non-0%) credit cards who more commonly have low scores.

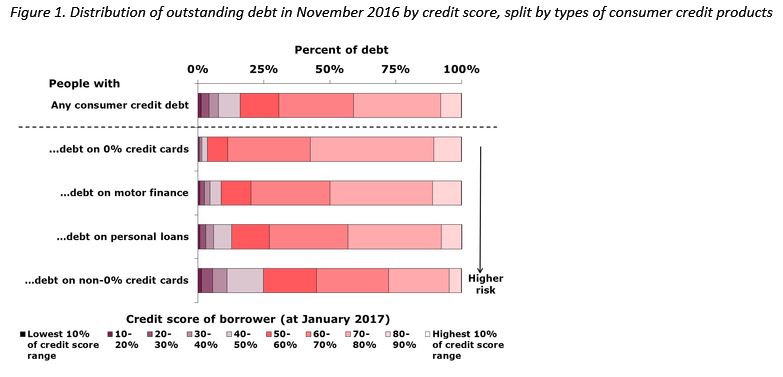
Given motor finance and 0% credit cards have accounted for a majority of consumer credit growth since 2012, this suggests much of the growth is going to the borrowers least likely to suffer financial distress. This story is consistent with high-cost credit markets used by subprime borrowers not rapidly expanding – on the contrary, some are contracting.

In Figure 2, we turn to how the distribution of borrowing has changed over time. Here we find little difference in credit scores over the recent period of rapid credit growth. This holds when looking at both the outstanding stock and the flow of new borrowing. At face value, this indicates that lenders have not dramatically relaxed their lending standards. But observing a similar credit score distribution when the macroeconomic environment has slightly improved may be better interpreted as a deterioration. The only product where we find an increased concentration of subprime borrowing is interest-bearing credit cards.

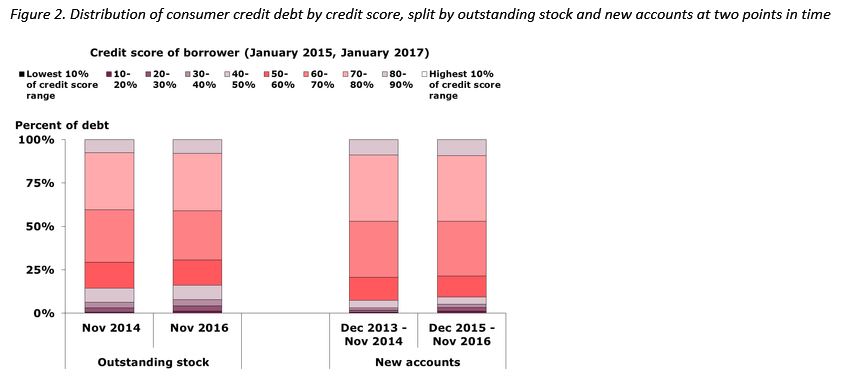
History also offers some caution on the relative importance of subprime lending. Recent research on the US mortgage crisis found the pre-crisis growth of subprime borrowing was less dramatic and important to explaining the crisis than earlier studies implied.

Insight 2: People without mortgages have mainly driven credit growth

The recent credit growth has followed a tightening of mortgage lending requirements. Did this tightening have the unintended side-effect of turning mortgage borrowers away from extracting home equity and instead towards consumer credit?

We assess the interaction between these two markets by splitting the growth and stock in borrowing between mortgagors and non-mortgagors. This is shown in Figure 3. About half of outstanding consumer credit is held by those with mortgages. However, this group accounts for a minority of growth in credit balances, with 60% of the growth in credit balances coming from non-mortgagors.

It is comforting that mortgagors do not appear to be bypassing tighter mortgage regulation by amassing consumer credit debt. But a key question going forward is how much of the growth is coming from renters and how much from outright owners.

We know that renters tend to spend a higher share of their income on housing than mortgagors, and so may have less income available for debt repayments. Rapid increases in indebtedness among renters could therefore be a vulnerability.

It is also possible that outright owners are taking out credit, even if they don’t need it. Survey data suggest around 40% of households with consumer credit debt hold savings in excess of such debt. If driven by outright owners, rapid credit growth among non-mortgagors may be less worrying.

Insight 3: Consumers remain indebted for longer than product-level data implies

The Bank has previously argued that lenders’ consumer credit portfolios turn over relatively quickly, reflecting the short terms of consumer credit products (relative to mortgages). In theory, this rapid turnover means that the prudential risks from outstanding consumer credit could quickly increase (or decrease) if lending standards were to deteriorate (or improve).

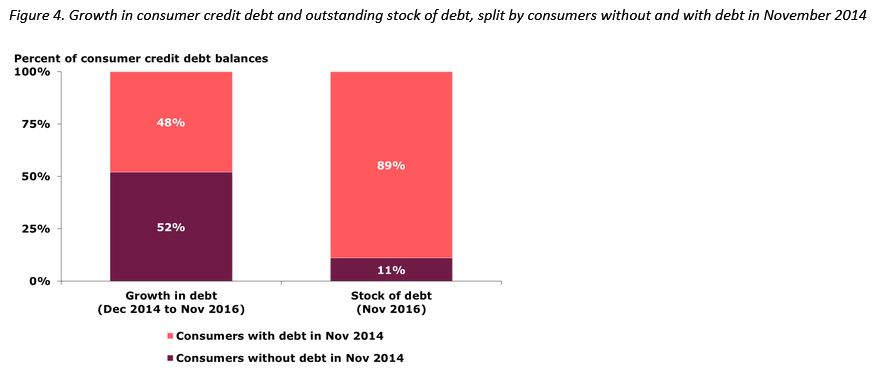
While this may hold from a lender perspective, our analysis tells a different story from consumers’ perspective. We find that although a consumer may clear their debt on one credit product, it is not uncommon for them to remain in debt as they transfer balances, take out new credit products or draw down on existing credit lines (such as credit cards). As shown in Figure 4, 89% of the total outstanding stock of debt in November 2016 was held by people who also owed debt two years earlier. While approximately half of new borrowing is due to ‘new’ borrowers, these people are typically only able to access relatively small amounts of credit and therefore account for a small proportion of the overall stock of debt.

An implication of these findings is that regulators should not become too relaxed when they observe improvements in specific products at particular lenders. Unless the borrower population significantly changes, it is possible that the risk of consumer harm will simply be shifting from one part of the market to another rather than reducing. It is therefore important to regularly examine the financial health of people and their debts holistically using CRA (or similar) data.

Should policymakers be worried?

Credit growth not being disproportionately driven by subprime borrowers is reassuring. As is the lack of evidence that mortgage lending restrictions are pushing mortgagors towards taking on consumer credit.

But vulnerabilities remain. Consumers remain indebted for longer than previously thought. And renters with squeezed finances may be an increasingly important (and vulnerable) driver of growth in consumer credit.

Bank Underground is a blog for Bank of England staff to share views that challenge – or support – prevailing policy orthodoxies. The views expressed here are those of the authors, and are not necessarily those of the Bank of England, or its policy committees.

More Evidence of Poor Mortgage Lending Practice

The Australian Financial Review is reporting that New ‘liar loans’ data reveal borrowers more stretched than some lenders suspect.

One in five property borrowers are exaggerating their income and nearly half understating their spending, triggering new concerns about underwriting standards and vulnerability to sharp economic corrections, according to new analysis of loan applications by online property lender Tic:Toc Home Loans.

The number of ‘liar loans’ exceeds original estimates by investment bank UBS that last year found about 30 per cent of home loans, or $500 billion worth of loans could be affected.

Tic:Toc Home Loans’ founder and chief executive, Anthony Baum, said loan applications are representative of larger lenders in terms of location, borrower and loan size, which range from about $60,000 to $1.3 million.

Mr Baum, a senior banker for nearly 30 years, said in many cases applicants did not have to over-state their income for the required loan.

“Our portfolio looks like other organisations,” he said.

Analysis of their applications reveals about 20 per cent overstate their income, typically by about 30 per cent, and 50 per cent state their expenses are lower than the Household Expenditure Measure, also by about 30 per cent.

Property market experts claim the latest analysis, although based on a smaller sample than UBS’s survey, are credible and consistent with independent analysis of the lending standards.

“They do not surprise me,” said Richard Holden, professor economics at University of NSW Business School, who argues the potential problems are compounded by more than one-in-three loans being interest only.

Martin North, principal of Digital Finance Analytics, an independent consultancy, also backed the latest ‘liar loan’ numbers.

Mr North said standards had slipped because of lenders’ readiness to “jump over backwards” to increase business and commission incentives for mortgage brokers rewarding bigger loans.

“Not all lenders are the same but these numbers do not surprise me at all,” he said.

Mr North said there was strong evidence that salaries are overstated by between 15 and 20 per cent by borrowers using a range of tactics, such as over-stating bonuses or, for variable income earners, using peak rather than average income.