AMP Reports Strong Profit Growth

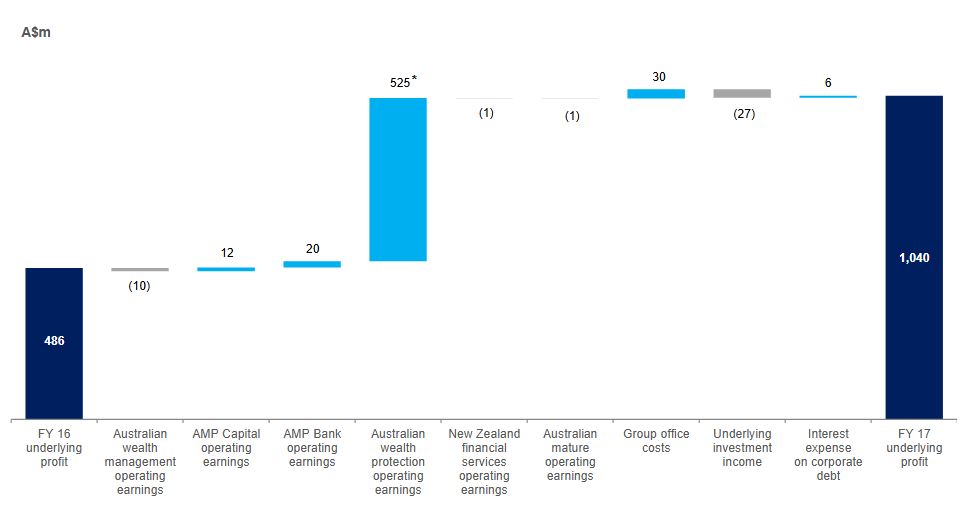
AMP released their FY17 results, and overall the business has improved results compared with last year.  Underlying profit was $1,040 million compared with $486 million last year.  Margin in the AMP Bank rose 3 basis points to 1.70%. Note that in FY 16 Australian wealth protection reported $415 million loss, following strengthening of best estimate assumptions. So the like for like comparison is difficult.

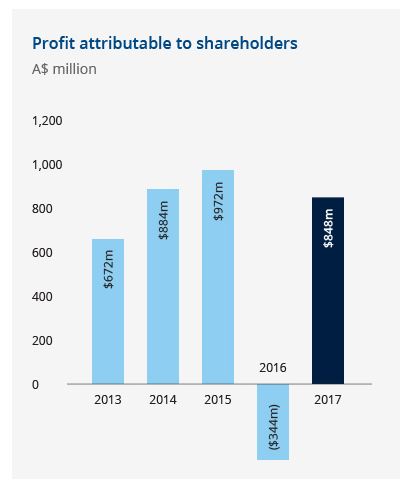
Net profit was $848 million compared with FY 16: -A$344 million.

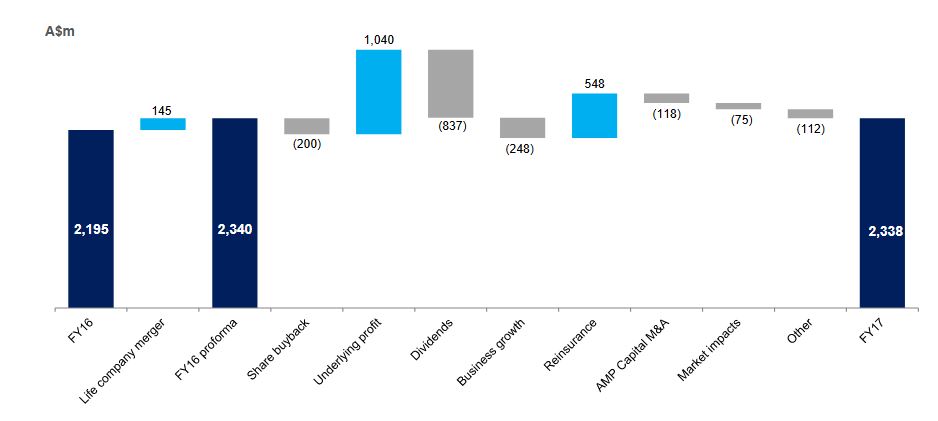
AMP’s capital position remains strong, with level 3 eligible capital resources $2,338 million above minimum regulatory requirements at 31 December 2017, up from $2,195 million at 31 December 2016.

The capital position was strengthened by the second reinsurance program announced at 1H 17. Potential for capital management initiatives will be considered at the conclusion of the portfolio review of AMP’s manage for value businesses. AMP expects to provide a further update at or before its AGM.

The final dividend has been maintained at 14.5 cents a share, franked at 90 per cent. The total FY 17 dividend is 29 cents a share and is within AMP’s stated target range of 70 to 90 per cent of underlying profit.

In 2017, AMP announced a strategy to manage its Australian wealth protection, New Zealand and Mature businesses for value and capital efficiency. The completion of a comprehensive reinsurance program of Australian wealth protection, released circa A$1 billion in capital to the group. Disciplined cost management has driven efficiency in New Zealand and Mature.   To continue to realise value from these businesses, AMP is well progressed with a portfolio review with all alternatives being considered. As a result, AMP is in discussions with a number of interested parties. While the portfolio review is yet to be concluded, AMP expects to provide a further update at or before its AGM.

Here are the business unit splits.

Australian wealth management     

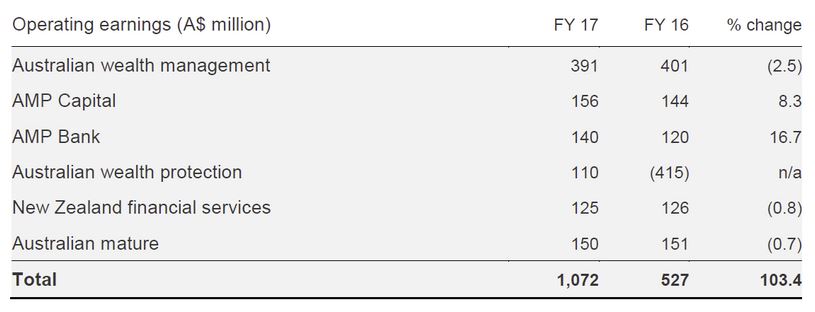
Australian wealth management delivered a resilient performance during a period of high margin compression due to final transitions to MySuper. Operating earnings were 2.5 per cent lower at A$391 million. However, strong growth in net cashflows and 10 per cent growth in other revenue from Advice and SMSF demonstrates the underlying growth trajectory of the business.

Net cashflows increased 177 per cent on FY 16 to A$931 million, reflecting significant inflows from discretionary super contributions ahead of 1 July 2017 changes to non-concessional caps. The competitive strength of AMP’s corporate super platform also supported inflows, up A$436 million on FY 16 to A$717 million, with several mandate wins.

North, AMP’s flagship wrap platform, continued to perform with net flows of A$5.7 billion, up 14 per cent on FY 16 and up 28 per cent excluding a one-off significant transfer that occurred in FY 16. Assets under management rose 29 per cent to A$34.9 billion over the same period.

In 2017, AMP paid A$2.5 billion in pensions to support customers in their retirement.

AMP Capital

AMP Capital external net cashflows increased significantly to A$5.5 billion (FY 16: A$967 million), the highest since the establishment of AMP Capital in 2003. Cashflows reflect strong international investor interest in AMP Capital’s fixed income, real estate and infrastructure capabilities. External assets under management fees rose by 6 per cent to A$266 million.

Operating earnings increased 8 per cent on FY 16 to A$156 million driven by growth in fee income and particularly in real assets. Controllable costs increased 5 per cent reflecting investment in real asset capabilities, growth initiatives and international expansion. AMP Capital’s cost to income ratio of 61.5 per cent remains within the full-year target of 60 – 65 per cent.

Direct international institutional clients grew 46 per cent to 291 over the year, with AMP Capital managing A$12 billion in assets on their behalf. During the period, AMP Capital established a partnership with, and purchased a minority stake in, US real estate investor, PCCP. The partnership brings together AMP Capital’s Asian distribution capability with PCCP’s US-based investment expertise.

China Life AMP Asset Management[4] (CLAMP) continues to grow rapidly with AUM increasing 59 per cent to RMB 183.3 billion (A$36 billion) in FY 17, supported by the launch of 25 new products including diversified, equity and fixed income funds. Total AUM for China Life Pension Company, the pensions joint venture in which AMP owns a 19.99 per cent stake, grew 41 per cent to RMB 531 billion (A$104.3 billion).

At 31 December 2017, AMP Capital had A$4.2 billion of committed real asset capital available for investment, up A$700m from 30 June 2017. AMP Capital invested A$5.6 billion in new infrastructure and real estate assets in 2017.

AMP Bank

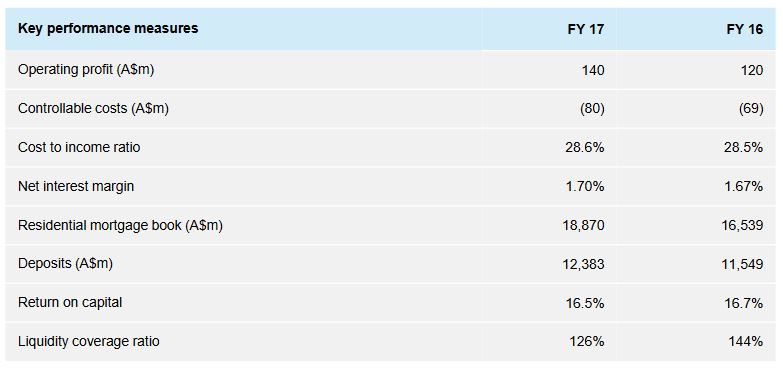
AMP Bank operating earnings rose 17 per cent to A$140 million (FY 16: A$120 million). Performance was driven by a 14 per cent rise in residential lending to A$18.9 billion underpinned by a conservative credit policy. As expected, loan growth moderated in 2H 17 as the market adjusted to new regulatory requirements.

Controllable costs increased in FY 17, reflecting investment in people and technology to support growth, however, the cost to income ratio remained almost flat at 28.6 per cent (FY 16: 28.5 per cent).

Australian wealth protection

Performance in wealth protection stabilised following strengthening of best estimate assumptions and completion of a comprehensive reinsurance program, which occurred in FY 17, effectively reinsuring 65 per cent of AMP’s retail life insurance portfolio. Operating earnings improved to A$110 million in FY 17, with experience largely in line with expectations. Profit margins decreased on FY 16 to A$99 million reflecting the assumption changes and reinsurance program. Focus remains on running an efficient and competitive business while maintaining high levels of customer service. In 2017, AMP paid A$1.1 billion in claims to support customers during their time of need.

New Zealand financial services

Operating earnings, down 1 per cent to A$125 million, reflect the depreciation of the New Zealand dollar relative to the Australian dollar. In NZ$ terms, operating earnings increased 1 per cent to NZ$135 million, driven by higher profit margins and disciplined focus on cost control. AMP New Zealand financial services continues to hold market-leading positions in wealth protection and wealth management, in addition to being one of the largest KiwiSaver providers with NZ$5.1 billion in AUM, an increase of 16 per cent on FY 16.

Australian mature

Operating earnings of A$150 million reflect expected portfolio run-off offset by improved investment markets and favourable annuity experience.

Labor’s 2% cap on private health insurance premium rises won’t fix affordability

From The Conversation.

This week, Opposition Leader Bill Shorten announced a new private health insurance policy the Labor Party will take to the next election. First, Labor will get the Productivity Commission to conduct a full review of the private health insurance system. Second, and more controversially, Shorten promised a short-term 2% cap on premium increases for two years.

The promised cap is in response to consistently high premium increases of around 5% in recent years. In justifying the policy, Shorten said:

… the idea these big insurers are making record profits and yet the premiums keep going up and up, it can’t be sustained.

This announcement has already been greeted with scepticism and fury from the health insurance industry, with industry body Private Healthcare Australia branding the proposal “disastrous”.

As the proposal explicitly targets their profit margins, their response is predictable. However, in this case, they are right to complain. The premium cap policy is a crude measure that is unlikely to improve long-term affordability and may further distort the market in the short term.

Unintended consequences

Price controls introduced by governments usually have good intentions, but often have unintended consequences.

Consider, for example, the proposal to introduce caps on rent increases in the United Kingdom. Rent controls are among the most well-understood policies in economics: they reduce the quality and quantity of housing, leaving renters facing long search times to find housing and poorly maintained properties.

In health insurance, the most likely immediate response to the cap would be for insurers to increase the amount of exclusions – procedures and treatments that aren’t funded – and co-payments associated with policies.

So, while prices are kept low by the cap, consumers are effectively getting less coverage for their money. This would enable insurers to maintain their profit margins, but produce no gain, and further confusion, for consumers.

We already know the number of policies with exclusions, such as hip replacements and childbirth, has grown substantially. Labor’s proposal will probably accelerate the trend.

Long-term pain

Alternatively, as this proposed cap is time-limited, insurers may just put up with the pain of lower margins for a couple of years, with the timeline too short for significant changes to exclusions.

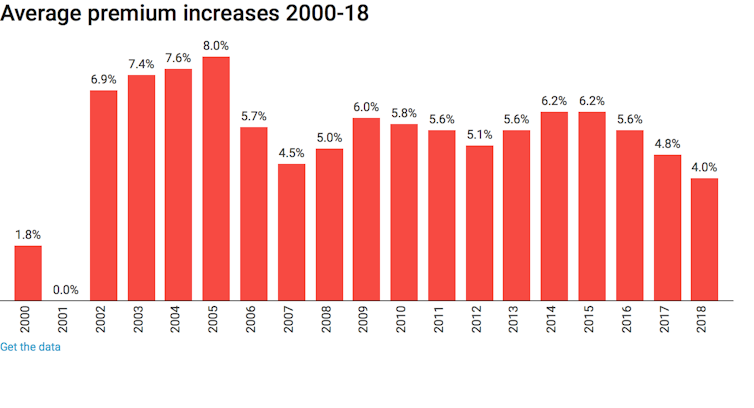
However, there may still be negative long-term impacts. We can look back in history for a clue about the long-term effects of a temporary cap on premiums. In 2000 and 2001, the Howard government implemented an effective “freeze” on private health insurance premium increases.

As can be seen in the graph, average premium increases were below 2% in 2000 (the largest insurer, Medibank Private, had a 0% increase in 2000), and were zero in 2001.

Average private health insurance premium increases in Australia from 2000 to 2018. Author

While consumers in 2000 and 2001 may have gained from lower real-terms premiums, we can see the long-term effects in the years from 2002 to 2005, when premium increases were between 7 and 8%. This is clearly an attempt by health insurance companies to “catch up” on the increases they missed in 2000 and 2001.

So, we may expect history to repeat itself if Labor wins the next election and introduces this policy: premiums will just rise faster in the years following the cap, negating any short-term benefit to consumers.

Why costs are rising

The proposed Productivity Commission review is much more promising in tackling important issues in the market, including lack of competition, confusing exclusions in policies, and its interaction with public funding through Medicare and public hospitals.

However, there is no solution to premium rises way in excess of general inflation if recent trends in healthcare technology and use continue. The number of hospital visits funded by private health insurance is growing strongly, at an average of 5.5% per year over the past five years.

Growth is across all areas of health care, from elective surgery like cataracts (4.9% a year) and hip replacement (5.5% a year) to diagnostic procedures such as endoscopy (4.4% a year) and life-saving cancer treatments like chemotherapy (5.5% a year).

We are paying more for our health insurance because we are using it more. No crude, short-term measures to restrict premium growth will deal with this fact. And good luck to the Productivity Commission in trying to reverse a global trend for higher private health care expenditure.

Author: Peter Sivey, Associate Professor, School of Economics, Finance and Marketing, RMIT University

Financial Stress is Increasing in Australia as Cost of Living Pressures Mount

After the ME Bank Survey, and our Household Finance Confidence Index both showed the financial pain many households are in; now National Australia Bank’s (NAB) latest Consumer Behaviour Survey, shows the degree of anxiety being caused by not only cost of living pressures but also health, job security, retirement funding as well as Australian politics.

From NAB and Business Insider.

Of all the things bothering Australian households in early 2018, nothing surpasses cost of living pressures.

Source: NAB

From the National Australia Bank’s (NAB) latest Consumer Behaviour Survey, it shows the degree of anxiety being caused by not only cost of living pressures but also health, job security, retirement funding as well as Australian politics.

The higher the reading, the more anxious it is making Australians.

Somewhat surprisingly, it was not the gaggle in Canberra that caused the most anxiety for households in the latest survey, but rather persistent concerns surrounding living expenses.

“[The index] was basically unchanged in Q4 2017 at near survey lows with job security causing Australians the least stress, consistent with a strongly improving labour market,” said Alan Oster, NAB Group Chief Economist.

“That said, the cost of living is still weighing most heavily on them, highlighting the disconnect between low levels of economy-wide inflation and consumer focused costs.”

That was reflected in the detail of the latest survey, revealing some alarming statistics as to just how many Australians are struggling at present.

It found around two in five Australians suffered some form of financial hardship over the survey period, especially among lower-income earners.

Over 50% of low income earners reported some form of hardship, with almost one in two 18 to 49-year-olds being effected.

As seen in the chart below, after a steady improvement in late 2016 and early 2017, those reporting financial hardship have increased in recent quarters, coinciding with steep increases in gas and electricity charges for many Australian households.

Source: NAB

“Being unable to pay a bill was the most common cause,” the NAB said, adding this came in at over 20%.

“Not having enough for food and basic necessities was next, impacting one in three low income earners.”

Some 18% of respondents reported not having enough for food and basic necessities in the latest survey.

Source: NAB

Nearly half of those consumers also reported they were “extremely” concerned about their current financial position, nominating paying their utility bills as the biggest impact on their financial position.

Source: NAB

“While consumers told us they were a little less concerned about their household’s current financial position in Q4, being unable to pay a bill — particularly utilities — continues to have by far the biggest impact on those households most concerned about their finances,” Oster said.

With cost of living pressures still creating anxiety among households, the NAB asked respondents how much extra income they would need to alleviate those concerns.

In short, a lot, especially for those in the big capital cities and households with children.

“On average, consumers told us they need an extra $207 a week – or $10,764 per year,” Oster said, adding that “this varied according to where we live, our income, gender and family status”.

“It ranged from $221 in New South Wales and the ACT to $132 in Tasmania, and from $214 in capital cities to $186 in rural areas.

“Consumers with children need $258 and those without $191”.

Source: NAB


While Oster admits that how consumers “feel” doesn’t necessarily correlate with how they really spend, it underlines the point that many Australians think they’re getting squeezed financially.

If it wasn’t already apparent, this likely ensure the next federal election campaign will be centred around alleviating the perceived cost of living pressures facing many Australian households.

7:30 Does Interest Only Loans Problem

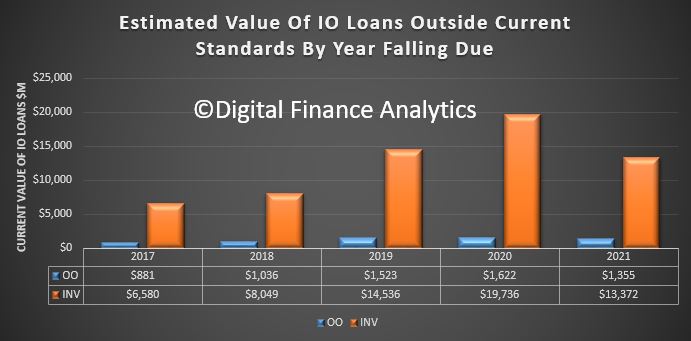
A segment on ABC 7:30 discussed the problem faced by many interest only mortgage holders as tighter lending standards bite, forcing some to higher payment P&I loans or to sell.

We discussed this issue some time back, and made an estimation that $60 billion of such loans are likely to fall foul of the tightening.


COBA Welcomes Bipartisan Approach to BEAR

COBA has welcomed the bipartisan approach taken in Federal Parliament to give small and medium banking institutions more time to prepare for the Banking Executive Accountability Regime (BEAR).

Amendments to the Bill moved by the Opposition in the House were supported by the Government and the amended Bill has now passed the Senate. Small and medium banking institutions have until 1 July 2019 to prepare for the BEAR. It will commence for the major banks on 1 July 2018.

“It’s very pleasing that the Government and the Opposition recognise the importance of customer owned banking and the vital role it plays in delivering diversity and competition in retail banking,” COBA CEO Michael Lawrence said.

“To promote a more competitive banking market, it is critically important to minimise regulatory costs on smaller banking institutions.

“Customers ultimately bear the cost of regulatory compliance.

“MPs have also recognised that the regulatory compliance burden is effectively a competitive advantage for the major banks. This is because major banks have vastly greater resources than their smaller competitors to quickly respond to new regulatory obligations.

“More time for small and medium banking institutions to prepare for the BEAR in an orderly way will reduce the cost burden that would otherwise apply.

“I congratulate the Government and the Opposition on this outcome.”

Westpac remediates credit card customers more than $11 million

ASIC says Westpac has provided around $11.3 million in remediation to around 3,400 credit card customers after ASIC raised concerns about its credit card limit increase practices.

In 2016, ASIC announced that Westpac had agreed to improve its lending practices when providing credit card limit increases to customers to ensure that reasonable inquiries are made about customers’ income and employment status (refer: 16-009MR).

As part of Westpac’s commitment, it reviewed credit limit increases previously provided to affected cardholders where they subsequently experienced financial difficulty. Following this review, Westpac provided remediation to around 3,400 customers, which included refunds of around $3 million for fees and interest, and around $8.3 million in credit card balances waived.

Westpac engaged an independent expert to provide assurance over the remediation program and has made the first two payments (of the $1 million total contribution) to support financial counselling and financial literacy, with further payments to follow in 2018 and 2019.

Background

In 2014 ASIC conducted a review focussing on credit card providers’ invitations to customers to increase credit card limits. ASIC’s concerns with Westpac’s processes were identified through the course of this review.

The Government has introduced reforms into Parliament that will prohibit credit card providers from sending credit card limit increase invitations regardless of whether the consumer has provided their consent.

The Government’s reforms will also require credit card providers to assess whether a credit card limit might be unsuitable based on the consumer’s ability to repay the proposed credit limit within a period prescribed by ASIC, rather than the consumer’s ability to meet the minimum repayment.

ANZ refunds $10 million for failing to disclose credit card charges

ASIC says the ANZ bank will refund $10.2 million to 52,135 business credit card accounts, after it failed to properly disclose fees and interest charges for the product.

ANZ reported to ASIC that for some of their ‘Business One’ business credit card customers they either failed to disclose, or incorrectly disclosed (in some cases from as early as 2009):

  • Applicable interest rates
  • The interest-free period
  • The annual fee
  • When an overseas transaction fee might apply
  • The amount payable for overseas transactions with foreign merchants or financial institutions.

ANZ has contacted eligible customers to advise they will receive a refund with interest.  Former customers will receive a bank cheque and current customers with an open account will receive a refund paid into their account.

ANZ has since updated its procedures and fee information for Business One.

Customers with queries or concerns about this matter should contact ANZ on 1800 032 481.

Background

No consumer credit card accounts have been impacted by this matter.

Many of the ‘Business One’ credit card customers were small businesses. In 2017 ASIC launched a small business strategy to assist, engage and protect small businesses.

ASIC acknowledges the cooperative approach taken by ANZ in its handling and reporting of this matter.

Genworth 2017 Results Down 26.5%

Genworth Mortgage Insurance Australia Limited reported its 2017 full year (FY17) financial results.  As a major player in the LMI sector, we get an insight into the overall market. Today’s Productivity Commission report of course highlights that LMI’s should refund unused premiums. This could impact the market further, but for now, as LVR’s fall, LMI’s need to tweak their business models. Meantime, new business is falling, though claims also eased a little.

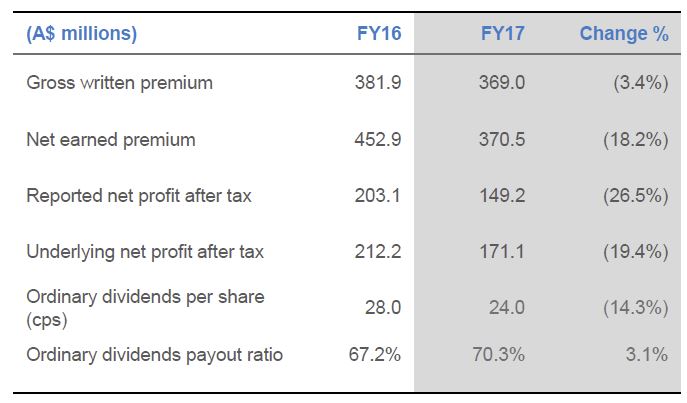
Statutory  net profit after tax (NPAT) for the year ended 31 December 2017 was $149.2 million compared with $203.1 last year, down 26.5% and underlying NPAT was $171.1 million down 19.4%. This was in line with guidance.

The Genworth Board declared a fully franked final ordinary dividend of 12 cents per share payable on 16 March 2018 to shareholders registered on 2 March 2018. The total ordinary dividend for 2017 was 24 cents per share and represents a payout ratio of 70.3%, up from 67.2% in 2016.

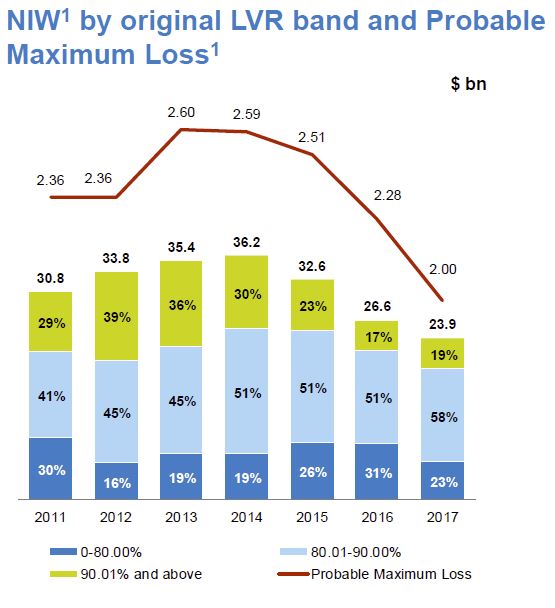
New business volume, as measured by New Insurance Written (NIW), of $23.9 billion in 2017, decreased 10.2% compared with $26.6 billion in the prior year.

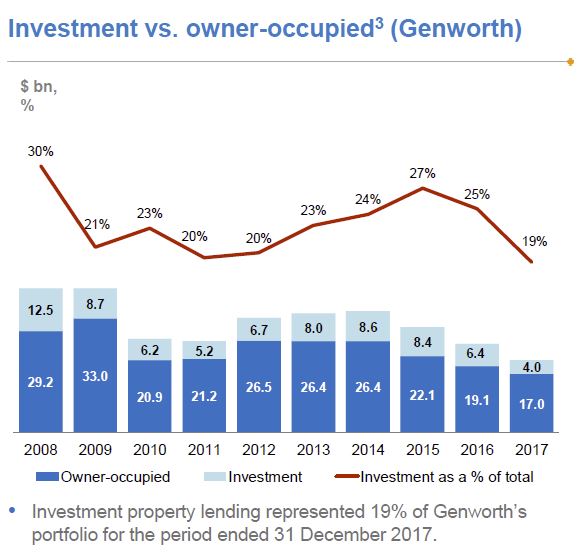
The mix of business is aligned to owner occupied borrowers, with 19% of loans in 2017 for investment purposes.

Gross Written Premium (GWP) decreased 3.4% to $369.0 million in 2017. This decline was partially offset by the impact of the premium rate actions taken in 2016 and reflects changes in the customer portfolio and changes in business mix during the year.

Net Earned Premium (NEP) of $370.5 million in 2017 decreased 18.2% compared with $452.9 million in the prior year reflecting the $37.3 million impact of the 2017 Earnings Curve Review and lower earned premium from current and prior book years. Without the 2017 Earnings Curve Review adjustment, NEP would have declined 10.0%.

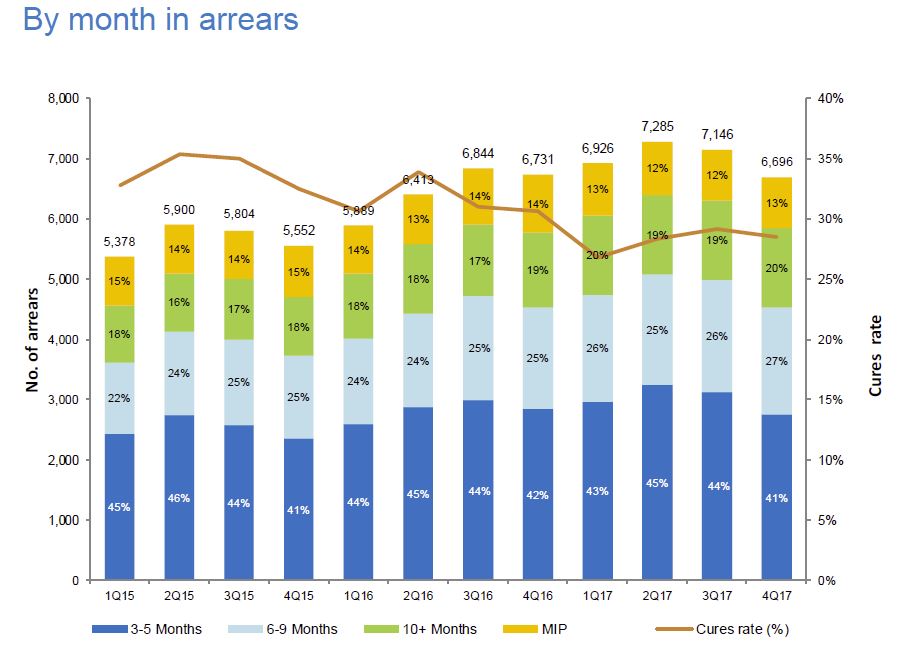
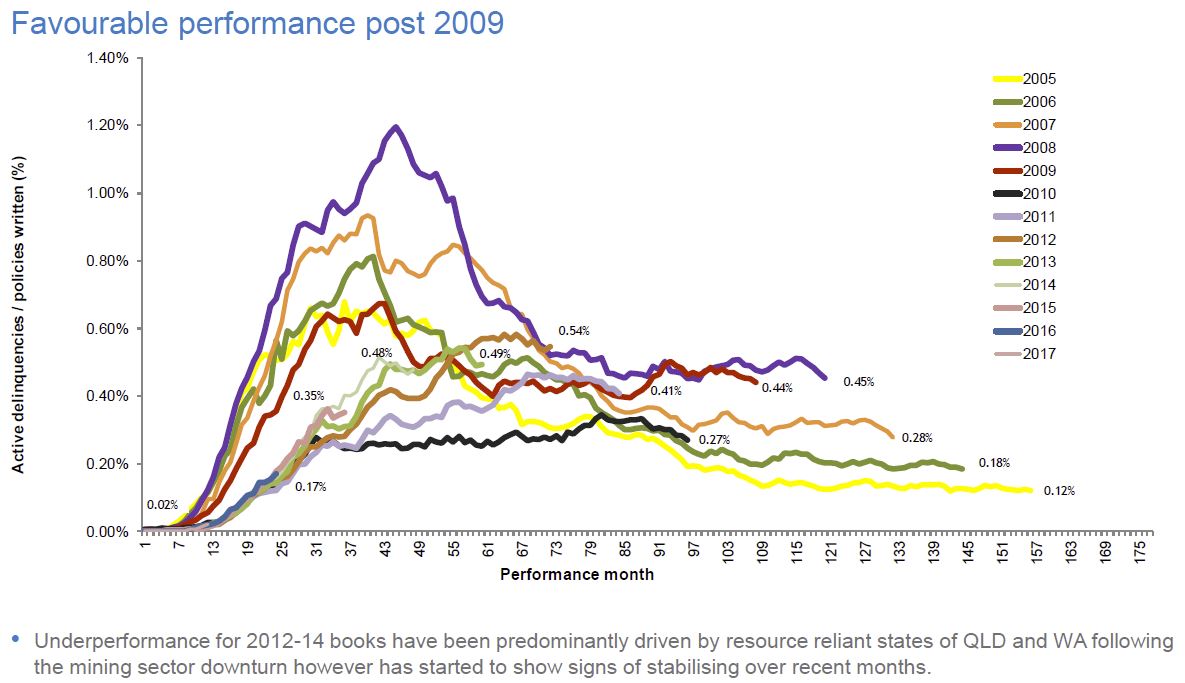
New delinquencies decreased in both mining and non-mining areas. The proportion of new mining delinquencies has been increasing in Western Australia while Queensland mining experience has been quite stable. Cures increased, particularly in non-mining areas. The number of claims paid in FY17 was higher than FY16, mainly driven by a higher proportion of claims in mining areas.

Net Claims incurred fell 10.7% from $158.8 million in FY16 to $141.8 million in FY17. The loss ratio in FY17 was 38.3%, up from 35.1% in FY16 reflecting the impact of lower NEP due to the 2017 Earnings Curve Review. Without this adjustment the FY17 loss ratio would have been 34.8%.

The expense ratio in FY17 was 29.3% compared with 25.7% in the prior year, reflecting the lower NEP and expenditure on the Strategic Program of Work. This is in line with the expected target range of between 28% and 30%.
Investment income in FY17 was $103.3 million and included a pre-tax realised gain of $36.4 million ($25.5 million after tax) and a mark-to-market loss of $31.3 million ($21.9 million after-tax). After adjusting for the mark-to-market movements, the FY17 investment return was 2.82% per annum, down from 3.41% per annum in FY16.

As at 31 December 2017, the value of Genworth’s investment portfolio was $3.4 billion, more than 86% of which continues to be held in cash and highly rated fixed interest securities. The Company had invested $237.4 million in Australian equities as at year-end in line with the previously stated strategy to improve investment returns on the portfolio within acceptable risk tolerances. In 2017, the Board approved a strategy to diversify the Company’s assets by investing in non-AUD fixed income securities. This will be implemented in 2018.

As at 31 December 2017 Genworth’s regulatory solvency ratio was 1.93 times the Prescribed Capital Amount (PCA) which is above the Board’s target capital range of 1.32 to 1.44 times.

Throughout the year the Company embarked on a number of capital management initiatives designed to bring Genworth’s solvency ratio more in line with the Board’s target range. A fully franked special dividend of 2 cents per share and fully franked ordinary dividends totalling 24 cents per share were declared by the Board. This equates to a yield of 8.7% based on the share price of $3.00 as at 31 December 2017.

In 2017 the Company also commenced an on-market share buy-back up to a maximum value of $100 million. As at 31 December 2017, $51 million of shares had been acquired as part of this initiative. Genworth intends to continue the buy-back of shares in 2018, up to a maximum total value of $100 million, subject to business and market conditions, the prevailing share price, market volumes and other considerations.

The Company will continue to actively manage its capital position and proactively evaluate potential uses for its excess capital.

Genworth has commercial relationships with over 100 lender customers across Australia and Supply and Service Contracts with 10 of its key customers. Our top three customers accounted for approximately 60% of our total NIW and 72.7% of GWP in 2017. We estimate that we had approximately 25% of the Australian LMI market by NIW in 2017.

On 10 March 2017 Genworth announced that the exclusivity agreement for the provision of LMI with its then second largest customer would terminate in April 2017. The Company has been successful in entering into new business with this customer that assists them in managing mortgage default risk through alternative insurance arrangements.

On 20 September 2017 Genworth announced that it had extended its Supply and Service Contract with National Australia Bank (NAB) for the provision of LMI for NAB’s broker business. The term of the contract has been extended for one year to 20 November 2018.

The Company’s Strategic Program of Work is designed to address evolving lender and consumer expectations (resulting from technological and regulatory change) by leveraging Genworth’s existing core competencies in managing mortgage credit default risk.

As part of this work program a number of initiatives have been identified that focus on improving the Company’s underwriting efficiency, enhancing its product offerings and, where appropriate, leveraging its data and mortgage partnerships along the mortgage value chain.

One such initiative has involved the establishment of an offshore insurance entity based in Bermuda, which provides Genworth with the capability to structure bespoke risk management solutions for portfolio cover across both high and low loan to value ratios (LVR). By leveraging its strong relationships in the global reinsurance market, Genworth has created a consortium and entered into an agreement with a customer to utilise the new structure to manage mortgage default risk. This bespoke solution is a complementary risk management tool to traditional LMI cover.

The second half of 2017 also saw the culmination of work undertaken by Genworth to create and implement risk management solutions for borrower-paid LMI in the less than 80% LVR segment on a micro market basis (Micro Market LMI).


CBA 1H18 Results – A Mixed Bag

The Commonwealth bank has released their 1H18 results today. Overall a mixed bag, but the contribution from home loan repricing was significant, as were the various adjustments relating to AUSTRAC and other reviews. The impact of the reduction in ATM fees, the bank levy and changes to interchange fees all hit home.  Institutional Banking is under some pressure, so they rely on the retail bank to support the overall result.  This is a essay in complexity!

On a ‘continuing operations’ basis, the Group’s statutory net profit after tax (NPAT) for the half year ended 31 December 2017 was $4,895 million, which represents a 1 percent increase on the prior comparative period. This is below expectations.

Cash NPAT was $4,735 million, a decrease of 2 percent. Return on equity (cash basis) was 14.5 percent. Discontinued operations include the Group’s life insurance businesses in Australia and New Zealand.
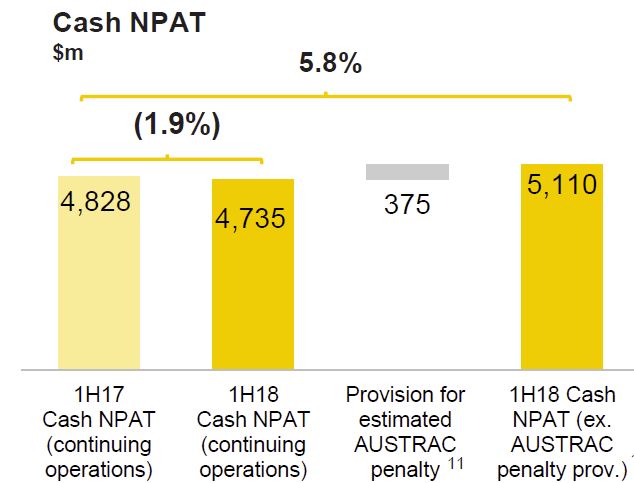
Underlying operating income increased 4.9%, due mainly to higher net interest income which was up 6.2%. Lending volumes were up 3.5% . Other banking income was flat. Higher structured asset finance income and lending fees were offset by lower trading income in the institutional business reflecting reduced market volatility and by lower interchange rates and ATM fees in the retail bank.. Strong investment markets drove funds management income. This was partly offset by lower general insurance income which was impacted by higher claims due to weather events. Underlying operating expenses increased 4.7% to $5,318m, driven by a $200m expense provision for expected regulatory, compliance and remediation program costs.
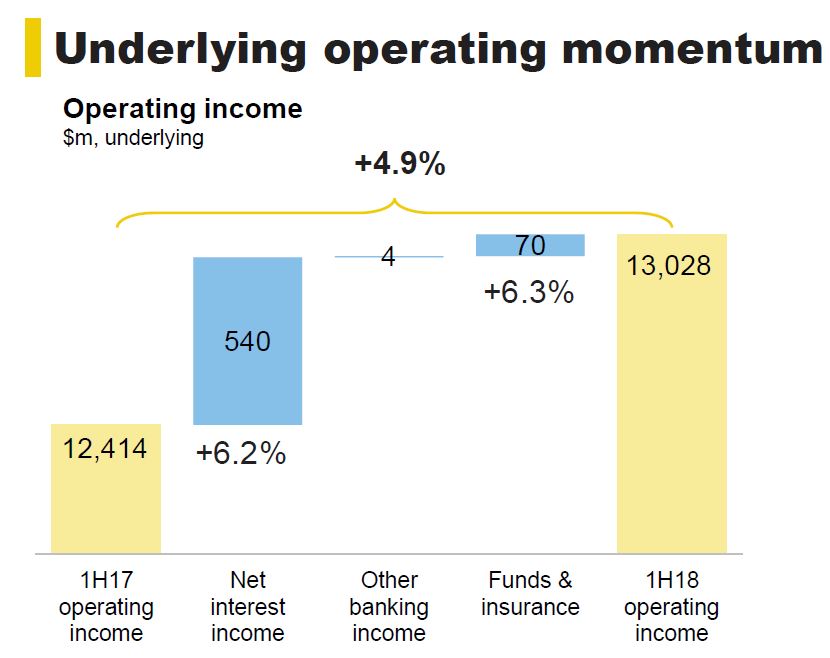
The underlying cost-to-income ratio reduced a further 10 basis points to 40.8%.

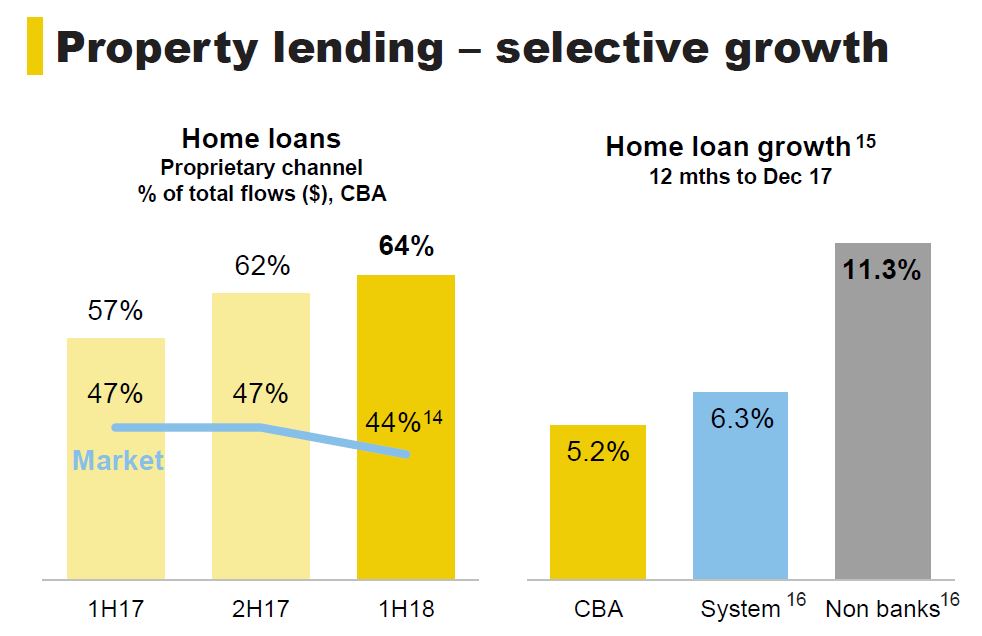
CBA has been selective in its home loan growth, with more new loans via proprietary channels, and lower volumes of investor loans than the market.
There was a 6 basis point uplift in net interest margin to 2.16% (and a lift of more than 10 basis points in Australian Retail Banking, thanks to the mortgage book repricing).

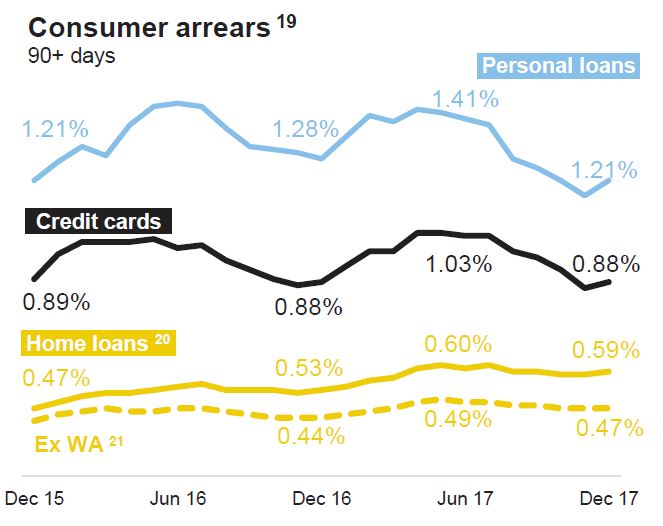
Consumer arrears look contained, though WA home loans still above the average.
The Board determined an interim dividend of $2.00 per share, a 1 cent increase on the 2017 interim dividend.

The interim dividend, which will be fully franked, will be paid on 28 March 2018 with the ex-dividend date being 14 February 2018.

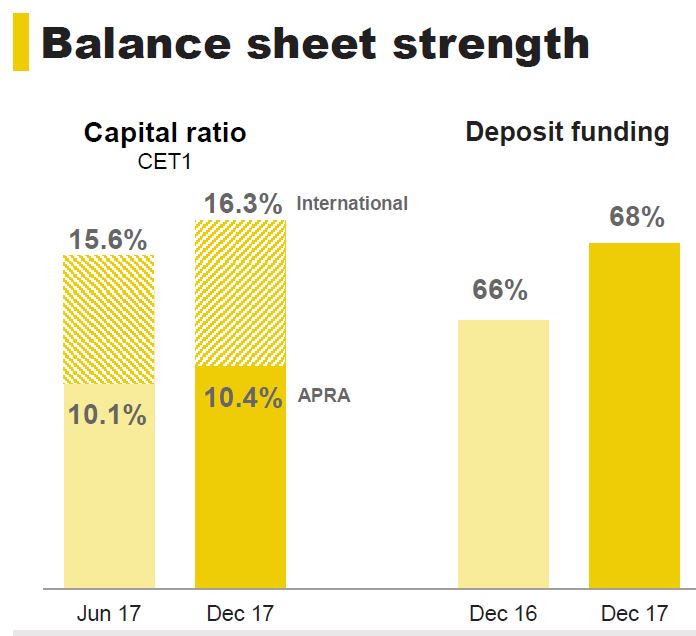
The CET1 ratio is 10.4%, lower than some expected, thanks to provisions, and CBA also flagged that by adopting the AASB9 standard CET1 will fall by around 25 basis points.
Some interesting commentary on the outlook:

Global growth trends are positive overall, as are Australia’s GDP outlook and employment trends. However, we remain wary of the risks of market volatility, particularly as expansionist monetary policy unwinds and interest rates rise. Similarly, low wage growth undermines families’ sense of confidence and wellbeing. As we have been for many years, we remain very much aware of the inevitability of intensified competition in the financial services sector.

But the results are quite a bit more complex given a number of one off adjustments.

CBA’s net profit after tax is disclosed on both a statutory and cash basis. A number of items have been included “above the line”.

  • The Group has provided for a civil penalty in the amount of $375 million (not deductible for tax) re AUSTRAC.
  • A $200 million expense provision was taken for expected costs relating to currently known regulatory, compliance and remediation program costs, including the Financial Services Royal Commission.
  • the sale of 100% of its life insurance businesses in Australia
    (“CommInsure Life”) and New Zealand (“Sovereign”) to AIA Group Limited (“AIA”) for $3.8 billion.

They also made adjustments to underlying performance.

  • 1H17 has been adjusted to exclude a $397 million gain on sale of the Group’s remaining investment in Visa Inc. and a $393 million one-off expense for acceleration of amortisation on certain software assets.
  • the impact of consolidation and equity accounted profits of AHL Holdings Pty Ltd (trading as Aussie Home Loans) has been excluded
  • 1H18 is adjusted to exclude an expense provision which the Group believes to be a reliable estimate of the level of penalty that a Court may impose in the AUSTRAC proceedings.
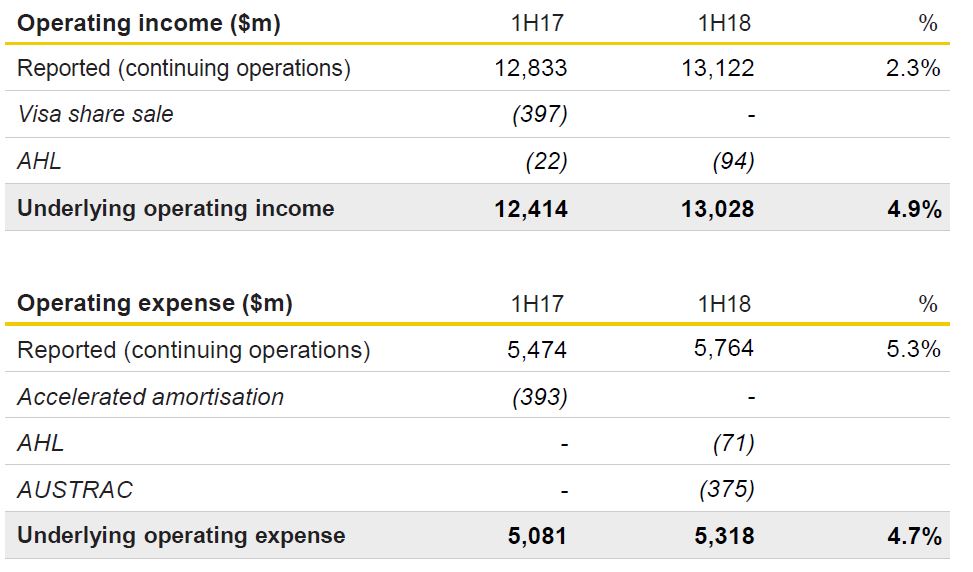
On this basis, the underlying cost-to-income ratio is 40.8% compared to the reported cash NPAT (continuing operations, including AUSTRAC penalty provision) cost-to-income ratio of 43.9%.

Looking at the divisional performance,  Retail Banking Services has more than 10 million personal and small business customers, a network of ~1,000 branches and more than 3,000 ATMs. More than 6 million customers now use digital channels with a quarter of new accounts opened online, and more than 50% of transactions by value completed digitally. Retail Banking Services cash net profit after tax for the half year ended 31 December 2017 was $2,653 million, an increase of 8% on the prior comparative period. Since 2006, Retail Banking Services have improved customer satisfaction by more than 25%, and has been number one in Roy Morgan Retail MFI customer satisfaction for 45 out of the past 54 months. Net interest income was $4,949 million, an increase of 8% on the prior comparative period. This reflected a higher net interest margin, solid balance growth in home lending and strong growth in transaction deposits. Net interest margin increased 11 basis points, reflecting: Higher home lending margin from repricing of interest only and investor loans, and lower cash basis risk, partly offset by unfavourable portfolio mix, with a shift to fixed home loans, and switching from interest only to principal and interest home loans; and higher deposit margin resulting from repricing and favourable portfolio mix, partly offset by lower cash basis risk; partly offset by the impact of the major bank levy. Other banking income was $955 million, a decrease of 5% on the prior comparative period, thanks to lower interchange rates and lower deposit fee income and removal of ATM withdrawal fees. FTE were 11,555, a decrease of 2% on the prior comparative period, yet operating expenses were $1,775 million, an increase of 2% on the prior comparative period. The operating expense to total banking income ratio was 30.1%, an improvement of 90 basis points on the prior comparative period. Net interest income increased 7% on the prior half, reflecting higher net interest margin, balance growth in home lending and deposits, and three additional calendar days than the prior half. Net interest margin increased 10 basis points, reflecting: higher home lending margin with repricing of interest only and investor loans to manage regulatory limits, and lower cash basis risk; partly offset by unfavourable portfolio mix, with a shift to fixed home loans, and switching from interest only to principal and interest home loans; lower deposit margin resulting from lower cash basis risk, partly offset by repricing; and the impact of the major bank levy. Loan impairment expense was $356 million, an increase of 1% on the prior comparative period. The result was mainly driven by increased home loan and personal loan collective provisions, which include the impact of slightly higher home loan arrears, predominately in Western Australia. Home loan growth up 5% driven by strong growth in the proprietary channel leading to an increase in the proprietary flows mix from 57% to 64%; Total deposit growth of 4%, driven by strong growth in Transaction accounts; and  Consumer finance balance decrease of 1%, broadly in line with system.

Business and Private Banking cash net profit after tax for the half year ended 31 December 2017 was $960 million, an increase of 9% on the prior comparative period. Net interest income was $1,694 million, an increase of 5% on the prior comparative period. This was driven by strong deposit balances growth, subdued growth in lending balances and an increase in net interest margin. Net interest margin increased six basis points. Other banking income was $517 million, an increase of 6%. Operating expenses were $789 million, flat on the prior comparative period. FTE were 3,557 up 1% primarily due to an increase in frontline bankers and project resources supporting the Bankwest east coast business banking transition. The operating expense to total banking income ratio was 35.7%, an improvement of 180 basis points on the prior comparative period. Loan impairment expense was $49 million, a decrease of 11% on the prior comparative period. Deposit growth of 6%, driven by strong demand for transaction deposits; home loan growth of 2%, driven by growth in owner occupied loans; and business lending growth of 1% driven by growth in target industries partly offset by decline in residential property development. Loan impairment expense was $49 million, an increase of $42 million on the prior half reflecting higher collective provisions, partly offset by lower individual provisions.

Institutional Banking and Markets cash net profit after tax for the half year ended 31 December 2017 was $591 million, a decrease of 13% on the prior comparative period. Net interest income was $737 million, a decrease of 4% on the prior comparative period. Other banking income was $679 million, a decrease of 6% on the prior comparative period. Operating expenses were $542 million, a decrease of 2% on the prior comparative period. The decrease was driven by the ongoing realisation of productivity benefits, partly offset by higher project, risk and compliance costs. The operating expense to total banking income ratio was 38.3%, an increase of 130 basis points on the prior comparative period. FTE were 1,510, an increase of 4% primarily due to growth in project related FTE and increased risk and compliance resourcing. Loan impairment expense was $105 million, an increase of $61 million on the prior comparative period. Asset quality of the portfolio has remained stable with the percentage of the book rated as investment grade increasing slightly by 40 basis points to 86.0%. Net interest income decreased 2% on the prior half, driven by lower margins, partly offset by average deposit balance growth. Net interest margin decreased seven basis points. Other banking income increased 8% on the prior half. Loan impairment expense increased $85 million on the prior half reflecting higher individual and collective provisions, partly offset by higher write-backs.

Wealth Management cash net profit after tax for the half year ended 31 December 2017 was $375 million, a 51% increase on the prior comparative period. Excluding the contribution from the CommInsure Life Business (discontinued operations), cash net profit after tax was $281 million, a 33% increase on the prior comparative period. The result was driven by strong growth in funds management income and lower operating expenses partly offset by lower insurance income. Funds management income was $987 million, an increase of 10% on the prior comparative period. Average Assets Under Management (AUM) increased 9% to $220 billion reflecting higher investment markets partly offset by higher net outflows in the emerging market equities and fixed income businesses. AUM margins declined reflecting investment mix shift to lower margin products. General insurance income was $82 million, a decrease of 24% on the prior comparative period due to higher weather event claims, partly offset by growth in premiums driven by pricing initiatives. Operating expenses were $707 million, a decrease of 3% on the prior comparative period. This was driven by ongoing realisation of productivity benefits partly offset by continued investment in business capabilities. FTEs were 3,534, a decrease of 11% on the prior comparative period. The operating expenses to total operating income ratio was 66.1%, an improvement of 610 basis points on the prior comparative period.

New Zealand cash net profit after tax for the half year ended 31 December 2017 was NZD589 million, an increase of 15% on the prior comparative period, driven by strong volume growth, improved lending margins, lower loan impairment expense and 20% increase in Sovereign’s profit. ASB cash net profit after tax for the half year ended 31 December 2017 was NZD575 million, an increase of 15% on the prior comparative period. The result was driven by operating income growth and a lower loan impairment expense, partly offset by higher operating expenses. Net interest income was NZD984 million, an increase of 8% on the prior comparative period, driven by strong volume growth and improved net interest margin. Net interest margin increased, reflecting an increase in lending margins, partly offset by an unfavourable retail deposit mix shift to lower margin investment deposit accounts. Other banking income was NZD212 million, an increase of 5% on the prior comparative period, primarily driven by higher card income and insurance commissions, partly offset by lower service fees as customers leverage digital channels. Funds management income was NZD55 million, an increase of 17% on the prior comparative period, due to strong net flows and market performance. Operating expenses were NZD427 million, an increase of 3% on the prior comparative period. This increase was driven by higher staff costs, continued investment in technology capabilities and higher regulatory compliance costs, partly offset by lower property costs and lower depreciation. FTE were 4,826, up 3% primarily due to an increase in frontline and compliance staff, partly offset by productivity initiatives. The operating expense to total operating income ratio for ASB was 34.1%, an improvement of 160 basis points, reflecting improved operating leverage supported by cost control and a continued focus on productivity.
Loan impairment expense was NZD26 million, a decrease of 47% on the prior comparative period, primarily due to lower provisions in the dairy portfolio. Home loan and consumer finance arrears rates continue to remain low at 12 basis points and 50 basis points respectively. This is despite a 12 basis point increase in consumer finance arrears on the prior comparative period primarily driven by the timing of write-offs. Balance Sheet growth included: home loan growth of 5%, marginally below system; strong business and rural loan growth of 8%, remaining above system, with the long-term strategic focus on this segment continuing to deliver strong results; and strong customer deposit growth of 7% in a competitive retail funding environment. Risk weighted assets increased 1%, primarily driven by lending volume growth, partly offset by improved credit quality in the business and rural portfolios.

Bankwest cash net profit after tax for the half year ended 31 December 2017 was $339 million, an increase of 17% on the prior comparative period. The result was primarily driven by strong growth in total banking income, lower loan impairment expense and flat operating expenses. Net interest income was $778 million, an increase of 6% on the prior comparative period. The result was driven by strong balance growth in home lending and deposits, and a higher net interest margin. Other banking income was $107 million, an increase of 7% on the prior comparative period, reflecting an increase in fee based package offerings, partly offset by lower business lending fees. Operating expenses were $368 million, flat on the prior comparative period, reflecting a continued focus on productivity and disciplined expense  management. FTE were 2,866, up 2% on the prior comparative period as a result of increased investment in customer facing technology platforms. The operating expense to total banking income ratio was 41.6%, an improvement of 250 basis points compared to the prior comparative period. Loan impairment expense was $30 million, a decrease of 40% on the prior comparative period. This was driven by reduced home loan impairments and lower business loan collective provisions. Home loan arrears increased in line with the softening Western Australian economy. Balance sheet growth included: home loan growth of 6%, slightly lower than system reflecting the Western Australian economy lagging national growth rates; total deposit growth of 11% resulting from strong growth in Investment and Transaction deposits, reflecting a continued focus on deepening customer relationships; and core business lending growth of 6%. Risk weighted assets increased by 18% on the prior comparative period driven by regulatory changes to the home loan risk weighting. The underlying increase excluding regulatory changes was 10% driven by volume growth in business and home loans and an increase in Operational Risk.
Financial Services Competition Reform Needed – Productivity Commission

The Productivity Commission, Australian Government’s independent research and advisory body has released its draft report into Competition in the Australian Financial System. It’s a Doozy, and if the final report, after consultation takes a similar track it could fundamentally change the landscape in Australia. They leave no stone upturned, and yes, customers are at a significant disadvantage. Big Banks, Regulators and Government all cop it, and rightly so.

Australia’s financial system is without a champion among the existing regulators — no agency is tasked with overseeing and promoting competition in the financial system. The Commission’s draft report into Competition in the Australian Financial System recognises that both competition and financial stability are important to the Australian financial system, and are an uncomfortable mix at times. It has also found that competition is weakest in markets for small business credit, lenders’ mortgage insurance, consumer credit insurance and pet insurance.

Here are some of the key findings.

Whilst there has been significant innovation (enabled by technology), the financial system is highly profitable and concentrated.  It lacks strong pricing rivalry – and evidence that it exploits loyal customers.

It questions whether the four pillars policy is still relevant.  It is an ad hoc policy that, at best, is now redundant, as it simply duplicates competition and governance protections in other laws. At worst, in this consolidation era it protects some institutions from takeover, the most direct form of market discipline for inefficiency and management failure. All new entrants to the banking system over the past decade have been foreign bank branches, usually targeting important but niche markets (and these entrants have evidenced only limited growth in market share).

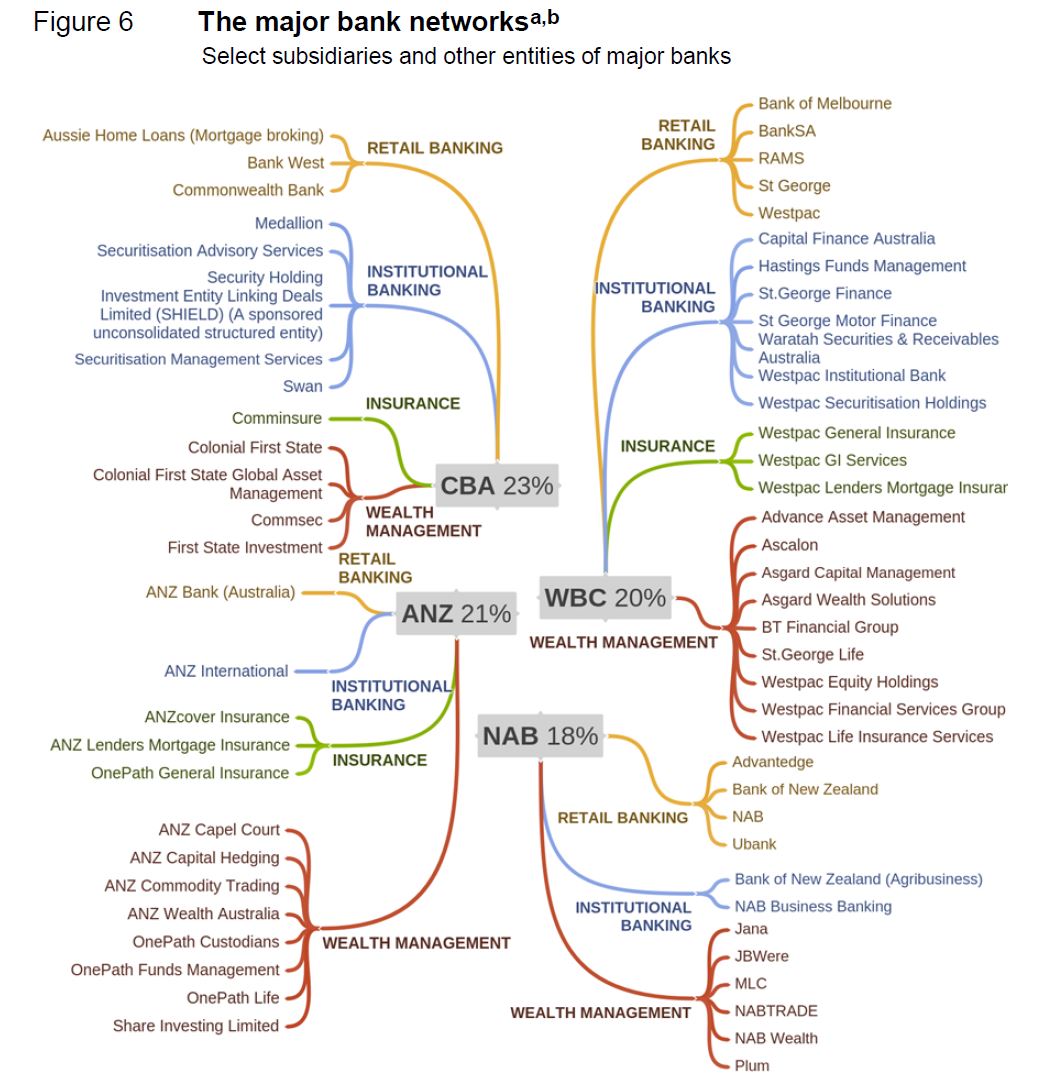
Australia’s financial system is dominated by large players — four major banks dominate retail banking, four major insurers dominate general insurance, and some of these same institutions feature prominently in funds and wealth management. A tail of smaller providers operate alongside these institutions, varying by market in length and strength.

Across the financial system, there is a continual flow of new products and a re-packaging of existing products to appeal to specific groups of consumers. As a consequence, there is a very large number of products in financial markets, with sometimes only marginal differences between them: nearly 4000 different residential property loans and 250 different credit cards are on offer, for example. The same situation is apparent in insurance markets: the largest 4 general insurers hold more than 30 brands between them. In the pet insurance market this is particularly pronounced — 20 of the 22 products (with varying premiums) on offer are underwritten by the same insurer.

Banks can price as they want. Little switching occurs — one in two people still bank with their first-ever bank, only one in three have considered switching banks in the past two years, with switching least likely among those who have a home loan with a major bank. ‘Too much hassle’ and a desire to keep most accounts with the same institution are the main reasons given for the lack of switching, with home loans being a particularly difficult product for consumers to switch.

Although financial institutions generally have high customer satisfaction levels, customer loyalty is often unrewarded with existing customers kept on high margin products that boost institution profits. For this to persist, channels for provision of information and advice (such as mortgage brokers) must be failing.

Scope for price rivalry in principal loan products is constrained by a number of external factors: price setting by the Reserve Bank facilitating price coordination by banks; expectations of ratings agencies that large banks are too big to fail; and some prudential regulation (particularly in risk weighting) that favours large institutions over smaller ones.

The growth in mortgage brokers and other advisers does not appear to have increased price competition. The revolution is now part of the establishment. Non-transparent fees and trailing commissions, and clear conflicts of interest created by ownership are inherent. Lender-owned aggregators and brokers working under them should have a clear best interest duty to their clients.

There is also variation between larger and smaller institutions in funding costs (with a large regulatory-determined component). Not all ADIs face the same regulatory arrangements and regulatory effects on their pricing capacity. A source of differential funding costs to banks is a series of regulatory measures and levies that apply (both positively and negatively) to the major Australian-owned banks but not to smaller Australian-owned ADIs or foreign banks operating in Australia.

The net result of these regulatory measures is a funding advantage for the major banks over smaller Australian banks that rises in times of heightened instability. RBA estimated this advantage to have averaged around 20 to 40 basis points from 2000 to 2013 (worth around $1.9 billion annually to the major banks). More recently, the funding cost advantage of major banks has been estimated to have declined to about 10 basis points, due in part to prudential reforms. But it nevertheless persists, and ratings agencies are unlikely to rate institutions’ fund raising such that there is no effective differential between Australia’s major and smaller banks.

Australia’s major banks have delivered substantial profits to their shareholders  — over and above many other sectors in the economy and in excess of banks in most other developed countries post GFC. In recent times, regulatory changes have put pressure on bank funding costs, but by passing on cost increases to borrowers, Australia’s large banks in particular have been able to maintain high returns on equity (ROEs).
The ROE on interest-only investor loans doubled, for example, to reach over 40% after APRA’s 2017 intervention to stem the flow of new interest-only lending to 30% of new residential mortgage lending (reported by Morgan Stanley). This ROE was possible largely due to an increase by banks in the interest rate applicable to all interest-only loans on their books, even though the regulator’s primary objective was apparently to slow the growth rate in new loans. Competing smaller banks were unable to pick up dissatisfied customers from this re-pricing of their loan book because of the application of the same lending benchmark to them.

Regulators have focused on a quest for financial stability prudential stability since the Global Financial Crisis, promoting the concept of an unquestionably strong financial system.

The institutional responsibility in the financial system for supporting competition is loosely shared across APRA, the RBA, ASIC and the ACCC. In a system where all are somewhat responsible, it is inevitable that (at important times) none are. Someone should.

The Council of Financial Regulators should be more transparent and publish minutes of their deliberations. Under the current regulatory architecture, promoting competition requires a serious rethink about how the RBA, APRA and ASIC consider competition and whether the Australian Competition and Consumer Commission (ACCC) is well-placed to do more than it currently can for competition in the financial system.

Some of APRA’s interventions in the market — while undertaken in a way that is perceived by the regulators to reflect competitive neutrality — have been excessively blunt and have either ignored or harmed competition. Such consequences for competition were neither stated nor transparently assessed in advance. APRA’s interpretation of Basel guidelines on risk weightings that non-IRB banks use for determining the amount of regulatory capital to hold, puts it among the most conservative countries internationally.

  • For home loans, the main area in which Australia’s risk weights vary from international risk weightings is for (lower risk) home loans that have a loan to value ratio below 80%.Australian non-IRB lenders are required to use a risk weight of a flat 35%, compared with Basel-proposed guidelines of 25% to 35% for such loans.
  • For small and medium enterprise (SME) loans, the main area of difference is lending that is not secured by a residence. A single risk weight (of 100%) applies to all SME lendingnot secured by a residence, with no delineation allowed for the size of borrowing, the form of borrowing (term loan, line of credit or overdraft) or the risk profile of the SMEborrowing the funds. In contrast, Basel proposed risk weights for SME lending vary from75% for SME retail lending up to €1 million, to 150% for lending for land acquisition, development and constructions.

The RBA should establish a formal access regime for the new payments platform (NPP). As part of this regime, the RBA should review the fees set by participants of the NPP and transaction fees set by NPPA; and require all transacting participant entities that use an overlay service to share de-identified transaction-level data with the overlay service provider.

Measures that should be prioritised to help consumers become a competitive force in the longer term include:

  • consumer rights to have their financial data transferred directly from one service provider to another, either facilitated through Open Banking arrangements or as part of a more broadly-based consumer data right
  • automatic reimbursement of the ‘unused’ portion of lenders mortgage insurance when a consumer terminates the loan
  • payment system reforms that help detach consumers from their financial providers
  • provision of information on median home loan interest rates provided in the market over the previous month
  • inclusion on insurance premium notices, of the previous year’s premium and percentage change.