From The Bankunderground.
An unprecedented ageing process is unfolding in industrialised economies. The share of the population over 65 has gone from 8% in 1950 to almost 20% in 2015, and is projected to keep rising. What are the macroeconomic implications of this change? What should we expect in the coming years? In a recent staff working paper, we link population ageing to several key economic trends over the last half century: the decline in real interest rates, the rise in house prices and household debt, and the pattern of foreign asset holdings among advanced economies. The effects of demographic change are not expected to reverse so long as longevity, and in particular the average time spent in retirement, remains high.
An unprecedented demographic change…
Population ageing is typically summarised by the old age dependency ratio, the ratio of the population over 65 relative to the working population. In industrialised countries, this ratio has risen from under 15% in 1950 to over 30% in 2015, and is forecast to rise to 50% in the next 20 years (dark blue line in Chart 1). Looking at a few countries where population data is available from the 19th century, shown in the dashed lines in Chart 1, this trend is unprecedented. While falling birth rates do play a part, the trend is driven predominantly by increasing longevity. The same ageing process is also happening, albeit more slowly, in middle and low income countries.
Chart 1: Old Age Dependency Ratio across industrialised countries (%)

Note: The ratio is defined as population over 65 divided by population aged 20-64. The thick navy line shows aggregate data from the UN Population Statistics for 17 industrialised countries (Australia, Austria, Belgium, Canada, Denmark, France, Germany, Ireland, Italy, Japan, Netherlands, New Zealand, Portugal, Spain, Switzerland, UK and USA), and dashed navy lines show the high- and low-fertility scenarios in their projections. Thin dashed lines show the historical data for Belgium, Denmark, France, Netherlands, Switzerland and UK from The Human Mortality Database.
From an individual perspective, this trend reflects an increasing fraction of life spent in old age. People that reach retirement age can now look forward to living a further 20 years, on average. Assuming no change in the retirement age, this number is projected to rise to almost 30 years for generations born 20 to 30 years from now. Consider that when Bismarck, Lloyd George and others pioneered state pensions over a century ago, workers were lucky merely to reach retirement age. While raising the retirement age can work to stabilise the time spent in retirement relative to time spent working, the increases proposed in most advanced economies are not yet enough to offset this rise in life expectancy.
… with a profound effect on desired wealth accumulation…
One of the primary ways that population ageing affects the economy is through savings and wealth accumulation. While many developed countries have some form of implicit transfers from workers to retirees through state pensions, private saving remains an important component of retirement income. This is evident in the life-cycle pattern of wealth holdings: in the United States, where the most data is available, wealth peaks close to retirement age and then falls gradually (Chart 2).
Chart 2: Net worth over the life-cycle, with and without housing (thousand US Dollars)

Note: The data is taken from Survey of Consumer Finances, averaged over 1989-2013. The dark solid line shows total net worth, and the light dashed line shows net worth excluding housing wealth.
The rise in life expectancy raises the economy’s desired level of wealth for two reasons. Firstly, people need to accumulate more wealth during their working life to fund their consumption over a longer expected retirement. In terms of the life-cycle profile of wealth, all else equal, this would mean that wealth rises more steeply and reaches a higher peak. Secondly, even without any change in behaviour over the life-cycle, the changing population age structure would imply rising aggregate wealth. Specifically, Chart 2 shows us that households accumulate much of their wealth by around age 50, and hold on to that wealth throughout retirement. Therefore, when adding up individuals’ wealth, the increasing share of people in these high-wealth stages of life will imply a higher aggregate level of wealth.
… With far-reaching macroeconomic implications…
What are the macroeconomic effects of this rise in wealth? In terms of a simple concrete example, household savings find their way to firms, who invest them in machines, structures and intangibles such as branding and research. To the extent that it is harder for firms to employ extra machines as profitably as existing ones, i.e. that the returns to these investments are diminishing at the margin, households get lower returns as their savings increase. In other words market interest rates are lower.
The effects of ageing do not stop there. As desired wealth rises, the demand for other assets, including for example housing, also rises, pushing up on prices. Borrowing also rises, in response to both the fall in the interest rate, which makes borrowing cheaper, and the rise in house prices, as younger and less wealthy households borrow to buy housing. Within open economies, countries that are ageing relatively faster will accumulate assets in countries that are ageing relatively more slowly. This would explain why rapidly ageing countries, like Japan or Germany, are lending money to relatively younger countries, such as Australia.
While the mechanism described above is, of course, simplified, there is evidence that the ratio of capital-to-GDP is indeed much higher now than in the past (Chart 3). This provides additional evidence in favour of our underlying mechanism.
Chart 3: Measures of Capital-to-GDP in industrialised countries (Index)
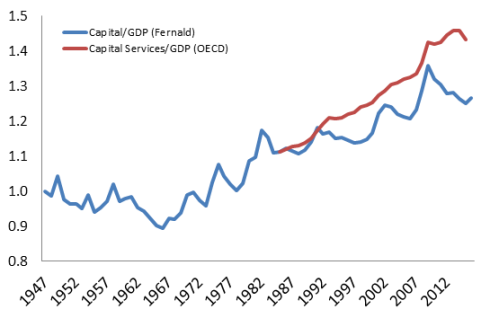
Note: The blue line shows an index of the ratio of the capital stock to value added in the US business sector from Fernald (2014), equal to 1 in 1947. The red line shows an index of the ratio of capital services to GDP for 19 OECD countries, which, for comparison, we normalise to equal the Fernald measure in 1985 when the series begins.
… which are quantitatively significant
In a recent staff working paper, we have embedded the mechanisms described above in a life-cycle model, in order to quantify these effects for industrialised countries. Households in our model follow the life-cycle patterns of work, home ownership and wealth that we see in the data. This means we take as given that retirees keep their high level of wealth, and assume that future retirees will do the same. We assume that households know their life expectancies accurately, take account of current and expected house prices and interest rates, and hence plan ahead for their future consumption. This implies that households are able to save more in anticipation of their longer retirements, rather than having to work longer or give up their consumption in old age.
In equilibrium, the real interest rate adjusts to balance the supply of capital from the household with the demand from firms. This sets to one side the fact that, in practice, there is a large spread between the risk-free interest rate in financial markets and the interest that firms earn on new investments. This spread is comprised, among other things, of various premia for liquidity and risk, and profits that firms earn in excess of their costs, which we abstract from. House prices also adjust to balance demand for housing with a supply that we assume is fixed per head.
We allow birth and death rates to fall in line with UN data and projections for industrialised countries, as defined in Chart 1. This will be the only external driver of the dynamics in our model. We set the model to match the level of interest rates, and some other aggregate variables in the 1970s, and then measure how the demographic trends have affected the economy since then.
We find that demographic change alone can explain 160bps of the 210bps decline in interest rates since the early 1980s measured by Holston et al. (2017). The model predicts an increase in house prices of over 45% since 1970, corresponding to around 75% of the change observed in the data (Chart 4a). It also explains the doubling of the private debt-to-GDP ratio between 1970 and the start of financial crisis, an increase of around 45pp (Chart 4b). These results confirm that ageing does have a sizeable economic impact. Implications for cross-country imbalances are also important: the pattern of foreign asset accumulation (net borrowing and lending) across industrialised economies predicted by the model explains almost 30% of the variation observed in 2010.
Chart 4: House prices and gross private debt-to-GDP in the model and in the data
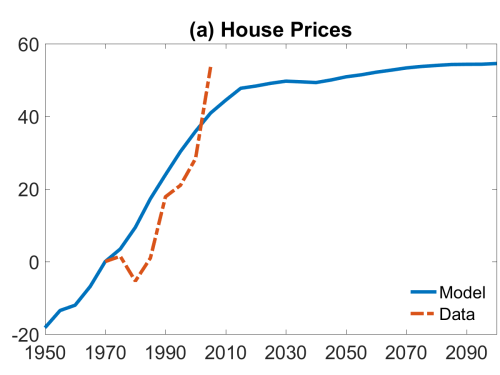
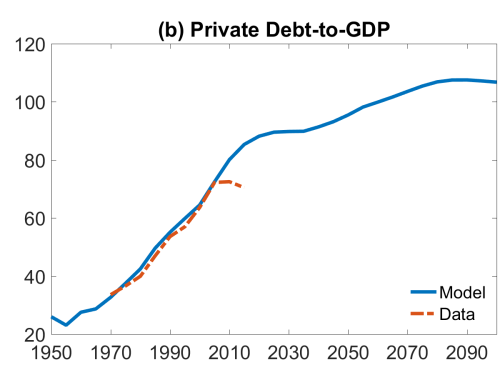
Note: House prices are shown in percentage deviation from the 1970 value, and private debt-to-GDP is shown as a percentage. In both cases, the blue solid lines show the results of our model simulations and red dashed lines show the equivalent series in the data.
Finally, the model allows us to gauge the effects of demographics going forward, based on the projections in the UN data. Importantly, these effects are set to increase over the future. The retirement of baby boomers is sometimes cited as potentially driving a decrease in aggregate savings. This does not happen in our quantitative model, both because new generations are expecting to live ever longer into retirement, and are therefore saving more, and because we can expect that baby boomers will retain their high wealth levels throughout retirement. This means that population ageing will continue to keep long run interest rates lower than they would otherwise be, as long as life expectancy, in particular the expected duration of retirement, remains high.
Bank Underground is a blog for Bank of England staff to share views that challenge – or support – prevailing policy orthodoxies. The views expressed here are those of the authors, and are not necessarily those of the Bank of England, or its policy committees.

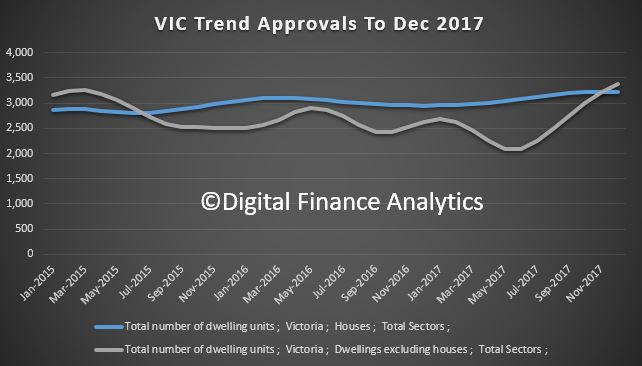
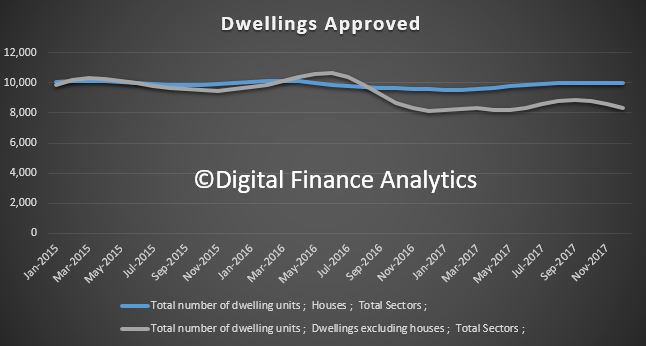 Approvals for private sector houses have remained stable, with just under 10,000 houses approved in December 2017, but the fall was in apartments.
 QLD continues to slow, from a peak in November 2015.
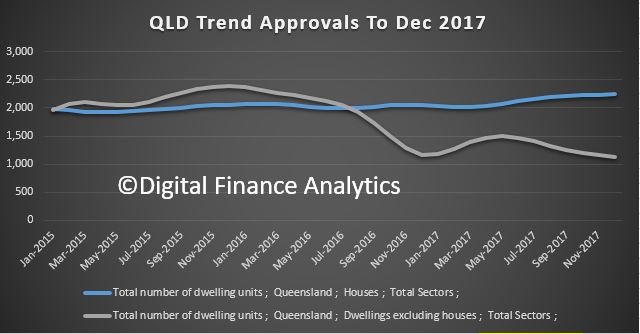 WA is moving up, just a little, from a low in May 2017.
 VIC is bucking the trend, with a significant rise since May 2017, but we wonder for how long, as supply is already taking the heat out of new unit sales.