Major aggregator issues fraud warning to brokers

From The Adviser.

One of the industry’s largest aggregators has said that brokers are “on the front line” of preventing mortgage fraud as regulators turn their attention to the third-party channel.

In a compliance update this week, Connective pointed to findings from the 2016 Veda Cybercrime and Fraud Report, which recorded a 27 per cent year-on-year increase in falsifying personal information.

“Falsified documentation — particularly documents that verify a customer’s income — is the most common type of fraud that a mortgage broker is likely to encounter,” the aggregator said.

“It is your responsibility to ensure [that] the income declared on a customer’s loan application truly reflects their actual income. That puts you on the front line in terms of mortgage fraud prevention.”

Since 2010, ASIC has investigated more than 100 matters relating to loan fraud, and it banned, suspended or placed conditions on the licenses of more than 80 individuals or companies.

“We can only expect this scrutiny to intensify,” Connective said. “Quite recently, one mortgage broker was actually jailed for five years for colluding with clients over fraudulent loan applications.”

The award-winning aggregator urged brokers to carefully check income and verify living expenses by “studying” payslips and bank statements.

“You should check carefully to ensure that these documents, particularly the payslip, contain the information you would reasonably expect to see, and make an effort to check [that] the documents have not been altered or doctored.”

Connective provided this list of what should appear on a payslip:

  • Employer’s and employee’s names
  • Employer’s Australian Business Number (if applicable; verify by looking it up online)
  • Pay period
  • Date of payment
  • Gross and net pay
  • Hourly rates and amount paid
  • Any allowances or bonuses
  • Superannuation deductions
  • Any other deductions (such as child support payments, HECS payments)
  • Leave balances
  • A year to date summary

“If you are in any doubt, it is a good idea to ask your customer’s permission to call their employer and verify the information in their payslip,” Connective said. “If they refuse to give you permission, this can be considered a red flag.”

Back in June, Equifax BDM Steve Arsinoski informed brokers at a Pepper Money roadshow that 13 per cent of frauds reported were targeting home loans and there has been a 25 per cent year-on-year increase in frauds originating from the broker channel.

NAB streamlines loan process for brokers

From Australian Broker.

National Australia Bank (NAB) has announced a series of changes that will make its digital home loan capabilities more efficient for brokers and their clients.

The bank has introduced two online verification tools, IDme and ZipID, that allow brokers to securely collect customer identification from their mobile devices. NAB will also add DocuSign to its suites of tools in 2018 so customers can sign documents anywhere from their phone or tablet.

“We are focused on using smart technology to make it easier for brokers to both collect customer information and submit documentation, simplifying the home loan process,” said Steve Kane, NAB general manager of broker distribution.

These improvements have been rolled out as part of the bank’s Helping You Accelerate campaign which seeks to enhance the home loan experience for both brokers and customers.

Brokers will gain access to a variety of digital tools and personalised support from NAB to help guide them through the home loan process and deliver a positive experience to clients.

“In 2017 we have made a range of changes to make submitting home loan applications easier, simpler and more efficient for brokers and their customers,” said Kane.

The Helping You Accelerate campaign will help brokers get the most out of the support NAB offers by integrating its tools and assistance into a simple, step-by-step guide, he added.

“It’s yet another way we are showing our commitment to the broker channel.”

Over the past 12 months, NAB has rolled out a number of other initiatives to assist brokers such as its renewed small business offerings for SME clients and the Customer Adviser Broker Program which saw the bank install support experts in more than 20 branches with the specific remit of on-boarding broker clients.

“These initiatives are just a few examples of how NAB is listening to the insights of our brokers and continually improving the broker-customer experience. It’s just one step closer to becoming the bank for brokers,” Kane said.

Global Wealth Higher, But More Uneven

According to the eighth edition of the Credit Suisse Research Institute’s Global Wealth Report, in the year to mid-2017, total global wealth rose at a rate of 6.4%, the fastest pace since 2012 and reached USD 280 trillion. This reflected widespread gains in equity markets matched by similar rises in non-financial assets (home prices), which moved above the pre-crisis year 2007’s level for the first time this year.

Wealth growth also outpaced population growth, so that global mean wealth per adult grew by 4.9% and reached a new record high of USD 56,540 per adult.

House price movements are a rough proxy for the non-financial component of household assets, and here most countries experienced a rise in values last year, although Japan (–1%) and Russia(–5%) were among the exceptions.

This year, the report includes a focus on Millennials’ wealth position and provides a comparison with earlier generations. They are not faring well, “Millennials are not only likely to experience greater challenges in building their wealth over time, but also greater wealth inequality than previous generations.”

Australia

Household wealth in Australia grew at a fast pace between 2000 and 2012 in US dollar terms, except for a short interruption in 2008. The average annual growth rate of wealth per adult was 12%, with about half the rise due to exchange-rate appreciation against the US dollar. The exchange rate effect went into reverse for three years after 2012 and, like other resource-rich countries, Australia was badly hit by sagging commodity prices. Despite that slowdown, Australia’s wealth per adult in 2017 is USD 402,600, the second highest in the world after Switzerland.

The composition of household wealth in Australia is heavily skewed towards non financial assets, which average USD 303,200, and form 60% of gross assets. The high level of real assets partly reflects a large endowment of land and  natural resources relative to population, but also results from high property prices in the largest cities.

Wealth inequality is relatively low in Australia, as reflected in a Gini coefficient of just 65% for wealth. Only 5% of Australians have net worth below USD 10,000. This compares to 19% in the UK and 29% in the USA. Average debt amounts to 20% of gross assets. The proportion of those with wealth above USD 100,000, at 68%, is the fourth highest of any country, and almost eight times the world average. With 1,728,000 people in the top 1% of global wealth holders, Australia accounts for 3.5% of this top slice, despite being home to just 0.4% of the world’s adult population.

Global Summary

We further saw an increase of 2.3 million US-dollar-millionaires, almost half of whom reside in the United States. Partially due to a 3% rise in the value of euro against the US dollar, we also note 620,000 new dollar-millionaires in the main Eurozone countries Germany, France, Italy and Spain. Another 200,000 joined in Australia and about the same number appeared in China and India together. We have seen a decline in millionaire numbers in very few countries, mostly associated with depreciating currencies: the United Kingdom lost 34,000 and Japan lost over 300,000.

Our home market Switzerland has seen wealth per adult increase by 130% to USD 537,600 since the turn of the century and continues to lead the global rankings. Again, we note that a large part of the rise is associated with the appreciation of the Swiss franc against the US dollar between 2001 and 2013. Nonetheless, measured in Swiss francs, domestic household wealth rose by 35% since 2000, which corresponds to an average annual rate of 1.8%. Switzerland today accounts for 1.7% of the top 1% of global wealth holders and over two-thirds of Swiss adults have assets above USD 100,000. 8.8% of Swiss are US-dollar millionaires and an estimated 2,780 individuals are in the ultra-high net worth bracket, with wealth over USD 50 million.

Financial assets continue to make up 54% of gross wealth in Switzerland, which is less than in Japan or the United States and debts average USD 140,500 per adult, which is one of the highest absolute levels in the world, although we continue to believe that the debt ratio reflects the country’s high level of financial development, rather than excessive borrowing.

On the worrying end, among the ten countries for which long series of wealth distribution are available, Switzerland is alone in having seen no significant reduction in wealth inequality over the past century.

Looking at the bottom of the wealth distribution, 3.5 billion people – corresponding to 70% of all adults in the world – own less than USD 10,000.

Those with low wealth tend to be disproportionately found among the younger age groups, who have had little chance to accumulate assets, but we find that Millennials face particularly challenging  circumstances compared to other generations.

Although relatively less severe in some emerging markets, capital losses during 2008–2009, high unemployment, tighter mortgage rules, growing house prices, increased income inequality, less access to pensions and lower income mobility have dealt serious blows to young workers and savers and hold back wealth accumulation by the Millennials in many countries. With the baby boomers occupying most of the top jobs and much of the housing, Millennials are doing less well than their parents at the same age, especially in relation to income, home ownership and other dimensions of wellbeing assessed in this report. While Millennials are more educated than preceding generations (we see an increase of more than 20% in tertiary education across OECD countries), we expect only a minority of high achievers and those in high-demand sectors such as technology of finance to effectively overcome the “millennial disadvantage.”

We also note that entrepreneurship, as measured by the fraction of self-employed workers, has been declining across OECD countries since the turn of the century, including Millennials who are generally touted as a generation of entrepreneurs.

Australia’s tenuous place in the new global economy

From The Conversation.

The Committee for Economic Development of Australia (CEDA) has released a report titled Australia’s Place in the World, which considered how Australia should respond to changing attitudes to globalisation.
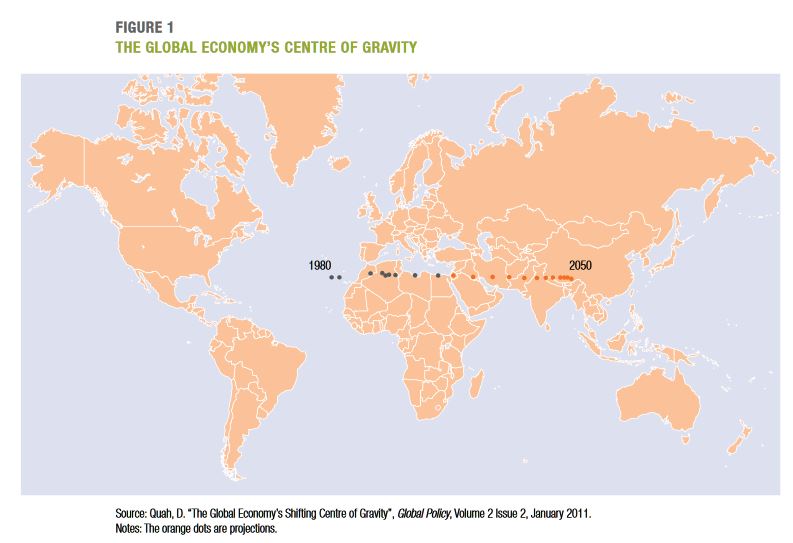
At home and around the world, there is a backlash against free trade and globalisation. The report asks what course Australia should navigate through these choppy economic and political waters.

The backdrop, of course, is the UK Brexit vote and the election of Donald Trump as US President.

If that’s not motivation enough, one could easily add to CEDA’s list: the performance of Marine Le Pen in France’s recent presidential election, the election of the far-right AfD to the German parliament, and the looming role of Pauline Hanson’s One Nation in the Queensland election.

Tariffs and trade

The report is broken into three sections: Global Economy, Global Security, and Global Governance, but it is the first and third that speak directly to Australia’s economic fortunes in the age of Trump.

One obvious, but correct and important observation the report makes is that Australia has been a huge beneficiary of free trade over the past 30 years. Not only have our exporters gained access to major overseas markets, but consumers in Australia have also benefited from reduced tariffs.

For example, the price of a typical sedan has basically halved in real terms due to the removal of a 100% car tariff. But while trade and globalisation have made the economic pie bigger, the sharing of those benefits has been much more uneven. Just ask manufacturing workers.

What is missing from the report’s recommendations is how to deal with and compensate the losers from globalisation in Australia. That is important, both economically and politically.

Global rise of populism

The rise of populist parties around the world has been associated with this failure to compensate globalisation’s losers.

Part of what it takes to address this issue is so-called “place-based policies” which Rosalind Dixon and I have previously discussed. Broadly, this refers to the people who are affected when industries move away from particular areas and employment opportunities dry up.

The CEDA report argues, however, that:

Policies such as moving from transaction taxes on property to broad-based land tax to address housing affordability and labour mobility need to be designed along with transition pathways. GST reform with a broader base to remove the need for stamp duty could be another option.

The report also points out that Australia’s company tax rate is uncompetitive, and that the proposed shift to a 25% rate under the Coalitition’s “Enterprise Tax Plan” would only happen by 2026-27, if it happens at all. These are all good points, and would make for good policy. Yet the only one that looks vaguely likely to happen is replacing stamp duty with land tax – and that would be done at a state government level.

The federal government floated the idea of GST reform and retreated almost immediately after the opposition predictably attacked it viciously and effectively as being “regressive”. The Enterprise Tax plan also looks to be in danger, as several crossbench MPs seem likely to side with Labor and want tax cuts only for small businesses. That’s utterly stupid economics, but apparently good politics.

Middle power leadership?

As the report notes: “Global cooperation is growing increasingly important in a world that faces a number of crises that require cross-border solutions.”

This is surely true, although the report paints a rosy picture of Australia’s potential role as a “middle power”, claiming that we were important in the establishment of the United Nations.

True, Australia played a relatively important role in establishing APEC and the G20. But that involved leadership from figures like Hawke, Keating and Rudd. I, for one, don’t see anyone on the present political landscape with those leadership and persuasion skills.

Perhaps the bigger challenge is that President Trump seems determined to radically undermine international institutions. Even Canadian Prime Minister Justin Trudeau was unhelpful in the Trans Pacific Partnership rebound effort that Malcolm Turnbull and others were trying to arrange.

What can Australia do in the face of orchestrated attacks on global institutions by the biggest and most important nations? Very little, I fear. The age of Trump is a difficult time for Australia and its leaders. Many things are out of our control.

What we can do, however, is resist the tide of populism at home, and provide stable and functional government. Both major parties have a patchy recent record in that regard, and the federal opposition has made some populist-type moves on trade and protectionism.

Let’s hope they don’t really believe it.

Author: Richard Holden, Professor of Economics and PLuS Alliance Fellow, UNSW

Australian business is booming, but don’t go cracking the champagne just yet

From Business Insider.

Australian businesses have never had it better, according to the latest National Australia Business (NAB) survey released today.

The survey’s conditions index — a composite indicator that measures trading activity, profitability and employment — surged by a massive 7 points to +21, leaving it at the highest level since the survey began in 1997.

On this measure, Australian businesses have not had it this good in at least two decades.

As the chart below shows, there were enormous increases recorded in trading and profitability, suggesting that demand was rampant during October.

Source: NAB


But are business conditions as strong as the NAB survey suggests?

While no one doubts that things have improved over the past year — strong growth in employment, for one, suggests they have — but the strength in the NAB survey is significantly greater than in other alternate business indicators such as the Ai Group’s measures on manufacturing, services and construction activity levels.

Like the NAB survey, they too have been around for years, and they paint a very different picture on the current momentum in the business sector.

In October, respondents in those surveys reported that activity levels improved at a slower pace than September, and well below the levels seen just a few months ago.

Services fell to 51.4, manufacturing to 51.1 and construction to 53.2, remembering that a reading over 50 indicates that perceived activity levels improved from one month earlier.

So activity levels improved according to those surveys, but at a marginal pace.

While they are constructed differently, they both look at perceived business conditions in Australia.

And while the Ai Group respondents did report an improvement in activity levels, one has to ask whether that would lead to the boom in profitability and trading conditions reported by respondents in the NAB survey?

Given the divergence, caution is understandably warranted.

That’s something that Alan Oster, Chief Economist at the NAB, stressed following the release of October report, noting that a sharp improvement in manufacturing conditions contributed to the outsized move.

“This is an extremely strong result and of itself would suggest a better than expected performance for the economy,” he said.

“However, it is unclear just how long conditions can remain at these record levels given that the result was driven by a surprise jump in manufacturing.”

Adding to the need for caution, Oster said the surveys lead indicators also softened over the month, which, along with an unchanged reading on business confidence, raised questions as to whether the bounce in the conditions index can be sustained.

“Some of the leading indicators such as forward orders — which have been giving a more accurate read on the strength of the economy — have actually softened a little in recent months,” he said.

“Less upbeat readings on business confidence may also be telling, with firms previously indicating that uncertainty around the outlook for their business is holding confidence back.”

Given softer internals in the NAB report, along with the slowdown in other business indicators, it will be interesting to see whether the NAB’s conditions index will retrace its October surge next month.

Things are undoubtedly looking better for Australian business, but it’s probably best to keep the champagne on ice, says Tom Kennedy, Economist at JP Morgan.

“Although firms’ operating conditions have obviously improved, the sectoral momentum in the survey [from] manufacturing and mining makes us think that the magnitude of the improvement is overdone and the implications for economic growth and monetary policy need to be faded,” he says.

George Tharenou, Economist at UBS, agrees with Kennedy’s assessment.

“The conditions [index] is now giving an incredibly bullish signal on the economy with a spike to a record high,” he says.

“However, it has been average or above for most of the last three years and has just not translated through to the hard data like GDP, CPI or wages.”

The Investment Web That Is Fintech

From The Bank Underground.

Investment in the Financial Technology (FinTech) industry has increased rapidly post crisis and globalisation is apparent with many investors funding companies far from their own physical locations.  From Crunchbase data we gathered all the venture capital investments in FinTech start-up firms from 2010 to 2014 and created network diagrams for each year.

The animation below depicts FinTech investments by year from 11 hub countries (coloured pink) to a broader set of recipient countries (coloured blue) from 2010 to 2014.

Source: Crunchbase data and our own calculations.

The arrows indicate the direction of flow, the thickness of each line is proportional to the number of investments, and the node area denotes the total number of foreign FinTech investments into that particular country. To avoid the issue of missing data and purchasing power parity across the globe, we did not use the monetary value of these investments. Unsurprisingly, the USA and the UK attract the largest number of foreign FinTech investments; although the number of outgoing investments from the UK is relatively small (demonstrated by the lack of thick outgoing arrows).

FinTech investment is also revolutionising developing financial sectors in China along with other African and Asian countries. However, it is interesting that China is not one of the fastest growing nodes. An explanation for this is that the majority of venture capital investment in Chinese FinTech firms comes from domestic investors, which we have not captured in this animation.

Nevertheless, one can see the expansion and the growing interconnectedness of global FinTech investments from these network diagrams.

Note: Bank Underground is a blog for Bank of England staff to share views that challenge – or support – prevailing policy orthodoxies. The views expressed here are those of the authors, and are not necessarily those of the Bank of England, or its policy committees.

Time For “Digital First” – The Quiet Revolution Report Vol 3 Released

Digital Finance Analytics has released the latest edition of our flagship channel preferences report – “The Quiet Revolution” Volume 3, now available free on request, using the form below.

This report contains the latest results from our household surveys with a focus on their use of banking channels, preferred devices and social media trends.

Our research shows that consumers have largely migrated into the digital world and have a strong expectation that existing banking services will be delivered via mobile devices and new enhanced services will be extended to them. Even “Digital Luddites”, the least willing to migrate are nevertheless finally moving into the digital domain. Now the gap between expectation and reality is larger than ever.

Looking across the transaction life cycle, from search, apply, transact and service; universally the desire by households to engage digitally is now so compelling that banks have no choice but to respond more completely.

We also identified a number of compelling new services which consumers indicated they were expecting to see, and players need to develop plans to move into these next generation banking offerings. Many centre around bots, smart agents and “Siri-Like” capabilities.

We have developed a mud-map to illustrate the journey of investment and disinvestment in banking. The DFA Banking Innovation Life Cycle, which is informed by our research, highlights the number of current assets and functions which are in the slope of decline, and those climbing the hill of innovation.  A number of current “fixtures” in the banking landscape will decline in importance, and in relatively short order.

We are now at a critical inflection point in the development of banking as digital now takes the lead.  Players must move from omni-channel towards digital first strategies, where the deployment of existing services via mobile is just the first stage in the development of new services, designed from the customers point of view and offering real value added capabilities. These must be delivered via mobile devices, and leverage the capabilities of social media, big data and advanced analytics.

This is certainly not a cost reduction exercise, although the reduction in branch footprint, which we already see as 10% of outlets have closed in the past 2 years, does offer the opportunity to reduce the running costs of the physical infrastructure. Significant investment will need to be made in new core capabilities, as well as the reengineering of existing back-end systems and processes. At the same time banks must deal with their “stranded costs”.

The biggest challenges in this migration are cultural and managerial. But the evidence is clear that customers are already way ahead of where most banks are in Australia today. This means there is early mover advantage, for those who handle the transition swiftly. It is time to get off the fence, and on the digital transformation fast track. Now, banking has to be rebuilt from the bottom up. Digitally.

Request the report [44 pages] using the form below. You should get confirmation your message was sent immediately and you will receive an email with the report attached after a short delay.

Note this will NOT automatically send you our research updates, for that register here. You can find details of our other research programmes here.

[contact-form to=’mnorth@digitalfinanceanalytics.com’ subject=’Request The Quiet Revolution Report 3 – 2018′][contact-field label=’Name’ type=’name’ required=’1’/][contact-field label=’Email’ type=’email’ required=’1’/][contact-field label=’Email Me The Report’ type=’radio’ required=’1′ options=’Yes Please’/][contact-field label=’Comment if You Like’ type=’textarea’/][/contact-form]

The first edition is still available, in which we discuss the digital branding of incumbents and challengers, using our thought experiment.

Volume 2 from 2016 is also available.

ANZ adds eftpos cards to Android Pay

ANZ today announced the launch of Android Pay for eftpos cardholders, which means all its Australian customers can now easily make secure payments on their smartphone.

From today ANZ’s eftpos cardholders can access Android Pay to easily make secure purchases on their compatible device wherever contactless payments are accepted.

ANZ continues to lead the banking sector with its mobile payments services by delivering more options for customers than any other major Australian bank.

Commenting on the new mobile payment option, ANZ Managing Director Products Bob Belan said: “ANZ customers now have access to a complete suite of digital payment options regardless of which card or device they use.

“We’re committed to maintaining our leadership position in offering customers new, simple and convenient payment experiences so we’re pleased to provide our eftpos cardholders the option to now make purchases with their Android mobile device.”

To use their eftpos card on an Android device, cardholders simply need to download Android Pay from the Google Play Store and follow the prompts.

Is Peer To Peer Lending Mirroring Sub-Prime?

An interesting paper from the Federal Reserve Bank of Cleveland “Three Myths about Peer-to-Peer Loans” suggests these platforms, which have experienced phenomenal growth in the past decade, resemble predatory loans in terms of the segment of the consumer market they serve and their impact on consumers’ finances and have a negative effect on individual borrowers’ financial stability.

This is of course what triggered the 2007 financial crisis. There is no specific regulation in the US on the borrower side.  Given that P2P lenders are not regulated or supervised for antipredatory laws, lawmakers and regulators may need to revisit their position on online lending marketplaces.

While P2P lending hasn’t changed much from the borrowers’ perspective since 2006, the composition and operational characteristics of investors have changed considerably. Initially, the P2P market was conceived of as individual investors lending to individual borrowers (hence the name, “peer-to-peer”). Yet even from the industry’s earliest days, P2P borrowers attracted institutional investors, including hedge funds, banks, insurance companies, and asset managers. Institutions are now the single largest type of P2P investor, and the institutional demand is almost solely responsible for the dramatic, at times triple-digit, growth of P2P loan originations (figure 2).

The shift toward institutional investors was welcomed by those concerned with the stability of the financial sector. In their view, the P2P marketplace could increase consumers’ access to credit, a prerequisite to economic recovery, by filling a market niche that traditional banks were unable or unwilling to serve. The P2P marketplace’s contribution to financial stability and economic growth came from the fact that P2P lenders use pools of private capital rather than federally insured bank deposits.

Regulations in the P2P industry are concentrated on investors. The Securities and Exchange Commission (SEC) is charged with ensuring that investors, specifically unaccredited retail investors, are able to understand and absorb the risks associated with P2P loans.

On the borrower side, there is no specific regulatory body dedicated to overseeing P2P marketplace lending practices. Arguably, many of the major consumer protection laws, such as the Truth-in-Lending Act or the Equal Credit Opportunity Act, still apply to both P2P lenders and investors. Enforcement is delegated to local attorney general offices and is triggered by repeat violations, leaving P2P borrowers potentially vulnerable to predatory lending practices.

Signs of problems in the P2P market are appearing. Defaults on P2P loans have been increasing at an alarming rate, resembling pre-2007-crisis increases in subprime mortgage defaults, where loans of each vintage perform worse than those of prior origination years (figure 1). Such a signal calls for a close examination of P2P lending practices. We exploit a comprehensive set of credit bureau data to examine P2P borrowers, their credit behavior, and their credit scores. We find that, on average, borrowers do not use P2P loans to refinance pre-existing loans, credit scores actually go down for years after P2P borrowing, and P2P loans do not go to the markets underserved by the traditional banking system.1 Overall, P2P loans resemble predatory loans in terms of the segment of the consumer market they serve and their impact on consumers’ finances. Given that P2P lenders are not regulated or supervised for antipredatory laws, lawmakers and regulators may need to revisit their position on online lending marketplaces.


eftpos launches Android Pay for almost 2m ANZ and Cuscal customers

From ITWire.

eftpos payments are now available on Android Pay, with ANZ and Cuscal being “the first Australian financial institutions to make the service available to eftpos-only cardholders”.

eftpos acting chief executive Paul Jennings said eftpos on Android Pay would “provide eftpos mobile payments to cardholders, with secure access to their own money in real time and less likelihood of being surcharged”.

The service will use “Australia’s first domestic Token Service Provider (TSP) for increased security, by removing confidential consumer card data from the eftpos payment network and replacing it with a unique payment token”.

The eftpos TSP, which was built in partnership with Rambus, “enables eftpos to generate and manage its own payment tokens, facilitating secure digital payment experiences for eftpos cardholders”.

We’re told that the technology provides “additional benefits to consumers when faced with a lost or stolen mobile phone or card. The user is able to disable mobile payments quickly, without needing to cancel the physical card itself”.

ANZ and eight Cuscal-sponsored credit unions and banks are offering customers the choice of using eftpos on Android Pay, including People’s Choice Credit Union, Sydney Credit Union, Woolworths Employee’s Credit Union, CUA, Nexus Mutual, and FCCS.

Jennings said: “Almost two million cardholders will now have the capability to make eftpos payments on their Android mobile devices. This will bring the convenience of secure, in store mobile payments to many Australians for the first time.

“We are thrilled to team up with Google, ANZ and Cuscal to provide customers with access to their own money via their Android mobiles at the shops, with added benefits such as the ability to track their bank balances in real time.”

So, how do you use the service?

Cardholders simply need to download Android Pay at the Google Play Store and follow the prompts.

Pali Bhat, vice-president of Product Management, Payments, Google, said: “We’re excited to bring the security and simplicity of mobile payments via eftpos for Android device owners in Australia.

“Using Android Pay is more secure — and much faster — than rummaging through your wallet for a plastic card. That’s why we’ve worked with eftpos to enable Android Pay at almost 800,000 contactless payment terminals in Australia where people can seamlessly Tap & Pay with eftpos using their Android devices.”

Adding his comments on the new mobile payment option is ANZ managing director of Products, Bob Belan, who said: “This is great news for our eftpos cards customers who can now also use Android Pay to easily make secure payments at contactless terminals.

“Our customers are using mobile payments in growing numbers, and we are pleased be working with eftpos in offering this capability to even more ANZ cardholders before the end of the year.”

Cuscal’s general manager Product and Service, Robert Bell, said: “We’ve partnered with eftpos and Google to ensure that our clients’ eftpos cardholders now have the convenience of paying via their Android phones.

“This adds to our large portfolio of leading digital payment solutions. Cuscal enables multiple financial institutions to compete and lead in payments solutions. We provide our clients’ customers choice in the way they want to pay.”