Auction Clearance Up Just a Bit

From CoreLogic.

There were 3,409 homes taken to auction across the combined capital cities this week, returning a preliminary auction clearance rate of 66.9 per cent, overtaking last week as the third busiest week for auctions so far this year. Last week, based on final results, 60.9 per cent of the 3,390 auctions held recorded a successful result, the lowest clearance rate since late 2015/early 2016.

Once final results are collected, the combined capital city clearance rate tends to revise down so at this stage it’s looking like the final clearance rate on Thursday will be in the mid to low 60 per cent range for the sixth week in a row. Sydney and Melbourne, the two largest auction markets, have seen clearance rates increase week-on-week after last week saw both cities recording their lowest clearance rates for the year so far, however as usual, these clearance rates will revise lower over the week. Over the same week last year, a total of 3,398 homes were taken to auction across the combined capital cities, and a clearance rate of 73.0 per cent was recorded.

2017-11-27--auctionresultscapitalcities

China to tighten regulations on financial firms’ shareholding

From Moodys

On 16 November, the China Banking Regulatory Commission published for public comment a draft regulation on commercial banks’ shareholding. The draft regulation raises the bar for investor qualification, demands the long-term commitment of significant shareholders’ (those owning a 5% or greater stake) investment, and requires annual disclosures of significant shareholders and related parties. The proposed regulation is credit positive for China’s financial firms because it will limit the systemic transmission of financial risks, improve the quality of the firms’ capital and strengthen their corporate governance.

The draft regulation will serve as a benchmark for regulating non-bank financial institutions including rural credit cooperatives, trust companies, financial leasing companies, automobile and consumer finance companies, and financial asset management companies, which are a type of specialist firm that works out nonperforming financial assets. More stringent investor qualifications include a ban on leveraged acquisition of shares, in line with the authorities’ policy priority of deleveraging the financial system and the real economy. In addition, the draft regulation will limit system interconnectedness by restricting any investor from becoming a significant shareholder of more than two banks or a majority shareholder of more than one bank.

The draft regulation also raises the entry barrier for significant shareholders by setting up a prior-approval process to screen out investors that have overdue bank debts or outstanding court judgments against defaults. Investment pools such as funds, insurance asset-management plans or trust plans cannot own more than 5% of a bank if they are ultimately controlled by a single entity. The higher barrier will diversify the investor base for banks and reduce system interconnectedness. The tighter ownership rules are particularly relevant for rural commercial lenders, which are transforming themselves to commercial banks from mutual institutions of credit cooperatives (see Exhibit 1).

In the banking regulator’s view, there is abundant capital to invest in bank shares, attracted by the sector’s higher profitability. As Exhibit 2 shows, rural commercial banks have had profitability and capital metrics second only to China’s big five banks.


Securing quality capital will improve banks’ creditworthiness. The draft regulation will improve the quality of capital that banks receive from significant shareholders by annually certifying a shareholder’s ability to inject capital into investee firms in times of need. The draft regulation also requires a five-year lockup period of significant shareholders’ investment to protect banks’ ability to create long-term value.

Additionally, the draft regulation tightens the enforcement of existing rules on connected-party transactions by expanding the scope of the rule. Emphasizing a “see-through” principle to improve disclosure on the ultimate beneficiaries of shareholding, the draft regulation specifies connected parties include investors’ controlling shareholder, actual controlling entity, affiliated entities, entities acting in concert and ultimate beneficiaries.

Mutuals Growing But Under Competitive Pressure

KPMG has released their 2017 Mutuals Industry Review. Under the hood, the sector is under pressure, despite asset growth. COBA said they welcome the backing from KPMG, which highlighted strong financial performance. We are not so sure.  Sure, assets are growing, but at what cost?

This is what COBA said:

KPMG Australia’s Mutuals Industry Review 2017 found strong balance sheets, asset growth and home loan lending growth as more Australians respond to the customer owned difference.

“We welcome KPMG’s analysis that customer owned banking offers a compelling and strong alternative,” COBA Acting CEO Dominic Dunn said.

“The review notes our strong performance in a challenging operating environment.

“Importantly it found that banking competition reforms will help the customer owned sector continue to grow and offer more products and services to more Australians.

“We particularly highlight the perspective on our sector’s investment in new and emerging technology. As KPMG points out:

“…six of the top 10 mutuals already partner with the Apple Pay, Android Pay and Samsung Pay systems, compared to just one of the majors. New opportunities for collaboration, the arrival of the New Payments Platform, and the growth of Australia’s fintech sector will open up new doors for mutuals as they concentrate on attracting the next generation of consumers.”

“Our sector was also acknowledged in the report for its investment in new mobile offerings, refreshed web design and improved digital experience.

“Customer owned banking institutions collectively have four million customers and $108 billion in total assets and deliver an unmatched customer focus to the banking market.

“Today’s annual review from KPMG is further evidence of why consumers should consider switching to a customer owned banking alternative.”

However, it is worth looking at the detail in the report. KPMG says:

Profits before tax (PBT) declined by 4.3 percent (2016: grew 3.1 percent) to $605.7 million (2016: $633.0 million). This compares to the major banks which saw profits grow by 7.6 percent. The top 10 had a combined profit before tax of $425.5 million, down from $434.5 million in 2016. This represents 70.2 percent (2016: 68.6 percent) of PBT earned by mutuals. The mutuals sector is continually challenged to maintain profitability in the highly competitive banking environment.

Mutuals reported total net interest income of $2,150.3 million in 2017 (2016: $2,080.0 million). Of this, 64.5 percent was earned by the top 10 (2016: 63.9 percent).

The net interest margin (NIM) continued to tighten and decreased to 2.03 percent (2016: 2.14 percent). The increasing pressures on net interest margin is a result of historically low interest rates and increasing competition in the marketplace. As such, mutuals have sacrificed margins to maintain and grow the membership base.

The NIM for the top 10 fell by 9 bps (2016: 3 bps) to 1.93 percent (2016: 2.02 percent), whereas the NIM for the majors has remained relatively stable at 2.01 percent in 2017.

Given their limited access to wholesale funding sources, retail deposits remain an important funding source for mutuals – almost the sole source. 2017 saw mutuals grow their deposit base by 10.5 percent (2016: 7.9 percent) to $87.3 billion (2016: $79.1 billion). This was above system growth of 6.0 percent and above the majors’ growth of 5.4 percent. This result reflects the continued focus by mutuals towards membership acquisition, achieved through competitive product and service offerings to raise funds from household deposits. This has been made possible by investing in technology and delivering enhanced customer experiences.

The average capital adequacy ratio dropped 30 basis points (2016: 40 basis points) to 17.2 percent (2016: 17.5 percent) in 2017, representing a decline in capital levels for the fourth consecutive year. This reflects the increasing prioritisation of effective capital use by mutuals. As limited equity funding is inherent within the mutuals’ current business model and capital growth through new profits have been constrained this year, mutuals have looked to existing capital bases to fund balance sheet growth.

Despite greater capital utilisation, mutuals have continued to maintain capital levels significantly in excess of APRA’s minimum requirements of 8 percent. Earlier this year, APRA announced requirements for ‘unquestionably strong’ capital adequacy ratios which will see ADIs using the internal ratings-based (IRB) approach raise minimum capital requirements by approximately 150 bps from current levels, by 2020. ADIs using the standardised approach to capital adequacy are expected to raise minimum capital requirements by approximately 50 bps over the same period. While this action improves resilience in the banking industry on a macro level, it also brings the majors and mutuals closer on the playing field. There is an opportunity for mutuals to take the market share lost by the majors, should the majors increase interest rates in response to APRA’s new capital settings during the transition period.

2017 saw mutuals increase their loan provisions by 13.0* percent to $63.3 million (2016: $56.0 million). This was in response to heightened risk in the operating environment as interest rates remain low and housing affordability continues to decline. These sentiments have been shared across the industry with Standard & Poor’s (S&P) recently downgrading the credit ratings of 23 ADIs, 13 of which were mutuals, due to concerns over a rise in significant credit losses arising from the risk of sharp corrections in property prices.

Total loan write-offs of $29.2 million (2016: $29.0 million) remained largely the same as last year, up 0.7 percent from 2016. Looking ahead, we expect to see larger and more volatile provisions for loan impairment on balance sheets, as mutuals implement an expected credit loss model with AASB 9 Financial Instruments coming into effect on 1 January 2018.

* Impairment provisions exclude the impacts of early adoption of AASB 9 Financial Instruments.

One final observation. KPMG said, from their survey:

  • Don’t close branches just yet: 45 percent of respondents still want to apply for a home loan at a branch.
  • Digital reigns supreme for research and servicing home loans: 87 percent of
    respondents indicated that digital channels are their preferred choice for researching and servicing their home loan.

This is out of kilter with our research, which may indicate a demographic and technographic skew of Mutual customers. The future is clearly digital and home loans are not immune!

78% of Australians say prices won’t fall

From Mortgage Professional Australia.

Nearly four out of five Australians don’t see house prices falling in their state over the next two years, according to a new report by comparison site CANSTAR.

CANSTAR surveyed 2,026 consumers on their views on property prices and home buying. Nationally, 47% of respondents expected steady growth in house prices, with a further 8% predicting prices would ‘skyrocket at some point’.

Just 11% of respondents thought prices could fall in the next two years.

Even in Perth, where according to CoreLogic, values fell 2.5% over the past year, just 7% of respondents thought prices could fall. Conversely, 37% of Perth respondents believed prices could rise.

Sydney was the most pessimistic city, with 16% predicting values would fall. CANSTAR’s results were timely, with the Harbour City experiencing a quarterly decline of 0.6% in October.

Are Australians just naive?

With many Australians preparing to invest in property, driven by optimism on house prices, CANSTAR’s results may be cause for concern.

QBE recently published their 2017-2020 Housing Outlook, which predicted that the price of units would fall in four of Australia’s capital cities.

Unit prices in Sydney would fall by 3.8% over the three years, with units in Melbourne and Brisbane falling by 4.8% and 7.2% respectively.

However, house buyers are far better placed, with falls only predicted for Sydney and Darwin.

Why Paper Statements Must Be Free

The Treasury released a request for submission relating to the thorny issue of digital exclusion, and specifically the fact that some companies, in a drive to digital first, are starting to charge consumers to continue to receive paper bills, for services such as utilities. There is already legislation in some other countries to protect consumers from this.

The Treasury suggest a range of options:

  • Option 1 — the status quo, with an industry led consumer education campaign;
  • Option 2 — prohibition (ban) on paper billing fees;
  • Option 3 — prohibiting essential service providers from charging consumers to receive paper bills;
  • Option 4 — limiting paper billing fees to a cost recovery basis;
  • Option 5 – promoting exemptions through behavioural approaches.

As we discussed last week, they suggest 1.2 million households are digitally excluded by not having access to the internet.

The Keep Me Posted Lobby Group (who contacted me after last week’s post)  advocates there should a ban on paper billing fees.

“We clearly stated Keep Me Posted’s position to support a total ban on all billing fees, which is option 2 of the consultation paper,” said Kellie Northwood, Executive Director, Keep Me Posted.

To add weight to be debate we wanted to make two points.

FIRST – the Treasury estimate understates the number of households who are digitally excluded and so more would be potentially hit by excess bill charges.

SECOND – we believe option 2 – ban fees is the right option.

How Many Households Are Digitally Excluded?

We use data from out rolling 52,000 household surveys across Australia.

The result suggests that it is not just access to the internet which is an issue, but there are some households who just are unwilling or unable to use the internet. In fact the Treasury’s estimate of the number of households impacted is understated.

We segment households, digitally speaking into three group.

  • DIGITAL NATIVES: Households who are naturally digital, using mobile devices, constantly online and using social media, often using multiple devices including tablets and smart phones.
  • DIGITAL MIGRANTS: Households who are moving from terrestrial services to digital, taking up smart devices and learning to access social media and other online services.
  • DIGITAL LUDDITES: Households who prefer terrestrial services, but who are now starting to migrate online and are reluctantly adopting the new paradigm. In many cases they are unwilling or unable to migrate.

We also use our master household segmentation, which is based on multi-factorial geo-demographic and behaviourial  analysis, though based on our rolling 52,000 household survey.

The results show that Digital Luddites are predominately in the older and  less wealthy households, including Stressed Seniors, those living in the disadvantaged fringe areas around our major cities, those in a rural setting, and those from non-English speaking ethnic backgrounds.  Count up all the Digital Luddites and it comes to 27% or 2.6 million households.

We can examine the splits by age bands, and confirm that older households are more likely to be in this group.

Analysis by income band highlights that significantly more are in the lowest income range, including many on pensions and Government support.

We were able to examine the barriers which were driving households into the Luddite group.  We found that whilst 7% (around 170,000) are likely to migrate to digital channels, if slowly; 36% (around 911,000) households did not have access to the internet, or usable device; 17% (around 430,000) had no inclination to go digital, even if they could; 22% did not have the technical capability – could not operate a smart phone, did not know how to get to connect to the internet – (around 557,000); and 18% (around 463,000) did not have the physical capability (thanks to disability or other factors).

Stripping back the analysis to a financial capability (did they have the funds to purchase a device, internet access etc), then we estimate 54% of Luddites were impacted by these economic factors, or 1.36 million households.

We believe therefore the Treasury estimate of the number of households impacted by digital exclusion is understated.  This adds more weight for intervention.

The Right Choice Is: Option 2 – Fees Should Be Banned

Companies are clearly able to save money if they can stop sending out paper versions of statements, and rely on customers to receive online notification and then retrieve their statements. This economic driver is understood, though most often the initiate will be dressed up as “environmentally friendly”, or  “more convenient”.  It appears though that savings are not passed back to consumers directly, but flow into general funds.

Our research suggests that a considerable number of households are unable to go digital. Thus they risk having additional fees and charges imposed on them, with no mitigating option. This is in effect a price rise. Whilst education, and communication to households may assist some, many are not able to migrate. These are the least wealthy, older and more exposed households. This is not equitable.

In some cases it appears charges for bills are significantly higher than the incremental charge based on an estimate of what the incremental cost should be, and in any case, experience from the banking sector highlights suggests it is difficult to get a definitive incremental estimate of the cost of a bill.  We think restricting the acceptable charge to cost to recovery, is complex, cannot be audited, and offers too much wriggle room.

We cannot support the differentiation between essential and non-essential services, not least because the threshold would potentially vary by household circumstance, and we cannot see a justification for charging for paper billing in some circumstances, but not others.

Therefore charges for paper billing should be banned.

Companies would be welcome to offer discounts to those receiving electronic delivery (although the ACCC may have to ensure that overall costs of service are not lifted to facilitate the subsequent discounting!)

We will be making this submission to Treasury.


Inclusion of IFRS 9 accounting will toughen EBA’s 2018 banking stress test

Moody’s says on 17 November, the European Banking Authority (EBA) set out its draft methodology for a new round of stress tests that the European Union’s 49 biggest banks must undergo next year. The inclusion of IFRS 9 will lower Tier 1 equity, under stress by an estimated 50-60 basis point.

Similar to the 2016 stress tests, the 2018 exercise will examine banks’ resilience to both base-case and stressed-case scenarios over a three-year horizon, based on a common methodology and prescribed macro-economic scenario parameters. The EBA test will again abstain from setting a minimum capital threshold below which a bank would fail, as in 2014. However, even without set hurdles, the market will benchmark the adverse scenario results, expressed in stressed capital ratios, against banks’ minimum capital requirements, and thereby single out the weaker performers.

The first-time inclusion of International Financial Reporting Standard 9 (IFRS 9), a new accounting rule that takes effect 1 January 2018, will make next year’s stress test tougher than the last one and will likely translate into greater provisioning needs and therefore lower common equity Tier 1 ratios in the prescribed stress-case scenario. The new rules demand that banks set aside higher loan-loss provisions further in advance of default, which is credit positive for banks. While we expect that the initial effect of IFRS 9 will be limited, and therefore digestible for most EU banks, risk provisioning requirements under simulated stressed market conditions will likely be greater using the IFRS 9 rules. However, the size of provisioning will also strongly depend on the macroeconomic scenario assumptions that have yet to be published.

Our expectation of a limited initial effect of IFRS 9 is based on our projection of a 50-60 basis point decline in the ratio of common equity Tier 1 to risk-weighted assets for many European banks. However, we also expect that the initial effect will vary across regions. When additionally taking into account varying stating-point capital levels, capital ratios of banking systems starting from a weak position, including Italy and Portugal, are more at risk of stressed capital ratios falling closer to (or even below) the applicable minimum requirements (see Exhibit 1).

In the EBA’s 2018 stress test, the initial effect on capital ratios will likely be amplified when simulating stressed economic conditions. Europe’s weaker banking systems with relatively large but still performing portfolios that have deteriorated over time will experience greater capital effects under the new rules than banks that benefitted from systemwide asset quality improvements amid benign credit conditions in recent years. Such quality improvements have resulted in low nonperforming exposures in a number or European countries, including France, Germany and the UK (see Exhibit 2).

The objective of the 2018 stress test is to assess the resilience of EU banks and banking systems to shocks. The results will inform the supervisory review and evaluation process, the European Central Bank’s annual in-depth evaluation of each bank’s risk exposure. This evaluation forms the basis of the regulators’ decisions on bank-specific minimum capital requirements for the subsequent year

Budget 2017 fails to reset or rebalance anaemic UK economy

From The Conversation.

Given the May government’s weakness and instability, and the ongoing toxic, Brexit-laced personal and political divisions within the cabinet, not much was expected from Philip Hammond’s Autumn 2017 budget. He did not disappoint.

During a rambling, hour-long speech of nearly 8,000 words, weak jokes torturously delivered were interspersed with a raft of policy announcements whose sum total fell far short of resetting UK economic policy away from austerity. This was not a budget to redress the “burning injustices” and interests of the “just about managing”, which the prime minister once promised would be the mission of her government.

Hammond’s announcements fell far short of the £4 billion in investment required to redress the impact of a lost decade of cuts in welfare, including the freeze on benefits. Or the £4 billion required to maintain services in the National Health Service in England in 2018-19. And little to redress the financial unsustainability of England’s schools or its local government.

Hammond’s statement announced token investment in driverless vehicles, but onlookers could be forgiven for thinking that this was the anaemic budget of a driverless government. Like his next-door-neighbour in 10 Downing Street, Hammond lacks the necessary gumption to lead the UK economy at this critical juncture.

The Autumn 2017 budget represented the opportunity to make good Hammond’s July 2016 promise “to reset fiscal policy if we deem it necessary to do so in the light of the data that will emerge over the coming months”. The data that has emerged subsequently should have convinced him that the time for a reset was long overdue. Austerity has clearly failed to revive the British economy and there is an urgent need to prepare businesses – and not just government departments – for Brexit.

Rising debt

Austerity – the notion of balancing the books by cutting spending – has singularly failed to rebalance the nation’s finances. Since Hammond’s appointment as chancellor, a further £176 billion has been added to the UK’s public sector net debt, which now stands at more than £1,790 billion. This has maintained the pattern since May 2010, which has seen the Cameron-Clegg coalition’s “unavoidable deficit reduction plan” add £772.5 billion to public sector net debt.

The budget now forecasts that in 2022-23, public sector net debt will still be £1,909 billion or 79.1% of GDP, and the government will be borrowing £25.6 billion or 1.1% of GDP.

This is contrary to what Hammond’s predecessor George Osborne promised would have been achieved by 2015-16. When the Conservatives came into government in June 2010, Osborne promised “to raise from the ruins of an economy built on debt a new, balanced economy where we save, invest and export”.

That new, balanced economy has proven to be a fiction. In 2016, the UK ran a record current account deficit of £115.5 billion, equivalent to 5.9% of GDP, and a trade deficit of £43 billion, equivalent to 2.2% of GDP.

There was little in the latest budget to reverse these trends. Instead, the independent Office for Budget Responsibility (OBR) downgraded its forecasts for real GDP growth between 2017-18 and 2021-22 from 7.5% to 5.7%. The British economy is now forecast to grow by less than 2% in each year of the current parliament, and, as the OBR also noted, this contrasts with “a pick-up in other advanced economies”.

Storing problems for the future

The budget concluded with a raft of announcements to address the housing crisis in England, including the abolition of Stamp Duty on properties up to £300,000. This was Hammond’s crowd-pleasing rabbit out of the hat. But the OBR has observed that “the main gainers from the policy are people who already own property” rather than first-time buyers, and will likely push up prices, thus making properties less affordable.

Official government statistics have revealed that over the past 20 years, land values have increased by 479% and property values by 203%. The latest budget has done nothing to reverse these trends towards investment in property and rent-seeking, rather than in the real economy of businesses.

David Willetts, who until May 2015 was complicit in the implementation of austerity, as a cabinet minister in the Cameron-Clegg coalition government, recently warned:

We are reshaping the state and storing problems for the future by creating a country for older generations. The social contract is a contract between the generations and in Britain it is being broken.

The truth is more stark than that. Philip Hammond’s failure to reset UK economic policy by perpetuating fundamentally flawed austerity policy means the May government is reshaping the state and storing problems for the future by creating a country for older, rentier and asset-rich interests. This risks breaking down the political contract between the governing elite at Westminster and the people of Britain.

Author: Simon Lee , Senior Lecturer in Politics, University of Hull

Auction Results 25 Nov 2017

The preliminary results are in from Domain.  Melbourne continues to run ahead of Sydney, with rates in the mid 60’s, significantly below this time last year. Typically the final results are lower.  More evidence of a cooling market, so expect prices to move lower.

Brisbane cleared 59% of the 119 scheduled auctions, Adelaide 61% of 106 and Canberra 67% of 99 scheduled.

How Far Are Home Prices Going Down? – The Property Imperative Weekly 25 Nov 2017

Home prices are more to do with sentiment that fundamental economics, and this week we saw new data, so are home prices on their way down?

Welcome to the Property Imperative weekly to the 25 November 2017. Watch the video, or read the transcript.

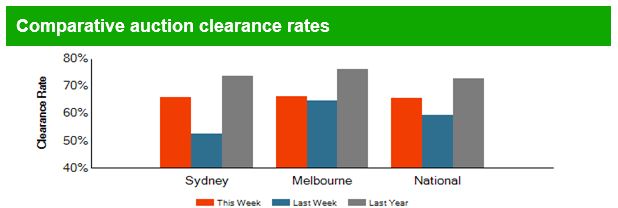
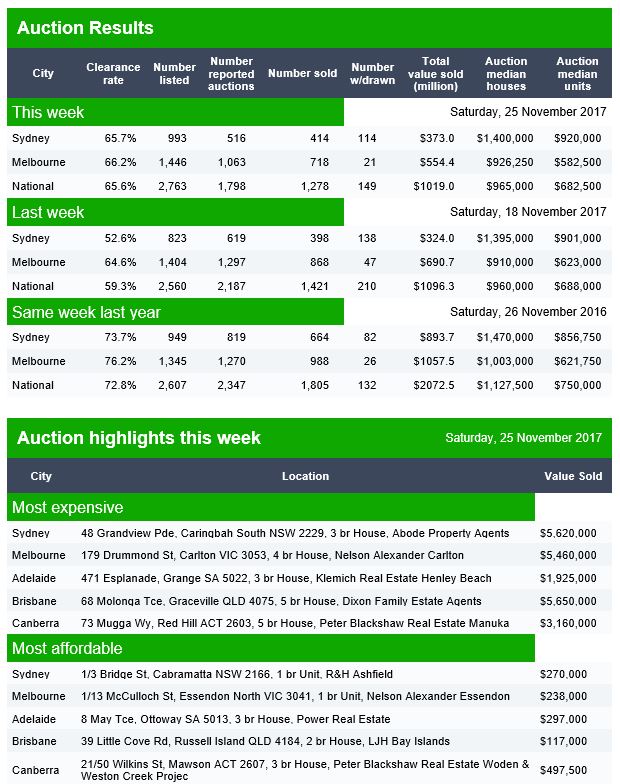
We start this week’s digest of finance and property news noting that Auction clearance rates continue to drift lower, especially in Sydney and home prices are easing back as the supply/demand equation changes.

CommSec said the average floor size of an Australian home (houses and apartments) has fallen to a 20-year low, with the typical new home now 189.8 square metres, down 2.7 per cent over the past year and the smallest since 1997. Though Australians continue to build some of the biggest houses in the world, an increasing proportion of Australians – especially in Sydney, Melbourne and Brisbane – also want smaller homes like apartments, semi-detached homes and town houses. Generation Y, Millennials, couples and small families want to live closer to work, cafes, restaurants, shopping and airports and are giving up living space for better proximity to the desirable amenities. CBA also make the point that since 2014 the number of people per dwelling has been falling. Lower interest rates and the increased supply of cheaper apartments (compared with houses) have prompted older couples to down-size. More Generation Y have been looking to move out of home and take ownership of accommodation more appropriate to their needs.

Also on the supply/demand property equation was an important study from the ANU. The Government view is high home prices is ultimately driven by lack of supply, relative to demand, including from migration. So the solution is to build more (flick pass to the States!). It has nothing to do with excessive debt, nor does the fact the average number of people per home is falling signify anything.  And tax policy is not the problem. But the working paper “Regional housing supply and demand in Australia” from the ANU Center for Social Research and Methods, blows a mighty hole in that mantra.  They suggest that demand factors (availability of loans, tax concessions etc.) have a significant impact, while demand and supply equilibrium varies significantly across different regions, with some hot spots, and some where vacant property exists (yet prices remain high, because of these demand factors). Significantly, much of the surplus is in areas where high-rise development has been strong. We think this may signal further downward pressure on prices in areas like Central Sydney, Melbourne and Brisbane as well as Townsville and Cairns. On the other hand, there is a shortage of property in Adelaide, and some outer suburban areas.

Wayne Byers, APRA Chairman spoke at the Australian Securitisation Forum 2017.  Household debt is high, and continues to rise he said. He identified three mortgage related risks. First, the trend in non-performing housing loans is upward, despite a relatively benign environment for lenders. In fact the overall rate of non-performing housing loans is drifting up towards post-crisis highs, without any sign of crisis and when rates are ultra low.

Second, while the upward trend in low Net Income Surplus (NIS) lending appears to have moderated over the past few quarters, a reasonable proportion of new borrowers have limited surplus funds each month to cover unanticipated expenses, or put aside as savings.

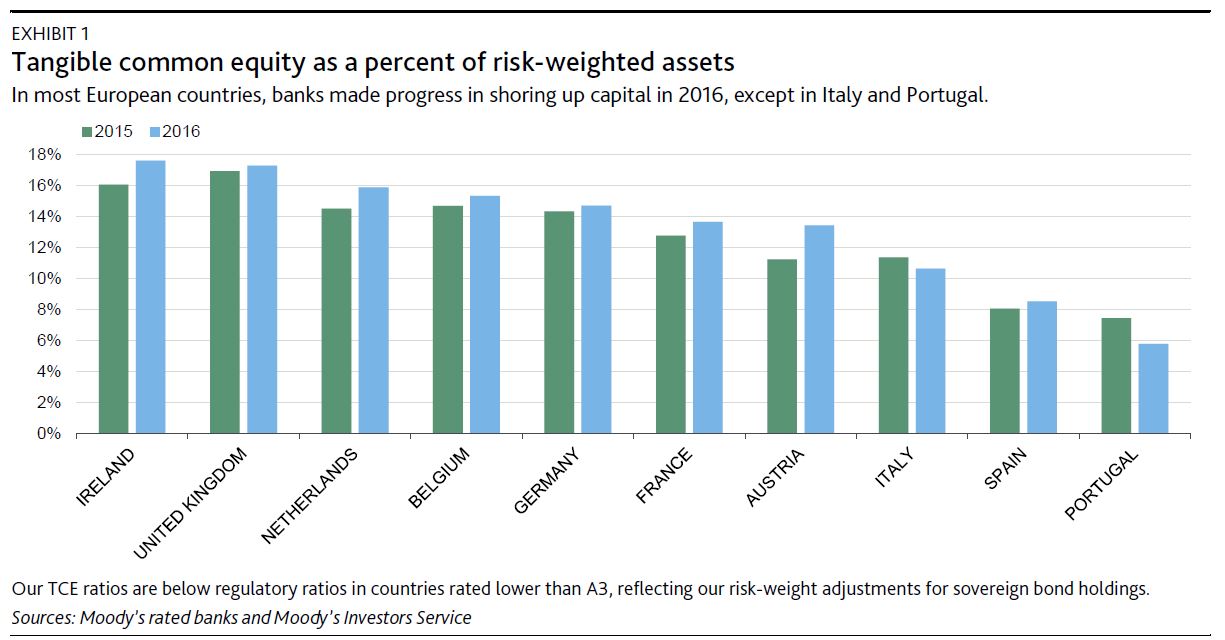
Third, there is only a slight moderation in the proportion of borrowers being granted loans that represent more than six times their income. As a rule of thumb, an LTI of six times will require a borrower to commit 50 per cent of their net income to repayments if interest rates returned to their long term average of a little more than 7 per cent. High LTI lending in Australia is well north of what has been permitted in other jurisdictions grappling with high house prices and low interest rates, such as the UK and Ireland.

So, APRA finally acknowledge there are risks in the system and is finally looking at LTI. Better late than never…! LVR is not enough.   He also called on the finance industry to “devote more effort to the collection of realistic living expense estimates from borrowers” and give “greater thought” to the appropriate use and construct of benchmarks”.

So how big is the problem? Well, the long data series from the Bank for International Settlements comparing household debt to GDP shows that Australia sits at the top of the international list after Switzerland at 122%. Australian households are wallowing in debt (no wonder mortgage stress is so high), even relative to Canada (where home prices have now started to fall), Hong Kong (where prices are in absolute terms higher), and New Zealand (where the Reserve Bank there has been much more proactive in tacking the ballooning debt). Ireland is still trying to deal with the collapse which followed the GFC in 2007 and they have registered a significant plunge in debt.

Another BIS series, trends in home prices, updated this week, shows Australia is near the top in terms of growth, relative to other western countries, including UK, USA, Canada and New Zealand. There is an important lesson in this data. If prices do crash it can take significant time to recover. Home prices in Ireland, which peaked in 2007, 10 years later are still well below the peak – a salutatory warning.  USA prices have now just passed their pre-GFC peak and the UK achieved this in 2014! The fallout from home price falls cast a long shadow. The fall in prices took on average 5 years from their peak to the subsequent trough. A warning that if Australian prices slide, they could do so for many years.

The IMF issued a warning this week, based on their latest Australian visit. They warn that growth will be modest, more effort is required to contain housing risks – including macroprudential, and a structural reform agenda is required to lift productivity and growth. They say near-term risks to growth have become more balanced, but large external shocks, including their interaction with the domestic housing market, are an important downside risk.  The housing market is expected to cool, but imbalances—lower housing affordability and household debt vulnerabilities—are unlikely to be corrected soon. Declines in household debt-to-income ratios would need to be driven by strong nominal income growth and amortization. They are however, stuck on the supply-side policy mantra as the most effective approach to achieving housing affordability in the longer term.

The RBA had a good trot this week, with Head of Financial Stability Jonathan Kearns, saying the Bank has responsibility to promote the stability of the financial system as a whole so carefully monitors property markets because poor commercial property lending and the large stock of residential property debt means risks to financial stability and household resilience. The high valuation of commercial property increases the potential for a sharp correction and so the risks from commercial property lending. The high level of household mortgage borrowing also brings risks, both for lenders and households. He also discussed the impact of purchases and financing by foreigner investors and banks.  Nationally, purchases by foreign buyers are equivalent to around 10-15 per cent of new construction, or about 5 per cent of total housing sales. He said, these purchases by foreign buyers do not, on the whole, reduce the supply of dwellings available to local residents and in fact may actually contribute to expansion of the housing stock  – though such purchases by foreign buyers, particularly for investment purposes, are a more recent phenomenon and so their impact on the housing cycle is less clear.

Marion Kohler, Head of Domestic Markets Department, RBA, explored more from their mortgage Securitisation Dataset. There were two insights. First the LVR distribution is highest at 80% (which is skewed because of the securitisation rules), but her claim “on average, securitised loans appear to be no riskier than the broader population of mortgages, was unproven. Second there was some interesting commentary on mortgage rates, with interest-only loans now significantly higher. There is now a greater proportion of principal-and-interest loans with an interest rate below 4 per cent, due to the lower rates applied to owner-occupier loans, and there has reportedly been increased competition for these types of loans. She did not discuss the critical Loan to Income ratios, which should be available in the data!

Finally, RBA Governor Philip Lowe spoke at the Australian Business Economists Annual Dinner.  Essentially, the conundrum of low inflation and wage growth, despite better employment means the cash rate will stay lower for longer, though the next move is likely up. High household debt is less about risks to the banking system and more about medium term financial stability, especially as rates rise.  Household spending will remain muted. GDP is forecast to be higher because the fall in mining investment has ended, even if other business investment is still low. He also highlighted the bank keeps overestimating future consumption growth. Finally, he said that it is important to be clear that the RBA does not have a target for housing prices. But a return to more sustainable growth in housing prices does reduce the medium-term risks.

A report by Bloomberg says the party is finally winding down for Australia’s housing market. How severe the hangover is will determine the economy’s fate for years to come. After five years of surging prices, the market value of the nation’s homes has ballooned to A$7.3 trillion — or more than four times gross domestic product. Not even the U.S. and U.K. markets achieved such heights at their peaks a decade ago before prices spiralled lower and dragged their economies with them. The report cited UBS economists’ declaration that “Australia’s world-record housing boom is officially over, and the cooling may be happening a bit more quickly than even we expected.”

The risk is that it leaves the Australian economy extremely exposed, and a minor shock could become far more significant,” said Daniel Blake, an economist at Morgan Stanley in Sydney. While the RBA is satisfied that lenders have adequate buffers to cope with any downturn, banks may find it harder to value their collateral in a falling market as investors look to consolidate their portfolios of multiple homes.

Now reflect on this, more than half of all dividends in Australia come from the banks. Data from the latest Janus Henderson Global Dividend Index  reveals that Australia’s banks pay $6 out of every $11 of the country’s dividends each year but dividends are growing slowly given already high payout ratios. Leading is Commonwealth Bank which raised its per share payout 3.7 per cent on the back of steady profit growth, but National Australia, Westpac and ANZ all held their dividends flat. CBA and Westpac were identified in the report as the world’s fourth and sixth biggest dividend payers respectively, with Chinese and Taiwanese technology and manufacturing companies taking the top three place. Much of the dividends in Australia comes from mortgage lending.

Standing back, home prices have been rising thanks to high local and foreign demand, and from investors who believe in yet higher prices ahead. But now the evidence is mounting that sentiment is changing, demand is easing (and as lending standards get tightened) and low wage growth in rising and living costs bite. Our household surveys picked this up a few weeks back, and now there is also more awareness of the risks from higher rates ahead.

So we think prices are set to slide further, with Sydney leading the way. Brisbane will follow, but there may be a little more momentum in Melbourne. All the economic data points in the same direction, and our modelling suggests a fall of 20% or more is possible, over the medium term. If we are lucky, the easing will be gentle, but could last for perhaps 5 years, but there is also a risk of a bigger fall sooner. This would create a negative feedback loop which would reduce growth and hit the banks hard. No wonder then many with vested interests in property still want to talk the market up, but the fundamentals don’t lie. It’s not now a question of if, but when, and how far home prices will fall.

That’s the Property Imperative weekly to 25 November 2017. If you found this useful, do leave a comment below, subscribe to receive future updates and check back again next week. Thanks for taking the time to watch. See you next time.

Distracted: Is Digital To Blame For Low Productivity?

From Bank Underground.

Smartphone apps and newsfeeds are designed to constantly grab our attention. And research suggests we’re distracted nearly 50% of the time. Could this be weighing down on productivity? And why is the crisis of attention particularly concerning in the context of the rise of AI and the need, therefore, to cultivate distinctively human qualities?

Are we losing our attention?

In a world of information overload, what do we pay attention to?

This question has become increasingly relevant in the digital age. With the rise of smartphones in particular, the amount of stimuli competing for our attention throughout the day has exploded. A survey from 2013 found that we check our phones 150 times per day, or roughly once every 6½ mins; a more recent study found that the average smartphone user spends around 2½ hours each day on his or her phone, spread across 76 sessions.

In the context of this huge cultural shift, our attention emerges as a scarce and valuable resource and the ‘attention economy’ has become a growing area of study. Some models seek to explain how we allocate our attention online. The theory of rational inattention, meanwhile, starts with the assumption that information is costly to acquire, hence decision-makers may rationally take decisions based on incomplete information.

Another line of enquiry, and the focus for this post, stems from the claim that we are more distracted than ever as a result of the battle for our attention. One study, for example, finds that we are distracted nearly 50% of the time. This ‘crisis of attention’ is seen as one of the greatest problems of our time: after all, as the American philosopher William James noted, our life experience ultimately amounts to whatever we had paid attention to.

Might the crisis of attention be affecting the economy? The most obvious place to look would be in productivity growth, which has been persistently weak across advanced economies over the past decade (during which time, as it happens, global shipments of smartphones have risen roughly ten-fold).

How might distractions be weighing down on productivity?

The intuition is simple enough: our minds comprise the bulk of our human capital and what we direct our attention towards is integral to the ‘output’ of our mental activity. You would therefore expect the ability to pay attention to be a key input into productivity.

In the vast literature on the determinants of strong performance in the workplace, some studies consider the role of attention. But there is little linking these to productivity in the economy as a whole. Partly this is because observing inner states (attention) and mapping these to outcomes (productivity), taking account of other relevant factors, is inherently tricky.

Yet there is mounting research that can help us start to address this question. My aim here, rather than giving a definitive answer, is to set out a framework for thinking about this issue. My contention is that distractions at work – whether from work emails, smartphone notifications or office noise – might cause weaker productivity via two main channels.

Channel 1: The direct impact of distractions on the amount of effective time spent working

Surveys offer estimates of the time workers spend ‘cyberslacking’ – using the Internet and mobile technology during work hours for personal purposes. The US Chamber of Commerce Foundation finds that people typically spend one hour of their workday on social media – rising to 1.8 hours for millennials. Another survey, meanwhile, found that traffic to shopping sites surged between 2pm to 6pm on weekday afternoons.

The total lost time will likely be greater than the time spent slacking off, however, since office workers typically take around 25 minutes to recover from interruptions before returning to their original task. What’s more, distractions can directly reduce the quality of our work . An influx of emails and phone calls, for example, is estimated to reduce workers’ IQ by 10 points – equivalent to losing a night’s sleep.

Channel 2: Persistently lower productivity caused by habitually distracted minds

The idea here is that frequent distractions might lead to a persistently lower capacity to work, over and above the direct effects. What is the argument for this being the case?

First, there’s habit formation. As James Williams notes, distracted moments can quickly lead to distracted days. And our habits are shaped by the way that consumer technologies, such as smartphone apps, are designed to be as addictive as possible – to ‘hijack the mind’, as Tristan Harris puts it. Harris gives examples like the bottomless scrolling newsfeed, which is designed to make you want to scroll further in case something good turns up. The psychological mechanism at play here – “intermittent variable rewards” – is the same as the one that gets people hooked on slot machines.

In the workplace, there’s some evidence that distractions cause more distractions. Mark (2015) finds that workers who get interrupted by external stimuli (eg message notifications) are significantly more likely to later go on to ‘self-interrupt’ – stop what they’re doing and switch to something else before reaching a break point. In other words, if you keep getting distracted by external stimuli, your mind’s more likely to wander off on its own accord.

Second, the more we have different sources of notifications in the workplace competing for our attention, the more we’ll constantly scan different channels in an attempt to stay on top of things. The problem is that this mode of working – termed “continuous partial attention” – serves to fragment our attention, reducing our focus on the task at hand. In effect, this is a variation on multitasking – which is widely discredited as an effective mode of working. Cal Newport goes so far as saying that media like email, far from enhancing our productivity, serve to ultimately deskill the labour force.

How should we respond to the crisis of attention?

Individuals and organisations are exploring ways to counter the fall in attention spans. Some companies embrace single-tasking as a mode of working. Some experiment with doing away with email all together. Others help staff to train the mind, for instance offering courses in mindfulness, the practise of paying attention to the present moment, which has been shown to improve people’s focus.

In terms of avenues for future research, further empirical work could shed light on the size of the channels mentioned above to get an estimate of the drag on productivity. Ideally we would want to observe directly how ‘attention capital’ and productivity vary across firms and over time (and how this affects wages). Failing that, perhaps datasets exist that allow us measure the gains to productivity of firms that make use of strategies to enhance employees’ attention, compared to other firms in the same industry that don’t?

Note that the focus here is on understanding the link from attention to productivity. This may include noting the role that (the design of) digital technologies play in causing shrinking attention spans. But of course the overall impact of digital technologies on productivity is a much wider issue (they will likely boost productivity, for instance, by reducing search costs).

Deeper issues: attention, choice and artificial intelligence

The crisis of attention also poses some deeper problems for society. To conclude this post, I note two of these because they have profound implications for the economy (and economics), even if they fall into the domains of political economy, philosophy and sociology.

The first issue is that the more our attention is ‘captured’ by the algorithms that underpin consumer technologies, the less our decisions – what to click on, what to buy – can be said to reveal our true, underlying preferences. Of course, adverts have been around for a long time but the argument is that the use of Big Data to exploit psychological vulnerabilities in a targeted way, using the latest insights from neuroscience, changes the game: it prevents us from “wanting what we want to want”. This should concern economists because models of consumer behaviour rest largely on the assumption of ‘revealed preferences’.

The second concerns the rise of artificial intelligence and machines that will be capable of an increasingly wide set of tasks. Views differ on what this will mean for future unemployment (see eg here and here). But most agree on the need to cultivate our distinctively human skills in order to differentiate ourselves from machines. And the human ability to empathise – central to the work of social workers, performers and nurses, among others – is cited in this regard by the likes of Klaus Schwab, Andy Haldane and Jim Kim.

How is the crisis of attention relevant here? Being able to pay attention (to tasks, to people) is a crucial input in the cultivation of empathy. Studies on mindfulness are instructive here: mindfulness practise gives explicit focus to cultivating attention, but research suggests that it also boosts individuals’ empathy – making it a potentially important part of a response to the impending wave of technological change.


Bank Underground is a blog for Bank of England staff to share views that challenge – or support – prevailing policy orthodoxies. The views expressed here are those of the authors, and are not necessarily those of the Bank of England, or its policy committees.