Banks Pass Basel III Hurdle

The Basel Committee has published the results of its latest Basel III monitoring exercise based on data as of 31 December 2016. For the first time, the report provides not only global averages but also a regional breakdown for many key metrics. Data is included from 4 Australian “Group 1” banks and 1 “Group 2” bank.

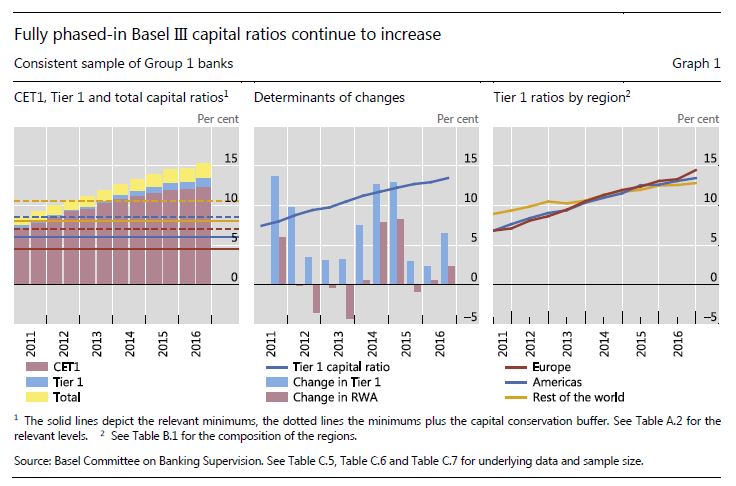
Overall, banks now hold more capital, which is a good thing. Tier 1 capital ratios improved from 7.4% to 13.5%. In 2011 Tier 1 capital ratios were more than two percentage points lower in Europe and the Americas compared with the rest of the world. This relationship has now reversed.

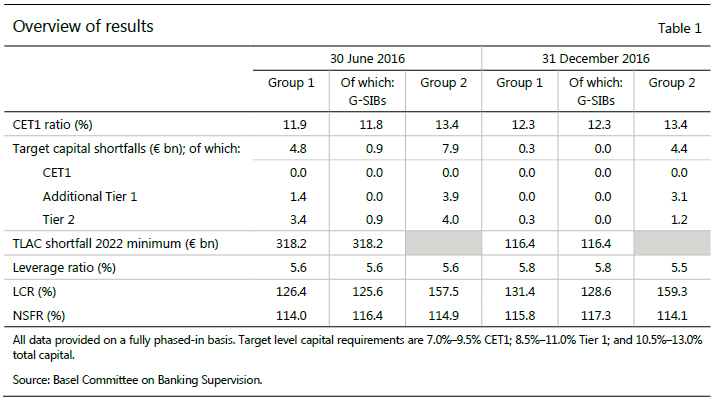
  • Compared with the previous reporting period (June 2016) the average Common Equity Tier 1 (CET1) capital ratio under the fully phased-in Basel III framework has increased from 11.9% to 12.3% for Group 1 banks while is stable for Group 2 banks.
  • All Group 1 banks would meet the CET1 minimum capital requirement of 4.5% and the CET1 target level of 7.0% (ie including the capital conservation buffer). This target also includes the G-SIB surcharge where applicable.
  • There is no CET1 capital shortfall for Group 2 banks both at the minimum and target levels.
  • Applying the 2022 minimum requirements, 12 of the 25 G-SIBs reporting total loss-absorbing capacity (TLAC) data have a combined shortfall of €116.4 billion, compared with €318.2 billion at the end of June 2016.
  • Group 1 banks’ average Liquidity Coverage Ratio (LCR) improved by 5.0 percentage points to 131.4%, while the average Net Stable Funding Ratio (NSFR) increased from 114.0% to 115.8%. For Group 2 banks, the LCR and NSFR are more stable.
  • CET1 capital ratios for Group 1 banks have increased by 5.1 percentage points from 7.2% to 12.3% since June 2011, total capital ratios have increased by 6.6 percentage points from 8.7% to 15.3%.
  • Tier 1 capital ratios improved from 7.4% to 13.5%, mainly driven by increases in capital which more than offset a slight overall increase in risk-weighted assets (RWA).
  • In 2011 Tier 1 capital ratios were more than two percentage points lower in Europe and the Americas compared with the rest of the world. However, this relationship has reversed in the meantime. The reasons are twofold. First, the increase in capital since June 2011 was lower in Europe as compared to the other regions. Second, RWA fell for European Group 1 banks while RWA increased for banks in the Americas and, in particular, the rest of the world.
  • Since 2011, annual profits after tax have always been higher in the Americas and the rest of the world than in Europe.
  • Overall, around 20% of the profits have been generated by Group 1 banks in Europe, more than 30% in the Americas and almost half in the rest of the world.
  • Conversely, almost 60% of the CET1 capital raised has been raised by Group 1 banks in Europe.

Data have been provided for a total of 200 banks, comprising 105 large internationally active banks. These “Group 1 banks” are defined as internationally active banks that have Tier 1 capital of more than €3 billion, and include all 30 banks that have been designated as global systemically important banks (G-SIBs). The Basel Committee’s sample also includes 95 “Group 2 banks” (ie banks that have Tier 1 capital of less than €3 billion or are not internationally active).

The Basel III minimum capital requirements are expected to be fully phased-in by 1 January 2019 (while certain capital instruments could still be recognised for regulatory capital purposes until end-2021). On a fully phased-in basis, data as of 31 December 2016 show that all banks in the sample meet both the Basel III risk-based capital minimum Common Equity Tier 1 (CET1) requirement of 4.5% and the target level CET1 requirement of 7.0% (plus any surcharges for G-SIBs, as applicable). Between 30 June and 31 December 2016, Group 1 banks continued to reduce their capital shortfalls relative to the higher Tier 1 and total capital target levels; in particular, the Tier 2 capital shortfall has decreased from €3.4 billion to €0.3 billion. As a point of reference, the sum of after-tax profits prior to distributions across the same sample of Group 1 banks for the six-month period ending 31 December 2016 was €239.5 billion. In addition, applying the 2022 minimum requirements for Total Loss-Absorbing Capacity (TLAC), 12 of the G-SIBs in the sample have a combined incremental TLAC shortfall of €116.4 billion as at the end of December 2016, compared with €318.2 billion at the end of June 2016.

The monitoring reports also collect bank data on Basel III’s liquidity requirements. Basel III’s Liquidity Coverage Ratio (LCR) was set at 60% in 2015, increased to 70% in 2016 and will continue to rise in equal annual steps to reach 100% in 2019. The weighted average LCR for the Group 1 bank sample was 131% on 31 December 2016, up from 126% six months earlier. For Group 2 banks, the weighted average LCR was 159%, slightly up from 158% six months earlier. Of the banks in the LCR sample, 91% of the Group 1 banks (including all G-SIBs) and 96% of the Group 2 banks reported an LCR that met or exceeded 100%, while all Group 1 and Group 2 banks reported an LCR at or above the 70% minimum requirement that was in place for 2016.

Basel III also includes a longer-term structural liquidity standard – the Net Stable Funding Ratio (NSFR). The weighted average NSFR for the Group 1 bank sample was 116%, while for Group 2 banks the average NSFR was 114%. As of December 2016, 94% of the Group 1 banks (including all G-SIBs) and 88% of the Group 2 banks in the NSFR sample reported a ratio that met or exceeded 100%, while 100% of the Group 1 banks and 96% of the Group 2 banks reported an NSFR at or above 90%.

Note that in general, the estimates presented generally assume full implementation of the Basel III requirements as agreed up to end-2015 based on data as of 31 December 2016. The main part of this report does not reflect any standards agreed since the beginning of 2016, such as the revisions to the market risk framework which are presented separately in a special feature. No assumptions have been made about banks’ profitability or behavioural responses, such as changes in bank capital or balance sheet composition, either since this date or in the future. Furthermore, the report does not reflect any additional capital requirements under Pillar 2 of the Basel II framework, any higher loss absorbency requirements for domestic systemically important banks, nor does it reflect any countercyclical capital buffer requirements.

Applications for crowd-funding licences open 29 September 2017 – ASIC

ASIC says that from 29 September 2017, the new crowd-sourced funding (CSF) regime will come into effect and ASIC will begin accepting licence applications from CSF intermediaries.

Under the CSF regime, eligible public companies will be able to make offers of fully paid ordinary shares to a large number of investors via the online platform of a licensed intermediary. Generally, the CSF regime reduces the regulatory requirements for public fundraising and the intermediaries will play an important oversight role in this process.

ASIC Commissioner John Price said that the new system balances the need for regulatory oversight with supporting innovation.

‘ASIC welcomes the start of the new crowd-sourced funding laws. Crowd-sourced funding helps both start-ups and small to medium sized businesses and investors access the opportunities that are available from an innovative economy. It is also important for investors to understand the benefits and risks of crowd-sourced funding and we encourage them to refer to the materials on crowd-sourced funding on our MoneySmart website‘. he said.

For companies to access the benefits of the new CSF regime, ASIC must first license suitable intermediaries to provide crowd-funding services. Providers of CSF services must hold an Australian financial services (AFS) licence. From 29 September 2017 ASIC will begin accepting applications from potential CSF intermediaries for AFS licence authorisations to provide a crowd-funding service.

To facilitate implementation of this regime as soon as possible, ASIC’s Licensing team will consider applications from CSF intermediaries as a matter of priority.

ASIC has today released further details of its approach to the assessment of CSF intermediaries, and the information required for both new licence and variation applications seeking CSF service authorisation.

Applicants should read the information provided on this page before making an application.

ASIC has also released an update to ASIC Form 206 which can be used to convert an existing company so that it is eligible to use the new CSF regime. ASIC will now accept lodgement of ASIC Form 206.

Suncorp Cuts New Mortgage Rates

Suncorp has unveiled a number of discounts on its investor and owner occupier loan products in response to being awarded Bank of the Year – Fixed Rate Home Loan by CANSTAR.

Effective from today (12 September), the bank’s Investment Home Package Plus two and three year fixed rates will drop by 0.20% p.a. and 0.30% p.a. respectively, bringing both rates to 4.29% p.a.

The follow additional special offer discounts for new standard variable lending will also come into effect today:

Back to Basics LVR New Loan Amount Current new business interest rate Additional discount Special discounted rate
Owner-occupied ≤90%
(inclusive LMI)
≥$150,000 3.78% p.a. 0.10% p.a. 3.68% p.a.
90% – ≤95% (inclusive LMI) 4.03% p.a. 0.10% p.a. 3.93% p.a.


Back to Basics LVR New Loan Amount Current new business interest rate Additional discount Special discounted rate
Owner-occupied ≤90%
(inclusive LMI)
≥$150,000 3.89% p.a. 0.10% p.a. 3.79% p.a.
Owner-occupied
First Home Buyers
≤95% (inclusive LMI) ≥$150,000 3.89% p.a. 0.10% p.a. 3.79% p.a.

In addition to the fixed rate award, Suncorp also received a five star rating for two of its home loan products:

  • Bank to Basics Owner Occupied Construction Loan
  • Home Package Plus Owner Occupied Fixed Rate Loan

“The CANSTAR award and five star ratings are further confirmation that we are offering products that deliver value for our customers,” said Suncorp banking & wealth CEO David Carter.

“In June this year, we announced some changes to interest rates to give additional support to customers in the owner-occupied market, and from today I am pleased to say we will go further. This is a reflection of recent reductions to fixed rate funding costs, allowing us to lower our two most popular fixed rate loan products for investors.”

The rate changes and special offers come into effect in what is traditionally a busy season for home buyers, he added.

“Customers who take advantage of these offers will also have the convenience of being able to access more than 3,300 fee-free ATM’s, as part of Suncorp’s new partnership with the rediATM network.”


First Time Buyers – The First Step is a Stretch – RBA

The RBA published a research discussion paper “The Property Ladder after the Financial Crisis: The First Step is a Stretch but Those Who Make It Are Doing OK”. Good on the RBA for looking at this important topic. But we do have some concerns about the relevance of their approach.

This paper investigates how things have changed since the GFC for those stepping onto the property ladder. Is ‘generation rent’ an important trend? Are people buying first homes taking on ‘too much’ debt? And what implications does this have for our understanding of the growing level of aggregate household debt?

They highlight the rise of those renting, and attribute this largely to rising home prices. As a piece of research, it is interesting, but as it stops in 2014, does not tell us that much about the current state of play! However, they conclude:

The results we find in this paper are very much bittersweet. On the one hand, we find that fewer people are making the transition from renters to home owners than prior to the crisis. Given research that links the rise in inequality to changes in home ownership patterns, this could have significant longer-term consequences for the distribution of wealth in Australia. On the other hand, those households that do make the transition are more financially secure than earlier cohorts. So the rise in aggregate and individual debt ratios do not appear to be associated with an increase in household financial vulnerability – at least as far as first home buyers are concerned.

We attribute much of this change to the increase in housing prices and the associated hurdle that deposit requirements represent. While saving a deposit is a stretch, it is also a sign of financial discipline that is associated with fewer subsequent difficulties. Thus, while the first step on the property ladder is more of a stretch than before the crisis, those who do make the step are, on average, better placed to pay off their loans than prior to the crisis.

A few points to note.

First, the RBA paper uses HILDA data to 2014, so it cannot take account of more recent developments in the market – since then, incomes have been compressed, mortgage rates have been cut, and home prices have risen strongly in most states, so the paper may be of academic interest, but it may not represent the current state of play.   Very recently, First Time Buyers appear to be more active.

More first time buyers are getting help from parent, and their loan to income ratios are extended, according to our own research.

Also, they had to impute those who are first time buyers from the data, as HILDA does not identify them specifically.  Tricky!

The past three wealth modules of the survey (2006, 2010 and 2014) have included a variable, ‘rpage’, which asks the household reference person whether they have ever owned residential property and, if so, the age at which they first acquired, or started buying, this property.

Another variable, ‘hspown’, available in the 2001 and 2002 surveys only, asks households whether they still live in their first home. This variable allows us to identify FHBs directly for these years.

We combine the information from ‘hspown’ and ‘rpage’ into the one variable identifying indebted FHBs. For 2001 and 2002 we use the ‘hspown’ variable and the ‘rpage’ variable is used thereafter.

The percentage of owner-occupier households identified as FHBs in any given year is, on average, between 1 and 2 per cent over the course of the survey, which is broadly in line with aggregate measures. This corresponds to between 50 and 100 households each year.

So a very small sample.

Next, the RBA cited the aggregate household Debt-to-income Ratios cross-country estimates. Rising trends are apparent in many countries.

They then proceeded to explain the drawbacks of this data set.

Notwithstanding this statistic’s frequent use, it has a number of drawbacks. First, it compares a stock of debt with a flow of income rather than, say, a stock of debt against a stock of assets or a flow of repayments against a flow of income. This mixing of concepts means that it is not clear what a reasonable benchmark for the level of debt to income might be. There are also important distributional considerations that affect what meaning can be attached to the aggregate values. At heart these issues stem from the fact that, while it is tempting to interpret higher aggregate debt-to-income ratios through a representative consumer lens, it is misleading. Of particular note is that the aggregate ratio places more weight on high-income households, which can be misleading. Higher-income households can support higher debt-to-income ratios than lower-income households. This is primarily because a smaller fraction of a higher-income household’s expenditure needs to be devoted to necessities leaving more available to spend on other things. There are also other dimensions in which borrowers may differ, such as their risk of unemployment and their ability to obtain funds in an emergency, that would affect the inherent riskiness of any given debt level.

Fourth, they show that first time buyers have a higher mean debt-to-income ratio compared with other borrowers.

Turning first to the aggregated data, we can see in Figure 6 that the debt-to-income ratio of FHBs is substantially higher than that of all other indebted owner-occupiers. This reflects the fact that FHBs are at the beginning of their loan life cycle. That is, before they have had the opportunity to pay down their loan. Comparing the pre- and post-GFC periods, we see that the median FHB debt-to-income ratio was around 330 per cent in 2014, up approximately 40 per cent from the ratio of 230 per cent in 2001. FHBs are taking on more debt than in the past.

Actually, more recent data shows that Debt-to-Incomes are even more extended, with some FTB’s in Sydney at a ratio of 7x income (according to our more recent surveys).

Finally, they show that “despite higher debt levels, households who became indebted FHBs post-2007 appear to be paying down their mortgages and reducing their debt-to-income ratios at the same rate, or slightly faster, than households who took on a mortgage before 2007”.

In the year after taking out a loan, the reduction in the debt-to-income ratio for FHBs in the post-2007 period was around 8 per cent, compared to 5 per cent for the pre-2007 cohort. After three years, the debt-to-income ratio for FHBs in the pre- and post-2007 periods has decreased by 14 and 18 per cent, respectively. Given that these rates of amortisation are significantly higher than those associated with required repayments or interest rate changes over this period, it seems that these are voluntary choices rather than the consequence of changes to required repayment schedules. The median loan-to-valuation ratio of FHBs in the post-financial crisis period also decreases by more than for the previous cohort, although this is likely due to the rise in housing prices increasing the denominator of this ratio over time.

So, while there are some general conclusions, we are not sure the work really adds much to the current debate on housing affordability, housing debt, and the current stresses which households, especially first time buyers are experiencing.

Green Shoots Of Business Investment – Maybe!

The latest data from the ABS: Lending Finance to end July 2017, is the final piece on the monthly data releases which is the story of finance. Most striking is the rise in commercial lending, other than for investment home investment, up 2%, while lending for property investment fell as a proportion of all lending, and of lending for residential housing. This included significant falls in NSW where it appears investors may be changing their tune.

So, finally some green shoots of business investment perhaps. We really need this to come on strong to drive the growth we need to stimulate wages. The upswing is there, but quite small, so we need to watch the trajectory over the next few months.  Overall lending grew 0.64% in the month, (which would be 7.8% on an annualised basis), way stronger than wages or cpi.

The total value of owner occupied housing lending excluding alterations and additions rose 0.7% in trend terms. The trend series for the value of total personal finance commitments fell 0.5% within which fixed lending commitments fell 0.6% and revolving credit commitments fell 0.4%.

The trend series for the value of total commercial finance lending rose 0.8% of which fixed lending commitments rose 1.0% and revolving credit commitments rose 0.1%, while the value of total lease finance commitments fell 4.1% in July 2017.

The ABS made a series of revisions in prior months – without explanation: Commercial Finance for the month of June 2017, Personal Finance for the periods between April 2017 to June 2017 and Investment housing finance for the month of June 2017.


Majors Assert Their Mortgage Origination Strength

The latest edition of the AFG Competition Index, to August 2017 shows that after some weak results, the majors are back in force. So much for macroprudential! Of course this may be myopic, as it looks at deal flow through the AFG prism, but we suspect not.

In a sign of renewed commitment to the broker channel, major lenders have taken back control from the non majors with a lift in market share across the last month according to the latest AFG Competition Index.

“After a low of 63.39% in June 2017, the majors have risen each month to round out the quarter at 65.90%,” said AFG General Manager of Residential and Broker Mark Hewitt.

“Fixed rate products have recorded the largest increase with the majors now claiming 74.8% share in this category. ANZ is taking the lion’s share of fixed rate business jumpingfrom 10.51% in June to 20.82% by the end of the quarter,” he said. This rise has largely been at the expense of Westpac, which recorded a drop of more than 7% over the same period.

“Westpac also fell back in the Investor category, dropping from 16.92% in June to 12.91% at the end of August. ANZ have also taken the lead in this category, with a lift from 13.22% to 19.99% over the quarter.

“ANZ is also appealing to those seeking to refinance,” he said. “Their market share amongst refinancers has jumped from 15.22% to 18.5% across the quarter.

Amongst the other major lenders, CBA rebounded from 12.45% total share at the start the start of the quarter to finish on 14.25%.

In the non-major category, AFG Home Loans finished the quarter with a market share of 8.85% as a result of share gains in refinancing, investor and first home buyer categories.

Suncorp also proved competitive over the quarter averaging almost 5% total market share.

“AFG also welcomes Credit Union Australia (CUA) and Homeloans Limited to our panel and we look forward to introducing these lenders to our brokers”.

“The presence of these additional leading non-major lenders provide increased choice for consumers looking for finance,” he said.

Preliminary Results Show 70.2% of Auctions Successful

From CoreLogic.

Preliminary figures show 70.2 per cent of auctions were successful across the combined capital cities, while auction activity increases week-on-week.

The combined capital city preliminary clearance rate increased to 70.2 per cent this week, after last week’s revised final clearance rate fell to 66.4 per cent, which was not only the lowest combined capital city clearance rate so far this year, down -0.1 per cent from the previous low seen over the week ending 25 June 2017 (66.5 per cent), but the lowest clearance rate since June 2016 across the combined capitals. It will be interesting to see what the final clearance rate looks like on Thursday once the remaining records have been captured. Auction volumes increased week-on-week with 2,225 properties taken to auction this week, up from 2,074 last week, and higher than this time last year (2,062).

2017-09-11--capitalcityauctionresults

Commonwealth Bank inquiry: Is former APRA boss John Laker the right person for the job?

From the ABC’s Michael Janda.

It’s indisputable that the Commonwealth Bank hasn’t had a great time lately.

Sure, it recently turned in a record $9.93 billion profit, but Australia’s biggest bank has been hit by scandal after scandal.

First there was it’s involvement in lending to customers caught up by the Storm collapse, then the financial planning scandal, a series of complaints against CommInsure and finally the massive money laundering scandal, which could easily cost the bank billions of dollars in penalties.

While previous scandals were dismissed as “isolated incidents” by CBA, for regulators the money laundering scandal was the last straw.

Two weeks ago, banking regulator APRA announced an independent inquiry into governance, culture and accountability at CommBank.

On Friday, APRA announced the panel who will conduct the review.

All three panellists are eminent members of the business and financial world.

Jillian Broadbent was a long-serving Reserve Bank board member, along with stints as a non-executive director with Coca-Cola Amatil, ASX, Woodside and Qantas.

Graeme Samuel is best known for his eight years in charge of Australia’s consumer and competition watchdog, but also has extensive experience in the financial sector.

John Laker rounds out the panel — he was in charge of APRA until the end of June 2014.

And that is where the potential doubts about Dr Laker’s appointment arise.

“My first reaction when I saw his name announced was, ‘gee, that’s a bit poacher turned gamekeeper’,” said banking analyst Martin North from Digital Finance Analytics.

“I guess he also would have significant experience of CBA and the way it’s interacting with the regulator, so I guess it’s a bit of a two-way street.

The potential conflicts are obvious.

Most of CBA’s problems arose prior to July 2014.

As APRA’s then chairman, Dr Laker was responsible for the organisation that was supposed to be keeping an eye on CBA, ensuring that its finances, governance and risk culture were shipshape.

If it turns out that the Commonwealth Bank was seriously deficient in any of these areas, the review will require Dr Laker to sign off on a report that may highlight errors or oversights by APRA and himself as its boss.

That’s not to say he can’t or won’t do that if it’s called for, but it’s a potentially awkward position to be in.

CBA not unique amongst banks behaving badly

Dr Laker’s appointment is not the only flaw with APRA’s CBA inquiry.

While the nation’s largest bank has probably been embroiled in more scandals than the others, all of the big four have been found to have acted against the interests of consumers in numerous instances.

Martin North argues that’s because the short-term profit motive reigns supreme.

“In the process of trying to maintain shareholder returns at levels that investors are wanting are they compromising customer outcomes?” he asked.

“There’s been a litany of things over the years where things seem to have gone wrong and people tend to say, ‘well these are isolated events and issues’, but when you put them all together you start to wonder whether there’s a more structural set of questions that need to be thought through.”

The banking regulators appear to appreciate there’s a wider problem.

“There’s no quick fix here, it’s a deep-seated issue in the view of the community that there is a lack of trust,” APRA’s current chairman Wayne Byers told a business lunch in Sydney last week.

“The drip feed of issue after issue after issue just reinforces the view that’s out there,” Reserve Bank deputy governor Guy Debelle said at the same event.

Unfortunately the CBA review will not deliver that.

Not only is its credibility undermined by a panellist who many will conclude has no incentive to look into the darkest, dustiest corners of the cupboard, but also by its focus on just one bank.

Mr North isn’t really sold on a banking royal commission, but he does think a much broader inquiry into retail banking and wealth management across all the major institutions is what’s needed to restore trust.

“There is a bigger question about the way that the financial services sector operates in Australia,” he said.

“At the moment, there isn’t an appetite or a willingness to really pursue that, but I think that’s what we really need.”

In the meantime, it appears the burden will remain with investigative journalists such as Adele Ferguson to continue their piecemeal exposure of the financial sector’s dirty deeds.

Household Finance Confidence Weakens Again

Digital Finance Analytics has released the August 2017 edition of our Household Finance Confidence index, which uses data from our 52,000 household surveys and Core Market Model to examine trends over time. Overall, households scored 98.6, compared with 99.3 last month, and this continues the drift below the neutral measure of 100.  This is an average score, and there are significant variations within our various segments.

Watch the video to learn more, or read the transcript below:

Younger households are overall less confident about their financial status, whilst those in the 50-60 years age bands are most confident. This is directly linked to the financial assets held, including property and other investments, and relative incomes. Households over 60 years track quite closely to the national averages.

For the first time in more than a year, households in Victoria are more confident than those in NSW, while there was little relative change across the other states. One of the main reasons for the change in NSW can be traced directly to the state of the Investment Property sector, where we see a significant fall in the number of households intending to purchase in NSW, and more intending to sell. One significant observation is the rising number of investors selling in Sydney to lock in capital growth, and seeking to buy in regional areas or interstate. Adelaide is a particular area of interest.

Consistent with our earlier analysis, a household’s property owing status has a significant impact on their relative financial confidence, with owner occupied households the most confident, ahead of  property investors and those renting. That said, low rental growth rates mean more investors are underwater on a cash flow basis, especially in Victoria, where more than half are not covering the borrowing costs of their investment mortgage from rental receipts (but are still hopeful of capital gains, and they can offset the losses thanks to tax breaks). Actually returns are much stronger in QLD and TAS.

Looking at the scorecard, job security remained about the same this month, but there was a 1.7% fall in those more comfortable with their savings and a rise of 2.5% of those less comfortable – thanks to lower interest rates on deposits as banks seek to build margin.  The debt burden remained a concern, with a small rise in those worried about meeting repayments on outstanding loans.  Incomes are still under pressure, with more saying their incomes in real terms have been devalued, down 1%, to 52% of households.  Costs of living continue to rise for 63% of households, and only 7% saw a fall. 65% of households said their overall  net worth rose again, thanks mainly, to home prices rising. Some in WA, QLD and WA reported a fall, directly due to house values continuing to slip.

Given the fact that the dynamics of the economy seem to be locked in place with lower income growth, rising costs of living, and the property market adjusting to the new regulatory environment, we expect confidence to continue to drift lower in the months ahead. There is no obvious circuit breaker available in the current low interest rate, low growth environment. The leading indicators suggest that the recent positive momentum in the property market may be short lived.

By way of background, these results are derived from our household surveys, averaged across Australia. We have 52,000 households in our sample at any one time. We include detailed questions covering various aspects of a household’s financial footprint. The index measures how households are feeling about their financial health. To calculate the index we ask questions which cover a number of different dimensions. We start by asking households how confident they are feeling about their job security, whether their real income has risen or fallen in the past year, their view on their costs of living over the same period, whether they have increased their loans and other outstanding debts including credit cards and whether they are saving more than last year. Finally we ask about their overall change in net worth over the past 12 months – by net worth we mean net assets less outstanding debts.

We will update the results again next month.

Damn Lies and Statistics

We have been watching the continued switching between owner occupied and investor loans – $1.4 billion last month, and more than $56 billion – 10% of the investor loan book over the past few months.

This has, we think been driven by the lower interest rates on offer for owner occupied loans, compared with investor loans. But, we wondered if there was “flexibility with the truth” being exercised to get these cheaper loans.

So we were interested to read the latest from UBS which further underscores the possibility of untruths being told as part of the mortgage underwriting processes – to the extent of $500bn (on a book of $1.6 trillion).

This is based on survey results from 907 mortgage applicants over the last year.  There are significant differences across channels and individual lenders.  The net effect is that loan portfolios contain more risks than banks believe – something which our own analysis also demonstrates.

Understating living costs was the most significant misrepresentation, plus overstating income, especially loans via brokers.

In 2017 one-third of mortgage applications were not factual and accurate UBS Evidence Lab found that only 67% of respondents stated their mortgage application was “completely factual and accurate” in 2017 – a statistically significant reduction from the 2016 Vintage (72%). This year 25% of participants said their application was “mostly factual and accurate”, 8% said it was “partially factual and accurate”, while 1% “would rather not say”. By channel the level of “completely factual and accurate” mortgages fell across both brokers to just 61% (from 68%) and via the branches to 75% (from 78%). At a bank level there was a statistically significant fall in factual accuracy at NAB to 62%. While at ANZ the level of factual accuracy fell to 55% in 2017, statistically significantly lower than the Industry (99% confidence level).

Given the rising level of misstatement over multiple years we estimate there are now ~$500bn of factually inaccurate mortgages on the banks’ books (ie ‘Liar Loans’ – a term used in USA during the Financial Crisis for mortgages where documentation was not accurate). While household debt levels, elevated house prices and subdued income growth are well known, these finding suggest mortgagors are more stretched than the banks believe, implying losses in a downturn could be larger than the banks anticipate.

We are underweight Australian banks and are very cautious the medium term outlook.

Expect the normal rebuttals from the lenders, but that has more to do with protecting their positions than wanting to understand the truth – a core cultural problem across the sector.