June Home Lending Says Property Has Further To Run

The latest data from the ABS shows home lending finance in June 2017 remained robust. In fact, overlaid with the latest home price data, and auction clearance rates, it looks like the property market has further to run, at least in the main markets of Sydney, Melbourne and Canberra. Loans for construction were up.

Or in other words, household debts will continue to climb, despite the “risk trimming” measures imposed by APRA.

Whilst the trend estimate for the total value of dwelling finance commitments excluding alterations and additions was flat, owner occupied housing commitments rose 0.5% while investment housing commitments fell 0.9%. However, in seasonally adjusted terms, the total value of dwelling finance commitments excluding alterations and additions rose 0.8%.

In original terms, the number of first home buyer commitments as a percentage of total owner occupied housing finance commitments rose to 15.0% in June 2017 from 14.0% in May 2017.

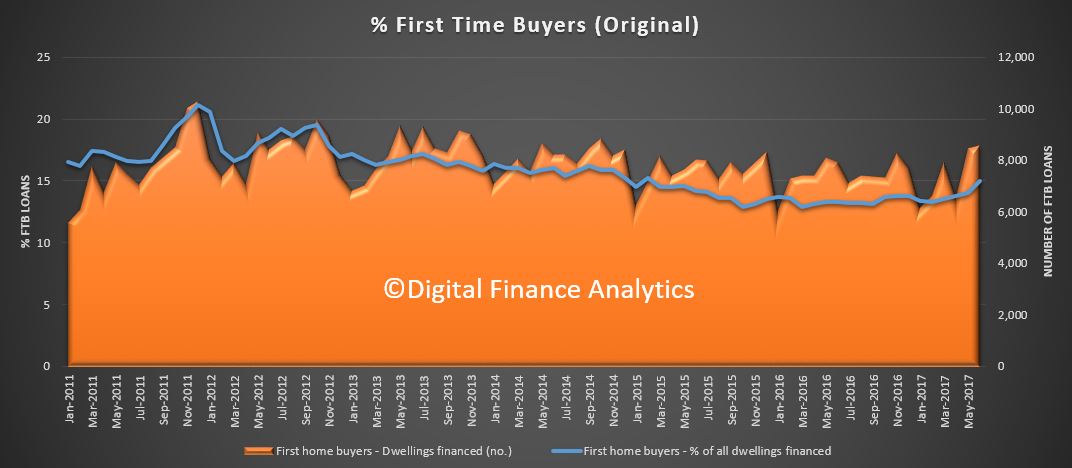
More first time buyers are entering the market now, reacting to the attractive rates selectively on offer.

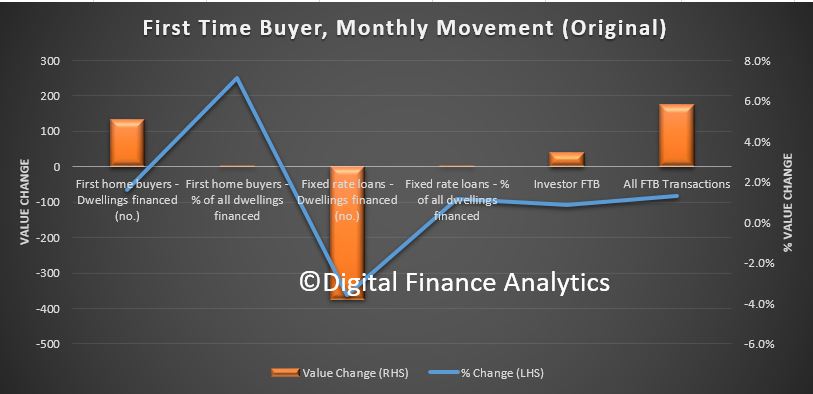
Overlaying the first time buyer investors, which was also quite strong, we see momentum building.
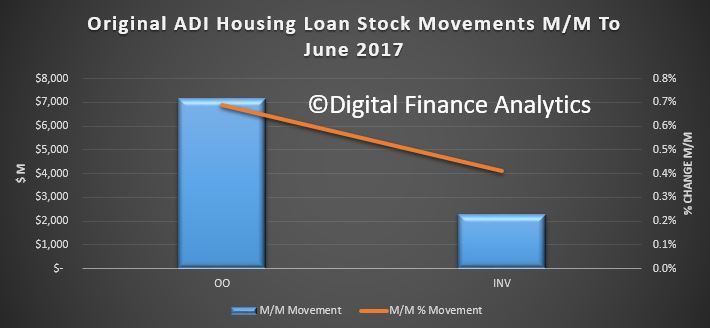
In original terms, in the past month, owner occupied lending flows grew by $7 billion, whilst investment loans grew $2.1 billion.

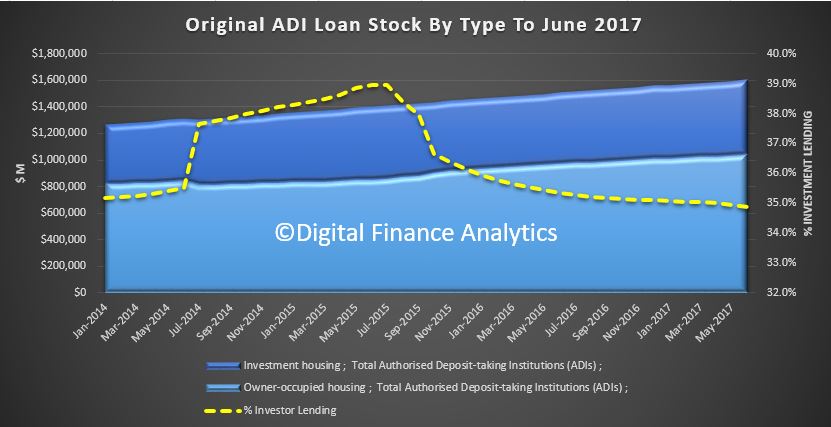
Looking at the trend adjusted stock, the mix of loans remained about the same at 35.9%, and overall loans pools grew.

We see a rise in borrowing for both owner occupied and investment construction.

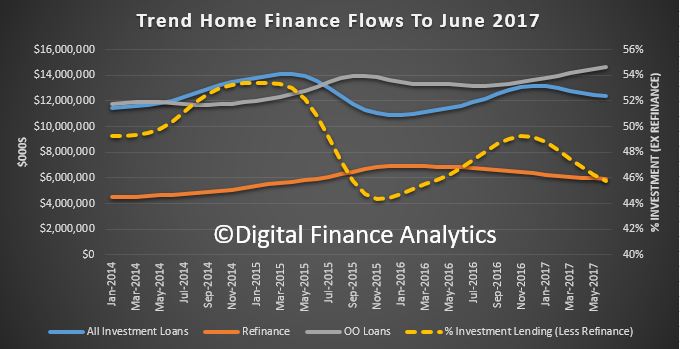
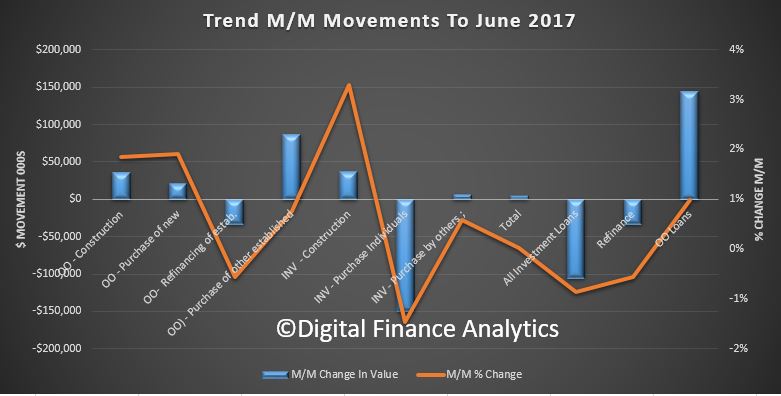
So here are the trend adjusted flows, with owner occupied loans on the rise, investment loans down a little, and refinanced loans also down.

Worth noting that if you remove refinancing though, investment loans are still 46% of new loan flows. This is hardly indicative of a cooling of the property market.

Finally, the ABS says that in trend terms, the number of commitments for owner occupied housing finance fell 0.2% in June 2017.

In trend terms, the number of commitments for the construction of dwellings rose 1.9% and the number of commitments for the purchase of new dwellings rose 1.3%, while the number of commitments for the purchase of established dwellings fell 0.5%.

Finance for new dwellings appear to be getting a second wind with all eight state and territories showing growth in owner occupier loans for new dwellings during the month.


CBA FY17 Profit Up 7.6%

CBA just released their FY17 results, with statutory NPAT $9,928m, up 7.6% on FY16. The cash NPAT was up 4.6% to $9,881m. Much of the lift is explained by a fall in loan impairment expense, down 12.8% to $1,095m, plus a one off from the Visa transaction.

However their net interest margin fell 3 basis points to 2.11%, despite recent mortgage book repricing. The underlying cost income ratio fell 60 basis points to 41.8%.

As a result, return on equity overall fell 0.5% to 16%, earnings per share was $5.74 (compared with $5.55 in FY16) and the dividend per share was $4.29, compared with $4.20 last year.

Operating income increased by 3.8%, ahead of operating expense growth of 2.4%, delivering positive jaws on an underlying basis.

Banking income grew 4.3% due to volume growth in home lending, business lending and deposits. Insurance income fell 1.1% due to loss recognition of $143 million.

CBA Invested almost $1.3 billion whilst maintaining underlying expense growth to 2.4%.

Higher wholesale funding costs and increased competition in home and business lending more than offset asset repricing, resulting in a 3 basis point decline in the net interest margin to 2.11%. In calculating the Group’s NIM, mortgage offset balances are now being deducted from average interest earning assets to reflect their non-interest earning nature, and to align with peers and industry practice. This results in changes to Group’s NIM for current and prior periods.

It was flat second half thanks to home loan repricing.

Looking across the divisions, the Retail Bank again contributed the lions share of the result, but with positive growth at the NPAT level in all divisions, other that IFS; all on a cash basis.

In the Retail bank, consumer arrears were controlled, though losses in WA climbed again, with 90+ days at 1.23%.

Some interesting mortgage related information was contained in the announcement.

The FY17 losses on their home loan book is 3 bpts. The portfolio dynamic LVR is 50%. Investment loans make up 33%, with new investment loans falling from 37% in Dec 16 to 32% in Jun 17. 77% of customers are paying in advance – this includes any amount ahead of monthly minimum repayment and includes offset facilities. They have a loan serviceability buffer of 2.25% above the customer rate, with a minimum floor rate (RBS: 7.25% pa, Bankwest: 7.35%). They have a maximum LVR of 80% for IO loans now. Interest Only loans have lower arrears.

John Symond exercised his put option which will require CBA to acquire the remaining 20% interest in Aussie Home Loans (AHL). The purchase price will be determined in accordance with the terms agreed in 2012 and the purchase consideration will be paid in the issue of CBA shares. They will consolidate AHL from completion of the acquisition which is currently expected to be in late August 2017.

Their focus on propitiatory loan origination has led to a fall in the proportion of loans via brokers.

More broadly, CommBank research on financial wellbeing shows one in three Australian households would struggle to access $500 in an emergency, and more than a third of Australians are spending more than they earn each month.

The Group’s Common Equity Tier 1 (CET1) ratio was 10.1% on an APRA basis, and 15.6% on an internationally comparable basis, maintaining CBA’s position in the top quartile of international peer banks for CET1.

CBA are confident they will meet APRA’s‘unquestionably strong’ CET1 ratio average benchmark of 10.5% or more by 1 January 2020.

Customer deposits contributed 67% of total funding and the Net Stable Funding Ratio (NSFR) was 107%.

The average tenor of the wholesale funding portfolio was 4.1 years and the average tenor of new issuance was 5.2 years.

Liquid assets increased from $134 billion in 2016 to $142 billion, and the Liquidity Coverage Ratio was 129%.

The Leverage Ratio was 5.1% on an APRA basis and 5.8% on an internationally comparable basis.

The banking levy is estimated at $258m (post tax), first payment due March 2018. The Group effective tax rate will be 30.3% after the levy.


Banks can’t fight online credit card fraud alone, and neither can you

From The Conversation.

Online credit card fraud is on the rise in Australia, but pointing the finger at any one group won’t help. It’s an ecosystem problem: from the popularity of online shopping, to the insecure sites that process our transactions, and the banks themselves.

A recent report from the Australian Payments Network found that:

  • the overall amount of fraud on Australian cards increased from A$461 million in 2015 to A$534 million in 2016
  • “card not present” fraud increased to A$417.6 million in 2016, up from A$363 million in 2015
  • 78% of all fraud on Australian cards in 2016 was “card not present” fraud.

“Card not present” fraud happens when valid credit card details are stolen and used to make purchases or other payments without the physical card, mainly online or by phone.

While these numbers may seem alarming, it’s important to put them in context. Australians are increasingly carrying out transactions online; the report notes that we made 8.1 billion card transactions totalling A$715.5 billion in 2016.

The shift towards online credit card fraud also comes at the cost of other types of fraud. Cheque fraud, for example, was down to A$6.4 million in 2016, from A$8.4 million in 2015.

Still, it’s fair to ask: are the banks doing enough to keep our details secure?

The banks and security

The banks currently have a range of measures in place to protect customers from card fraud:

  • Chip and pin: Australia mandates the use of “chip and pin” technology. This replaced the need to swipe the magnetic strip on credit cards and is recognised as being more secure.
  • Two-factor authentication: Many Australian banks use text messages or tokens that generate a unique, time-limited code to help verify the legitimacy of transactions.
  • Monitoring of customer habits: Australian banks typically have a complex set of algorithms that monitor the spending habits and transactions of their customers. They frequently have the ability to identify a suspicious (often fraudulent) transaction and block it.

Overall, Australian financial institutions are investing time and technology into the prevention of fraud. However, recent allegations that the Commonwealth Bank of Australia breached anti-money laundering laws suggest that the big banks are not immune from the problem.

Data breaches and malware

Credit card fraud is going where the action is.

According to the research company Neilsen, “nearly all online Australians have used the internet to do some form of purchasing activity”. This means that Australians are increasingly sharing their credit card details with companies around the world.

Large-scale data breaches are a common occurrence. Many organisations have been compromised in some way, including Australian companies like Kmart and David Jones. A variety of personal information can be exposed, and this often includes customers’ credit card details.

Batches of stolen credit card details can be sold on the dark web to other motivated offenders. In one UK example, such details were being sold for as little as £1 per card.

Offenders are also using different types of malware, or computer viruses, to obtain the personal information of unsuspecting victims. In many cases, this includes bank account and credit card details through successful phishing attempts (or spam emails).

The liability fight

Banks will generally refund customers for any fraudulent losses incurred on their credit cards. However, customer must take “due care with their confidential data”.

There is also an onus on the customer to check their credit card statements and notify their bank of any suspicious activity.

But this may not always be the case. In 2016, the former Metropolitan Police Commissioner in the UK made headlines for suggesting that customers should not be refunded by banks if they failed to protect themselves from fraud.

Instead, he argued that customers were being “rewarded for bad behaviour” rather than being encouraged to adopt cyber-safety practices, such as antivirus software and strong passwords.

These statements were met with anger by many advocacy groups who equated them with victim blaming. It was further exacerbated by a leaked proposal by the City of London Police to shift the responsibility of fraud losses from banks to the individual.

While this recommendation was never adopted, the tension may continue to grow when it comes to fraud liability.

Looking for answers

Pointing the finger of blame at any one party is not a constructive solution. Banks alone cannot combat online credit card fraud. Neither can their customers.

There are simple steps to reduce the likelihood of online fraud: having up-to-date antivirus software and strong passwords is an important step. There are sites such as haveibeenpwned that demonstrate how vulnerable and exposed our passwords can be.

Still, it’s difficult to protect against social engineering techniques used by offenders to manipulate victims into handing over their personal details. Not to mention, the risks posed by third-party data breaches, which are beyond the control of individuals.

The introduction of mandatory data breach reporting legislation in Australia in 2017 may have a positive impact. By requiring organisations to let their customers know when their personal information has been compromised, individuals can be proactive about cancelling cards, changing passwords and taking out credit reports to check for fraudulent activity.

Businesses also need to recognise the importance of protecting their customer information. It is critical to overcome the mentality that cybersecurity is simply a technology problem or an IT issue. It should be firmly on the corporate management agenda.

Fraud is inevitable, regardless of the technology being used. Collaborative efforts between banks, businesses, government and individual consumers must improve.

No one group alone can effectively end online credit card fraud. Nor should they be expected to.

Author: Cassandra Cross, Senior Lecturer in Criminology, Queensland University of Technology

New rules mean lenders see ‘positive data’ when assessing loans

From The Real Estate Conversation.

From the end of this year, ‘positive data’ will be available to lenders to help them assess loan applications.

The federal government has fast tracked changes that will allow greater data sharing between banks, meaning borrowers will be able to be assessed on how well they have repaid loans in the last two year.

“The government’s move to fast-track positive data sharing will mean more Australian borrowers will see the benefits of a fairer system much sooner,” Susan Steele, credit bureau Experian’s Australia / New Zealand managing director.

The change, which was recommended by the Productivity Commission, is particularly relevant to those seeking approval for home loans.

How do the new rules work?

Currently, when borrowers are applying for credit in Australia, lenders ask for permission to access the borrower’s credit report to help them asses if they will be able to repay the loan. Only defaults are visible in these credit reports.

The new rules will mean that lenders will be able to see ‘positive data’ as well, for example, lenders will be able to see how well borrowers have repaid credit card, personal loans, or mortgages over the last two years.

The data will also show how many credit accounts someone has, and how much credit they have in total.

What impact with the changes have?

The changes are likely to see credit scores change, sometimes dramatically.

“Your next application may be assessed differently with lenders for the first time being able to see how well a borrower has paid back credit over the previous 24 months,” said Steele.

“This will include historical data coming online from credit cards, mortgages and personal loans.”

Steele said most Australians are very good at repaying credit. Experian’s data showed that around 80% of Australians have a clean record of not missing a repayment.

“Aussie borrowers are likely to see their credit scores increase or decrease in the coming weeks and months,” said Steele, as “new data about how many credit accounts they have open and how much the combined credit limits they have is factored into their scores for the first time.”

The new data is likely to have far-reaching impacts across a range of credit decisions, said Steele, including loan approvals and declines, changes in interest rates, and changes in lending limits.

“Industry research suggests around 40% of decisions about credit applications will change, in comparison to when only negative data was shared,” she said.

“Overall approval rates from banks are tipped to increase by 10-15%,” she said, “with research showing the share of bad loans could fall by as much as 45% when positive data is included in credit decisions.”

“Positive data sharing will also assist others to avoid entering into unmanageable levels of debt and getting into financial difficulty.”

Steele said borrowers can improve their credit score by “diligently making repayments on time”.

What to do if you are applying for a loan

Steele advised that borrowers, and those hoping to have loans approved, should check their credit scores regularly, and make sure new positive data is being factored in.

“The best thing home hunters can do is check their credit report before applying for a mortgage, something which, worryingly, our research shows seven in ten Australians admit to never having done. Consumers can check their score at any time, free of charge,” she said.

Positive data sharing is already in operation in 18 different countries.

“From our experience,” said Steele, “in the 18 other countries where we operate a credit bureau, positive data sharing is a much fairer system”.

First-home buyers

Steele said, “It may help potential first-home buyers who don’t have a long credit history, to be approved for finance, where previously they may have been declined due to a lack of insight into the way they handle their finances.”

Legal decision boosts fraud protection for banks

From Australian Broker.

A recent legal case has clarified when banks are liable for mortgage fraud in a decision that may see the victim worse off in certain scenarios.

The decision will also remove liability from the bank in certain fraudulent transactions even if the proper loan processing procedures were not followed.

The case, Spiliotopoulos v National Australia Bank Limited and Ors, saw the borrower allege that the individual who witnessed their signature on the mortgage did not in fact meet them and that their signature was forged, Louise Massey, partner at Dentons, told Australian Broker.

The ruling by the Supreme Court of NSW found an individual’s claim to be a registered proprietor at Land and Property Information (LPI) can be challenged in the event that a bank had knowledge of or participated in the fraud in the first place, Massey explained.

Spiliotopoulos, the borrower, said that the bank had been aware of the alleged fraud; a claim which the court dismissed due to lack of evidence.

“When the bank looked at the mortgage, it seemed to have followed all the proper procedures. There was nothing in the document that would have put the bank on notice. The bank wasn’t a participant in the fraud, so it couldn’t be attributable to the bank in any way,” Massey said.

The decision means that even if a bank did not completely follow proper procedures stated by its internal policies, it still would not be responsible for fraud in this particular type of case as they had no notice of fraud and therefore could not be liable, she added.

“The failure from banks to follow their own policies and procedures might trigger some other legal actions against the bank, but that wasn’t the case here.”

From the lender’s point of view, this was a very good decision as it provided protection against fraud allegations, Massey said.

However if the banks weren’t going to be held liable in these cases, this may mean that fraudsters had more scope to get away with it, she added.

“In a lot of cases like this, the fraudster is liable. The difficulty you have is sometimes fraudsters are people who operate in very sophisticated setups. It’s often very difficult to attempt to actually find them and charge them. Often they go missing in action.”

“When something like this occurs and the bank’s not responsible, who gets caught with the liability? Where does the liability or the loss fall? It doesn’t fall with the bank. If you can’t find and charge the fraudster then the loss is ultimately borne by the innocent party. Sometimes, that’s just the way it plays out.”

Massey also pointed to the move towards digital mortgages as an area to watch.

“The Spiliotopoulos case was before anything was electronic and so the mortgage was all done in hard copy. Now there are a lot of conveyancing transactions which are going ahead online. The electronic landscape might give more scope for fraudulent conduct to actually occur.”

CBA Executives Lose Short Term Bonus

A statement by the Chairman of the Commonwealth Bank of Australia, released today says:

Yesterday the Commonwealth Bank of Australia Board met to consider the bank’s financial results and the remuneration for senior executives for the 2017 financial year.

In determining the final 2017 financial year outcomes for remuneration, the Board gave consideration to risk and reputation matters impacting the Group.

The remuneration outcomes will be disclosed in detail in the CBA Annual Report to be released next week. This year, the Board recognises heightened public interest in executive remuneration, particularly having regard to the civil penalty proceedings initiated last week by the Australian Transaction Reports and Analysis Centre (AUSTRAC).

Therefore, in advance of the presentation of CBA’s financial results tomorrow, the Board advises that it has decided to reduce to zero the Short-Term Variable Remuneration outcomes for the CEO and Group Executives for the financial year ended 30 June 2017.

In reaching this conclusion the overriding consideration of the Board was the collective accountability of senior management for the overall reputation of the Group.

The Board also recognised that it has shared accountability and therefore has decided to reduce Non-Executive Director fees by 20 per cent in the current 2018 financial year.

The remuneration arrangements for the CEO and Group Executives are made up of both fixed and at risk short and long-term variable remuneration. The ‘at risk’ components are based on performance against key financial and non-financial measures. Full details of the remuneration outcomes and the Board’s full consideration will be disclosed next week in the Annual Report.

Mr Narev retains the full confidence of the Board.

Rising mortgage debt is the biggest threat to super balances

From The New Daily.

New data suggests rising property prices are a threat to the retirement system, as many Australians use their superannuation balances to pay off their mortgages before they retire.

The latest investment update from NAB highlights that many Australians are concerned about ending their working lives in debt. It reported an increase in the number of respondents who feared a lack of retirement savings. It also found that paying down debt was the highest priority for the next 12 months.

Likewise, the 2017 Household, Income and Labour Dynamics in Australia (HILDA) report – widely reported in recent days for its concerning home ownership numbers – also showed that both men and women were spending considerable chunks of their super to pay debts.

It found that men paying down debts spent on average $240,000 to do so in 2015, or 58 per cent of their super, while men helping family members spent $108,500, around 84 per cent of super. Women paying down debt spent $120,500, or 70 per cent of super and those helping family spent $67,000, or 48 per cent of super.

Some men and women also spent up big on things for themselves, as the following table shows. However, men spent far more than women here, indicating the gender imbalance in superannuation accounts.

Ian Yates, chief executive of the Council on the Ageing (COTA), said rising property prices could force more people to pay down more mortgage debt on retirement in the future.

“People are paying off debts of not inconsequential amounts on retirement. The numbers doing it and the amounts used surprised me,” he told The New Daily.

“It’s a concerning trend and if people plan to use their super to pay off a mortgage then they are not using it to provide retirement income.”

He said this could result in the government being faced with a dilemma.

“Given the family home is untaxed, the increased use of concessionally-taxed superannuation to pay off homes in retirement would not be what the government intended,” he said.

That could mean governments would be forced to review both superannuation and housing policy as “both superannuation and the age pension are predicated on high levels of home ownership”.

The HILDA report also showed that both men and women are retiring later with the average age of women retirees reaching 63.8 years in 2015 and men 66.1 years.

Mr Yates said the rise in retirement ages, while partly due to desire to work longer, also had a negative financial driver.

“A lot of people got frightened by the market crash accompanying the financial crisis and decided they need a bigger financial buffer before they retire.”

For 16 years the HILDA survey, run by the University of Melbourne, has polled the same 17,000 Australians.

The report’s author, Professor Roger Wilkins, pointed to the falling home ownership levels among younger people. In 2014, approximately 25 per cent of men and women aged 18 to 39 were home owners, down from nearly 36 per cent in 2002.

Younger people with housing debt saw average mortgages up from $169,000 to $336,500 between 2002 and 2014.

That reality plus rising prices meaning people have to save longer before buying “could result in the superannuation system being thwarted in its aim to provide retirement income by rises in outstanding mortgage debt”, Professor Wilkins told The New Daily.

Egalitarian or Edwardian? The rising wealth inequality in Australia

From The Conversation.

Recent commentary on levels of inequality exposes the myth that Australia is an egalitarian society in which the privileges of birth have little currency.

Focusing on inequality in the distribution of incomes ignores an equally important dimension of inequality: wealth. Wealth is much more unequally distributed than income. Therefore, ignoring wealth inequality skews perceptions of social inequality.

Perceptions of the levels of income and wealth inequality are derived from our day-to-day experiences. This means that not mixing with people from the other end of the wealth distribution can colour our perceptions of inequality.

The lack of official data on the wealth holdings of Australians hampers research into trends in wealth inequality. Between 1915 and 2003-04, there is almost no official wealth data to examine.

In 2003-04, the wealthiest 20% of Australian households held 58.6% of total household wealth, and the poorest 20% of households held just 1.4% of total household wealth. In 2013-14, the wealthiest 20% of households held 61% of total household wealth, and the poorest 20% of households held just 1% of total household wealth.

These figures indicate that wealth inequality increased over the decade to 2013-14.

The table below details trends over time in various measures of wealth inequality. The P90 to P10 ratio compares the wealth of households at the 90th percentile with that of households at the tenth percentile. A larger ratio indicates greater levels of inequality.

In 2003-04, households at the 90th percentile held 45 times as much wealth as households at the tenth percentile. In 2013-14, households at the 90th percentile of the distribution held 52 times as much wealth as households at the tenth percentile. This indicates that wealth inequality increased in that decade.

Using the mean and median household wealth figures, it is possible to calculate the ratio of median to mean wealth.

The closer this ratio is to one, the lower the level of inequality. In 2003-04, the ratio was 0.63. In 2013-14, it was 0.57. This also indicates that wealth inequality increased.


The distribution of household wealth also varies between Australia’s state and territories, and by location within states and territories.

Households in the ACT recorded the highest mean household wealth (A$890,100). Households in Tasmania recorded the lowest mean household wealth ($595,600).

When these figures are disaggregated by location into capital city households and households located in the rest of the state, the largest wealth gap occurs in New South Wales. The mean wealth of households in Sydney was $971,700, whereas the mean wealth of households in the rest of NSW was $534,700.

The median-to-mean-wealth ratios show wealth was most unequally distributed in Brisbane and Perth.


Given a relatively large proportion of household wealth is held in the form of property assets, the recently released Household, Income and Labour Dynamics in Australia Survey report identifies property as the key driver of increasing wealth inequality.

The percentage of 18-to-39-year-olds with property declined by 10.5 percentage points between 2002 and 2014. And the level of debt of those with a mortgage doubled in real terms.

So, fewer young adults have mortgages now compared to a decade ago, and those who do have mortgages have higher levels of debt.

Two other sources of publicly available data on wealth are the lists of the super-wealthy published annually by the Business Review Weekly in Australia and Forbes in the US.

Figures published in the Business Review Weekly show that, after adjusting for inflation, in 1984 the wealthiest 20 Australians held $8.25 billion in assets. In 2017, the wealthiest 20 Australians held $104 billion.

Forbes’ lists of billionaires (in $US) show that the number of billionaires living in Australia increased from two to 26 between 1987 and 2014.

Having an increasing number of billionaires would not be an issue if all Australians’ wealth was increasing at a similar rate. However, if the gap between the wealth of the billionaires and that of the average residents increases dramatically, there is likely to be discontent.

Drawing on figures published in the Credit Suisse Wealth Report, it is possible to compare the wealth of the billionaires with that of average Australians.

In 2014, the wealth of the 26 Australian billionaires was equivalent to 214,914 adults with average wealth.

Recent turmoil in the UK and the US may be an indicator that the “peasants are revolting” and are not willing to return to the 19th century, when the very rich lorded over the masses.

Australia has yet to experience mass demonstrations and voter backlashes. But events overseas should be ringing alarm bells among our politicians in Canberra.

Author: Jennifer Chesters , Research Fellow, Youth Research Centre, University of Melbourne

CBA says the money laundering issue was caused by a software update

From Business Insider.

The Commonwealth Bank says its current legal problem over allegations of allowing money laundering, which potentially could see Australia’s largest company facing massive fines, started with a simple software problem with its ATMs.

Australia’s largest company says: “In an organisation as large as Commonwealth Bank, mistakes can be made. We know that because we are a big organisation, these mistakes can have significant impact.”

Last week Australia’s financial intelligence and regulatory agency, AUSTRAC, took the Commonwealth to the Federal Court claiming the bank breached the Anti-Money Laundering and Counter-Terrorism Financing (AML/CTF) Act over combined cash deposits of $624.7 million.

The bank, in a statement this morning, says the issue began after an unrelated software update to Intelligent Deposit Machines, the latest ATMs, in late 2012.

A coding error meant the ATMs did not create reports when deposit amounts exceeded $10,000, the level at which transactions need to be reported to authorities.

“This error became apparent in 2015 and within a month of discovering it, we notified AUSTRAC ,” the bank says.

AUSTRAC alleges more than 53,700 contraventions and says the Commonwealth didn’t take steps to assess the risks of intelligent deposit machines until mid-2015, three years after they were introduced.

On the potential fines associated with the breaches, the Commonwealth says the alleged contraventions could be considered to arise from a single course of conduct, a systems error.

Late lodgement of transaction reports carries a penalty of up to $18 million, meaning that in theory the bank could be fined that amount for each late transaction report, adding up to more than $966 billion.

“Ultimately, a court will seek to ensure that, overall, any civil penalties are just and appropriate and do not exceed what is proper having regard to the totality of established contraventions,” the bank says.

“Under the Act, the only mechanism available to AUSTRAC to secure a pecuniary penalty from CBA is by taking court action.

“What we can say about those proceedings is limited until they have run their course.

“In the meantime, CBA remains committed to continuously improve its compliance with the AML/CTF Act and will continue to keep AUSTRAC abreast of those efforts.”

Today Commonwealth Bank CEO Ian Narev says he’s focused on doing his job and has no intention of stepping down. “Right now, I’m focused on doing my job and am not spending any time on thinking about my own position,” he says.

Here’s the full statement from the Commonwealth:

    • We respect greatly the role AUSTRAC plays in keeping Australians safe. To that end, we work closely with AUSTRAC as well as the Australian Federal Police and other authorities.

AUSTRAC filed legal proceedings on Thursday and we are taking these very seriously. We have been working our way carefully through the statement of claim. While legal proceedings limit the detail we are able to provide, we acknowledge the public interest in this matter, and are committed to being as open as we can with updates to all our stakeholders.

We have already said we will file a statement of defence. We do not intend to litigate this matter publicly; our responses have been made in consideration of the desire for greater information by our people, shareholders, customers and the community.

There has already been extensive public discussion and because of the complexity of the matter, some facts are worth clarifying.

Our Intelligent Deposit Machines (IDMs) are now providing the correct Threshold Transaction Reports (TTRs) to AUSTRAC, and have been since September 2015.

When we first rolled out these machines in May 2012, they were providing all the correct TTR reporting. The issue began after an unrelated software update to the IDMs in late 2012. Following the software update, a coding error occurred which meant the IDMs did not create the TTRs needed. This error became apparent in 2015 and within a month of discovering it, we notified AUSTRAC, delivered the missing TTRs and fixed the coding issue. The vast majority of the reporting failures alleged in the statement of claim (approximately 53,000) relate specifically to this coding error. We recognise that there are other serious allegations in the claim unrelated to the TTRs.

In an organisation as large as Commonwealth Bank, mistakes can be made. We know that because we are a big organisation, these mistakes can have significant impact.

We need to be ever more vigilant in the area of financial crime and anti-money laundering. The rapid evolution of technology in banking, the increased sophistication of criminal activity, and higher regulatory expectations together create an imperative to continuously raise our standards. We have increased our investment in people, technology and processes through a program designed not only to address existing weaknesses, but also to meet the growing complexity in this area. This work continues today.

We continue to have an ongoing cooperative relationship with AUSTRAC and have kept them abreast of proactive steps we have taken to further enhance our compliance program and operations.

Bitcoin’s ‘hard fork’ becomes a reality

From Fintech Business.

Bitcoin cash has entered the scene as bitcoin finally split into two this week following years of community infighting about the future of the bitcoin blockchain.

However, Melbourne-based Blockchain Centre chief executive Martin Davidson said bitcoin cash was just one among many other ‘alt coins’, or bitcoin alternatives, available.

“Bitcoin cash can be thought of as another alt coin just like Litecoin and hundreds of other crypto currencies which have been created by a group of developers who want bitcoin to have a larger block size, rather than follow the road map set out by the Bitcoin Core development team,” Mr Davidson said.

The new bitcoin cash blockchain contains all the information from the previous blockchain but has eight times more transactional capacity (8 megabyte) than the original (1 megabyte), making transaction speeds on the new virtual currency much faster.

The fork was triggered due to a split in the bitcoin community over how to handle the increasing volume of traffic on the 1 megabyte blocks as bitcoin grew more popular.

Though bitcoin cash is only a few days old, it’s possible it will have its own community of users, much like ethereum classic and ethereum, according to Mr Davidson.

“It’s quite possible bitcoin cash will have its own network infrastructure, application layer services and new user base who like the value bitcoin cash brings over the existing, longest standing and most valuable crypto currency, the original bitcoin,” he said.

Blockchain Australia board member Lucas Cullen says most of the bitcoin community is resistant to change, and will likely gravitate towards the coin with the better software.

“There have been many attempts to convince the community that their version [of bitcoin] is better, but most of the time it’s about a majority — and I think most of the bitcoin community are pretty stubborn and pretty resistant to change,” Mr Cullen said.

“We’re pretty risk adverse.”

Announced in a tweet by CoinDesk, the first bitcoin cash block was mined at 2:14am on 2 August (EST). Since then, 24 more blocks have been mined (at the date of writing).

The value of bitcoin dropped from US$2,854 to $2,729 on the day of the fork, and bitcoin cash already has a market value of US$7 billion, according to Mr Davidson.

“And its great news from a financial perspective for all bitcoin holders as everyone who held their own bitcoins before the chain split or fork, now have an equal amount of bitcoin cash coins also,” he said.