More Evidence of Mortgage Distress

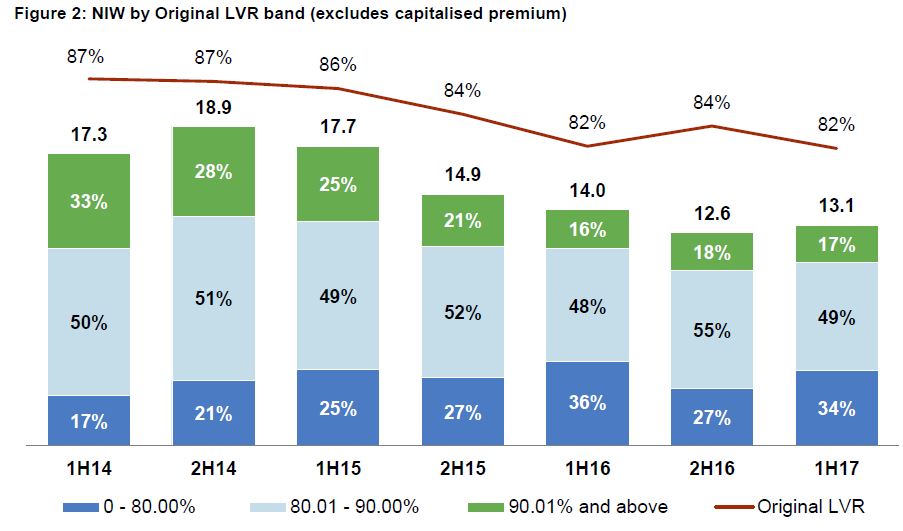
Genworth, the listed Lenders Mortgage Insurer (LMI) released their 1H17 results today, and as a bellwether for the mortgage industry, they make interesting reading.  We see continued pressure on mortgage defaults in WA (0.86%) and QLD (0.72%), and a fall in higher LVR lending leading to lower volumes of new premiums being written, but at higher prices.  The average original LVR of new flow business written in 1H17 was 82%.

They reported a statutory net profit after tax (NPAT) of $88.7 million for 1H17. After adjusting for the after-tax mark-to-market move in the investment portfolio of $24.8 million, underlying NPAT was $113.5 million. Compared with IH16, net written premiums were down 7.5%, reported NPAT was down 34.7%, the loss ratio was up 1.8% and the delinquency rate was up 8 basis points. The ROE was down 3.4%. They also suffered a decline in investment returns, from 3.53% (IH16) to 2.88% this time.

Net claims incurred decreased 2.4% which included the $8.2 million favourable impact of a periodic review of its non-reinsurance recoveries on paid claims. This benefit was partially offset by an increase in delinquencies from Queensland and Western Australia, particularly in regions exposed to the slowdown in the resources sector.

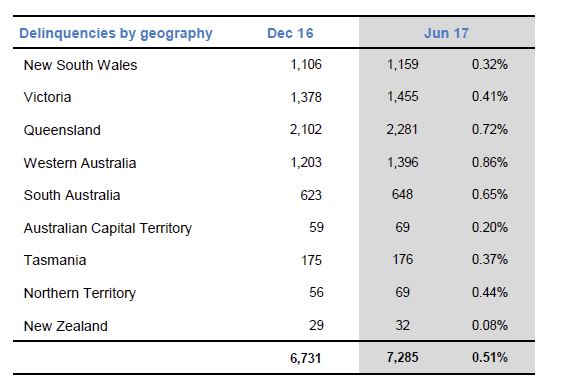
5,997 new delinquencies were added in 1H17 with a total of 7,285 on book, reflecting a delinquency rate of 0.51%, up from 0.46% in 2H16. Cures were higher, reflecting ongoing borrower sales activity.

Genworth has commercial relationships with over 100 lender customers across Australia and has Supply and Service Contracts with 8 of its key customers. The top three customers accounted for approximately 66 % of Genworth’s total New Insurance Written (NIW) and 71 % of GWP in 1H17. The largest customer accounted for 37 % of total NIW and 51 % of GWP in 1H17. The Group estimates that it had approximately 30 % of the Australian LMI market by NIW for the six months ended 30 June 2017.

On 10 March 2017, Genworth announced that the exclusivity agreement for the provision of LMI with its second largest customer was terminated in April 2017. The LMI business underwritten under this contract represented 14% of Gross Written Premium (GWP) in 2016. The Company has been successful in entering into new business with that customer that assists them in managing mortgage default risk through alternative insurance arrangements.

Genworth also previously advised that its customer, the National Australia Bank, has issued a Request For Proposal relating to its LMI requirements. The Company has submitted its proposal and will provide updates as to the outcome of its proposal.

Genworth continues to pursue other profitable opportunities in the market that meet its risk appetite and return on equity profile.

They showed their delinquency by year of acquisition.

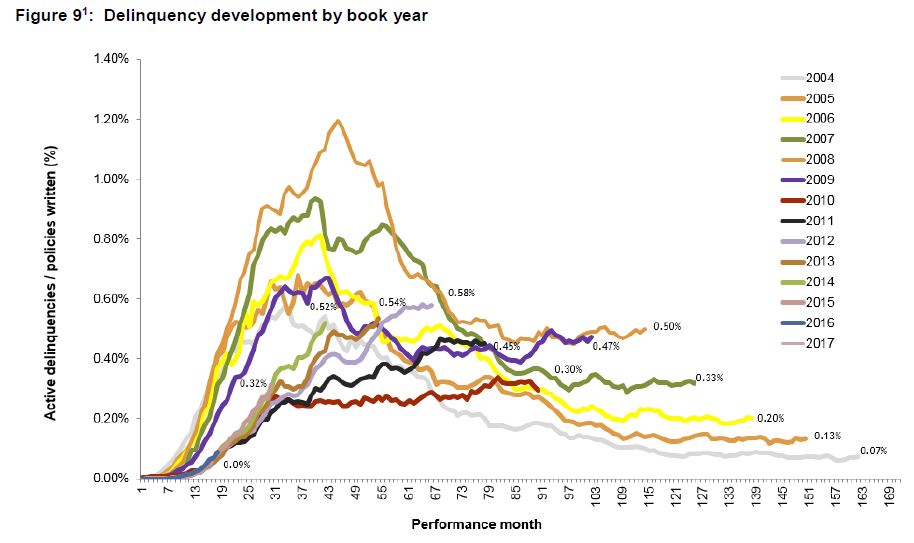
Each line illustrates the level of 3 month+ delinquencies relative to the number of months an LMI policy has been in-force for policies issued within a specific year.

2008 Book Year was affected by the economic downturn in Australia and heightened stress experienced among self-employed borrowers, particularly in Queensland, which was exacerbated by the floods in 2011.

Post-GFC book years seasoning at lower levels as a result of credit tightening, however ongoing deterioration for 2012-14 books have been predominantly driven by resource reliant states of QLD and WA that are continuing to face challenges following the mining sector downturn.

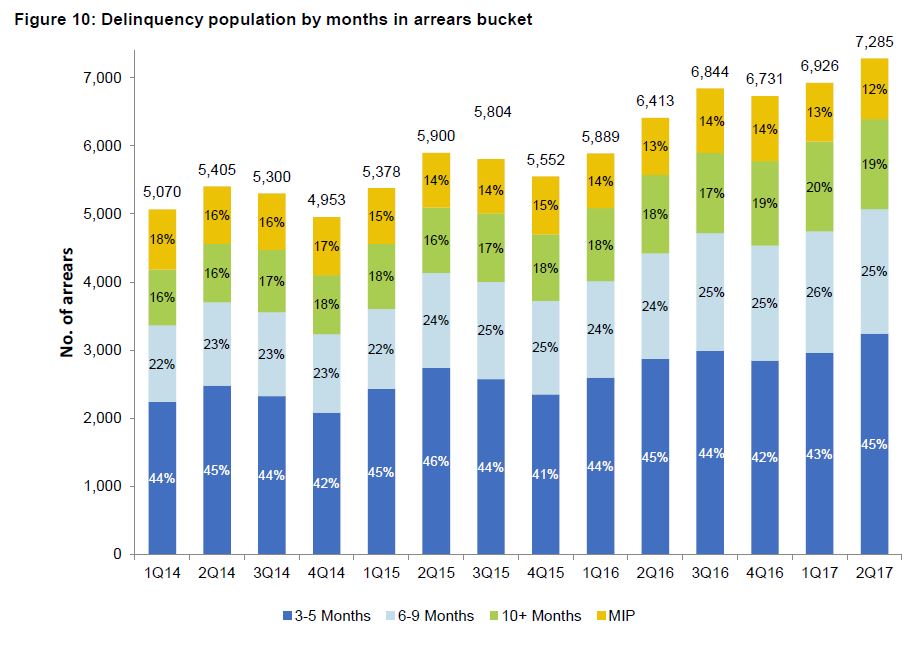
The above chart illustrates the delinquency population by months in arrears (MIA) aged bucket at the end of each reporting period. Over the past two years, the mortgagee in possession (MIP) percentage as a proportion of the total delinquency population has been trending down.

This reflects strong housing market conditions and the low interest rate environment in which a MIP generally progresses faster to a claim, or sold with no claim, which in turn leads to a relatively lower claims pipeline.

The 3-5 months MIA bucket shows a seasonal uptick in the second quarter of each year, consistent with historical observed experience.

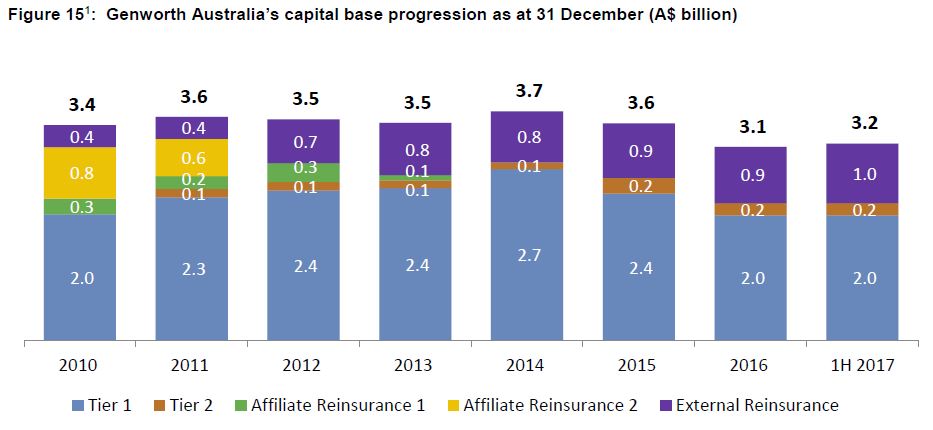
The CET1 capital did not materially change in 1H17 reflecting the $88.7 million Reported NPAT being offset by the $71.3m dividends paid and a $17.0 million decrease in the excess technical provisions. The PCA coverage ratio increased from 1.57x to 1.81x, mainly through a $135.8 million reduction in the PML and a $50 million increase in Allowable Reinsurance.

The Board declared a fully franked interim ordinary dividend of 12.0 cents per share and a fully franked special dividend of 2.0 cents per share both payable on payable on 30 August 2017 to shareholders registered on 16 August 2017.

Heat on RBA as residential property borrowing hits a record

From The AFR.

Residential property borrowing continues to grow despite repeated attempts by regulators to jawbone banks and borrowers into cutting back, according to official statistics.

The nation’s bill for house borrowing has hit a record $1.69 trillion, which is bigger than the country’s gross domestic product and nearly equivalent to superannuation savings, the latest numbers from the Reserve Bank of Australia reveal.

Borrowers and mortgage brokers, which act as intermediaries between property buyers and lenders, claim that overall demand and loan growth remains strong, despite more subdued investor demand in some markets.

Investors continue to dominate total property borrowing, despite efforts by banks and regulators to encourage owner-occupiers and reduce speculative demand in the overheating sector.

Westpac Group is growing its loan book the most aggressively. Commonwealth Bank of Australia is pulling back hard on interest-only investors, while non-bank lenders, which recently came under the regulatory aegis of APRA, are making big gains.

John Flavell, chief executive of listed brokerage Mortgage Choice, said overall demand is robust and any slowing was probably due to seasonal factors, such as colder weather.

Buyer demand is expected to be boosted by first-time home buyer incentives due to be introduced in the immediate future.

About $55 billion worth of interest-only investor loans, or about 10 per cent of the category’s loan book, have been switched to owner-occupiers in response to a sustained campaign by regulators and lenders during the past 12 months, according to the RBA.

Speed and growth limits have been imposed on lenders to reduce interest-only repayments because of regulatory concerns that lower rates were driving up prices and increasing financial distress, according to the RBA.

But investors continue to dominate the property market, with investor loans rising by 7.4 per cent in the 12 months to the end of June, compared to 6.2 per cent growth in owner-occupiers, the RBA numbers reveal.

Banking analysts described the message as “mixed” because consumer credit growth exceeded their estimates and business credit was below.

But strong weekend auction clearance results of more than 70 per cent and record prices for development sites and prestige properties continue to defy regulatory attempts to lower demand for property.

“This is nuts,” said Martin North, principal of Digital Finance Analytics, an independent consultancy. “Either the regulators are not serious about slowing household debt growth and recent language is simply lip service, or they are hoping their interventions so far will work through, given time.”

All the major lenders are below the 10 per cent speed limit imposed by the Australian Prudential Regulation Authority, with Macquarie Bank and Bank of Queensland well under the cap. Those over the cap include ME Bank and Bank of Australia.

Investment interest-only loans are typically about 31 basis points higher than 12 months ago, according to analysis by Canstar, which compares interest rates.

That more than doubles the average increase for investment principal and interest loans. Owner-occupied principal and interest loans have fallen on average by about seven basis points.

Non-bank lenders, which have been offering much more competitive rates than main street authorised deposit-taking institutions, have posed a $5 billion increase in their loan books to $115 billion.

The four majors grew their residential property books by about 5.4 per cent during the 12 months to June with Westpac up by 6.5 per cent, NAB 6.2 per cent CBA 6.2 per cent and ANZ 4.4 per cent.

Our second-class citizens – kids who can’t leave home

From The New Daily.

This year’s Household, Income and Labour Dynamics in Australia (HILDA) survey results confirm, with damning certainty, how Australia is spiralling back into inequality based around property ownership.

The Household, Income and Labour Dynamics in Australia survey, one of the most comprehensive studies of social and economic trends, shows the proportion of 18 to 39-year-olds owning their own home slumping from 36 per cent in 2002 to just 25 per cent today.

Within that figure, couples with dependent children went from an ownership rate of 55.5 per cent 15 years ago, to just 38.6 per cent.

That’s important, because it is parents passing wealth down to their children that are once again starting to define who gets into property and who doesn’t – we’re going back to a 1950s-style class division.

All in the numbers

To see how, consider the way assets grow in value over time, and the relationship between inflation-adjusted (‘real’) growth, and nominal growth.

Imagine a couple buying a home in Brisbane in 2002 at the age of 25. When they hit 40 this year, two things will have happened.

Firstly, for any given interest rate, the real value of their monthly mortgage payments will be lower thanks to the eroding effect of inflation.

Assuming their income had only just kept pace with inflation, their repayments after 15 years would be, for any given interest rate, only 70 per cent as large a chunk of their pay packets.

Secondly, the home would be worth about 1.9 times as much in inflation-adjusted terms, or 2.7 times as much in nominal dollars, based on ABS data.

Those left behind

By contrast, a 25-year-old couple who decided not to buy in 2002, but who at the age of 40 decided to do so today, faces two financial nasties – they’ll need a much larger deposit; and they’ll have to hand over a much larger chunk of their income each month if they want to pay off the home by retirement.

If this example were set in the 1980s and 1990s, you might say “it’s their own stupid fault”.

And you’d probably be right – the barriers to entering the housing market were much lower then.

Today, however, the HILDA numbers describe a housing market in which many young Australians have no choice about getting into the market.

Since the turn of the millennium, house prices across Australia have roughly doubled in inflation-adjusted terms, and a deposit for a home can’t just be ‘scraped together’ by maxing-out a few credit cards and smashing the piggy bank.

So young Australians have three options: stay at home for years more and save madly for a deposit; move out and rent, saving even more madly for a deposit; or receive a windfall gift or loan from the ‘bank of Mum and Dad’.

The HILDA data shows more young Aussies opting for the first option. In 2001, 43 per cent of men and 27 per cent of women aged 22 to 25 lived with their parents, but those numbers have now ballooned to 60 per cent for men and 48 per cent for women.

The old progression of moving out and renting, scraping together a deposit, and then moving into property ownership is almost impossible for many – unless the ‘bank of Mum and Dad’ is able to help.

A compounding problem

When Mum and Dad are unable to help with a deposit, the effects on wealth equality begin to compound.

Today’s 25-year-olds who do not have family money behind them will take much longer to get into the market, meaning they’ll have smaller capital gains behind them when their own children come asking for help.

Buying a home has never been a universal right, but as detailed last week, it’s something that at its peak was available to 71.4 per cent of Australian households.

As that number slides lower – or tumbles lower for younger groups – it’s time to face facts.

The new class divide in Australia is between those who have generous property-owning parents, and those who do not.

Home ownership falling, debts rising – it’s looking grim for the under 40s

From The Conversation.

Home ownership among young people is declining, as mortgage debt almost doubles for the same age group, results from the Household Income and Labour Dynamics in Australia (HILDA) survey show. It also shows young people are living with their parents longer.

The Melbourne Institute of Applied Economic and Social Research undertakes the survey every year. It’s Australia’s only nationally representative household longitudinal study, and has followed the same individuals and households since 2001.

The survey shows the rate of home ownership among 18 to 39 year olds declined from 36% in 2002 to 25% in 2014. In the same age group, the decline in home ownership has been largest for families with dependent children, falling from 56% to 39%.

Even for those in this group who manage to buy a home, mortgage debt has risen dramatically. In 2002, 89% of home owners in this age range had mortgage debt. By 2014 this had risen to 94%.

More significantly, the average home debt rose considerably. Expressed in December 2015 prices, average home debt grew from about A$169,000 in 2002 to about A$337,000 in 2014. Low interest rates since the global financial crisis have meant mortgage repayments for these home owners have remained manageable, but this group is very vulnerable to rate rises.

Detailed wealth data in the survey, collected every four years since 2002, show this increase in debt and decrease in ownership are part of a trend in the wider population. HILDA shows 65% of households were in owner-occupied dwellings in 2015, down from 69% in 2001.

In fact, the decline in home ownership has been greater than the decline in owner-occupied households. This is largely because adult children are living with their parents for longer.

For example, the HILDA data show that the proportion of women aged 22 to 25 living with their parents rose from 28% in 2001 to 48% in 2015. For men this proportion rose from 42% to 60%.

Among those who manage to access the housing market, the data shows that the growth in home debt is not simply because they are borrowing more to purchase their home. A surprisingly high proportion of young home owners (between 30% and 40%) actually increase their debt from one year to the next, despite most of them remaining in the same home. Even over a four-year period – for example, from 2010 to 2014 – at least 40% of young home owners with a mortgage increase their nominal home debt.

The proportion of people with home debt that exceeds the value of their home – that is, negative equity – has also risen. In 2002, 2.4% of people had negative equity in their home; in 2014, 3.9% had negative equity. This is a relatively small proportion, but this could change as even small decreases in house prices will result in substantial increases in the prevalence of negative equity.

How this changes with location, income and profession

In 2014, less than 20% of Sydneysiders aged 18 to 39 were home owners, compared with 36% or more in the ACT, urban Northern Territory and non-urban regions of Australia. To a significant extent this reflects differences across regions in house prices.

Sydney and Melbourne have particularly high house prices, while non-urban areas generally have comparatively low house prices. Regional differences in the incomes of 18 to 39 year olds also play a role.

Those with the highest home-ownership rates are professionals and, to a lesser extent, managers. They experienced relatively little decline in home ownership.

For workers in other occupations, home ownership has declined substantially. In 2014 home ownership was especially rare among community and personal services workers, sales workers and labourers.

This decline represents profound social change among this age group, where renting is increasingly becoming the dominant form of housing. In 2002, 61% of people aged 35 to 39 were home owners – a clear majority of their age group. By 2014, this proportion had fallen to 48%.

The changing housing situation of young adults is part of a broader change in the distribution of wealth in Australia. The HILDA Survey shows that differences in average wealth by age have grown since 2002. For example, in 2002, median net wealth of those aged 65 and over was 2.8 times that of people aged 25 to 34. In 2014, this ratio had increased to 4.5.

The decline in home ownership among young adults and this broader trend in wealth have implications for their long-term economic wellbeing and indeed for the retirement income system. Even if house price growth moderates and many of those currently aged under 40 ultimately enter the housing market, it’s likely that a rising proportion will not have paid off the mortgage by the time they retire. It may be that many will resort to drawing on superannuation balances to repay home loans, in turn increasing demands on the Age Pension.

Author: Roger Wilkins, Professorial Research Fellow and Deputy Director (Research), HILDA Survey, Melbourne Institute of Applied Economic and Social Research, University of Melbourne

How to reshape the financial system? First ditch the idea of the free market

From The Conversation.

Ten years ago the financial system collapsed and governments around the world intervened to save it. Much of the subsequent legislation, regulation and angst has attempted to make the system less risky so it does not collapse again. But few have asked a more fundamental question: what is the purpose of the financial system and does it do what it’s supposed to do?

Ten years on and the global financial system remains chronically dysfunctional. My concern is not that it collapses again but that it continues on its current course.

Yet an alternative way of doing things is possible. Over many years the finance industry has developed a set of powerful tools which could be used to improve well-being and solve our environmental problems. For example, to avoid dangerous climate change, the required rapid shift away from fossil fuels requires enormous levels of investment into low carbon infrastructure.

We mostly know how to do this technically, and the funds are available; there is a savings surplus where trillions of dollars are sitting in government bonds earning negative returns that could be mobilised into the low carbon economy. So why is this investment not happening at the scale required?

A sustainable future requires investment but the payoff is worth it. shutterstock.com

Instead, these powerful financial tools have been co-opted by the finance industry for the purpose of growing its own revenue and importance, with resultant collateral damage to society and the environment.

Blame is commonly attributed to the neoliberal rule of the market, greed and deregulation.

My diagnosis is different: financial markets are the creation of society, and we have set them up in the wrong way, based on faulty economic theories. Governments have outsourced the management of societies’ assets to the finance industry and set the industry the wrong incentives. So we need to rethink how we want our assets managed and reset the incentives to achieve this.

Government power

The tools of finance are powerful because they are used to allocate society’s capital, and this determines the future direction of the economy. So, the Chinese government, for example, has decided to direct finance, in co-ordination with other policies, towards manufacturing-export industries, and these sectors have rapidly grown.

In the UK economy, this decision has been given to the finance sector, which invests people’s savings, for example via pension funds and bank accounts. The justification is that free markets will make the best decision on where to allocate resources. The most efficient users of capital will be able to pay the best return so everyone will be better off.

Yet, the reality is that we don’t have free financial markets. People mostly save via capital markets because they are induced to do so by the government. The most important financial variable is the interest rate, which is set by a government agency, the largest asset class are government bonds, only a restricted group of government-mandated banks can accept deposits, and government regulation shapes the way markets work. For example there are over 100,000 pages of pension regulations alone. Plus, the whole system owes its existence to the 2008 bail out. So, seeing that financial markets are not free, the theory that free markets are efficient and reflect peoples’ social preferences is not applicable.

It is evident that the financial system does not efficiently allocate people’s money. The finance sector has grown to an enormous size and looks anything but efficient: half of all savings are ultimately eaten up by charges, less than 4% of savings are actually invested at all (the rest spends its life as perpetually traded abstract financial assets), the system is prone to asset bubbles and crashes, returns have been driven down to close to zero making a pension unaffordable, the level of debt in the economy has increased unsustainably.

Only a small percentage of savings are invested in the real economy. shutterstock.com

Instead of stewarding the corporates they oversee, investment managers encourage corporates to make short-term decisions to boost their share price. The example of banks’ behaviour in the run up to the financial crisis was a dramatic manifestation. More pernicious are incentives for companies to return money to shareholders rather than invest in staff or infrastructure, undermining social cohesion (through inequality) and the long-term prospects of the economy.

Deciding what we want

So how could we achieve a better system? The government currently supports, promotes and sets incentives for finance based on an inapplicable economic theory to perpetuate a system that doesn’t work. Instead, we need to decide on what we want finance to do and set incentives to achieve the outcomes we want.

For example, in return for the continued support of the finance system, the finance industry should have to demonstrate that it is socially useful. Banks that have the right to create money and are guaranteed by governments should preference lending to create jobs and other social benefits (the proportion of lending to the “real” economy by banks is negligible).

To benefit from a tax rebate, pensions and savings products should have to demonstrate a positive social benefit or invest in sustainable infrastructure and R&D. The sustainable finance tools to do this exist and have been tried and tested over an extended period.

Defining what is socially useful is problematic, but it is not a problem that we can duck. Currently the government support for finance has an ethical basis – theoretically efficient free markets to ensure that the economy runs at maximum potential. This may be a worthy value, but it does not apply to our current non-free financial markets. We need to decide what values we want finance to embody, and then set the rules to achieve these.

Author: Nick Silver, Honorary Senior Visiting Fellow at CASS, City, University of London

RBA Holds Cash Rate Once Again

The RBA held the cash rate today, and gave little new information, though suggesting that growth is still expected to pick up, and employment improve, but not wage growth. They also warn “growth in housing debt has been outpacing the slow growth in household incomes”, signalling even higher household debt. What was new was a warning about the drag effect on growth of a higher dollar!

At its meeting today, the Board decided to leave the cash rate unchanged at 1.50 per cent.

Conditions in the global economy are continuing to improve. Labour markets have tightened further and above-trend growth is expected in a number of advanced economies, although uncertainties remain. Growth in the Chinese economy has picked up a little and is being supported by increased spending on infrastructure and property construction, with the high level of debt continuing to present a medium-term risk. Commodity prices have generally risen recently, although Australia’s terms of trade are still expected to decline over the period ahead.

Wage growth remains subdued in most countries, as does core inflation. Headline inflation rates have declined recently, largely reflecting the earlier decline in oil prices. In the United States, the Federal Reserve expects to increase interest rates further and there is no longer an expectation of additional monetary easing in other major economies. Financial markets have been functioning effectively and volatility remains low.

The Bank’s forecasts for the Australian economy are largely unchanged. Over the next couple of years, the central forecast is for the economy to grow at an annual rate of around 3 per cent. The transition to lower levels of mining investment following the mining investment boom is almost complete, with some large LNG projects now close to completion. Business conditions have improved and capacity utilisation has increased. Some pick-up in non-mining business investment is expected. The current high level of residential construction is forecast to be maintained for some time, before gradually easing. One source of uncertainty for the domestic economy is the outlook for consumption. Retail sales have picked up recently, but slow growth in real wages and high levels of household debt are likely to constrain growth in spending.

Employment growth has been stronger over recent months, and has increased in all states. The various forward-looking indicators point to continued growth in employment over the period ahead. The unemployment rate is expected to decline a little over the next couple of years. Against this, however, wage growth remains low and this is likely to continue for a while yet.

The recent inflation data were broadly as the Bank expected. Both CPI inflation and measures of underlying inflation are running at a little under 2 per cent. Inflation is expected to pick up gradually as the economy strengthens. Higher prices for electricity and tobacco are expected to boost CPI inflation. A factor working in the other direction is increased competition from new entrants in the retail industry.

The Australian dollar has appreciated recently, partly reflecting a lower US dollar. The higher exchange rate is expected to contribute to subdued price pressures in the economy. It is also weighing on the outlook for output and employment. An appreciating exchange rate would be expected to result in a slower pick-up in economic activity and inflation than currently forecast.

Conditions in the housing market vary considerably around the country. Housing prices have been rising briskly in some markets, although there are some signs that these conditions are starting to ease. In some other markets, prices are declining. In the eastern capital cities, a considerable additional supply of apartments is scheduled to come on stream over the next couple of years. Rent increases remain low in most cities. Investors in residential property are facing higher interest rates. There has also been some tightening of credit conditions following recent supervisory measures to address the risks associated with high and rising levels of household indebtedness. Growth in housing debt has been outpacing the slow growth in household incomes.

The low level of interest rates is continuing to support the Australian economy. Taking account of the available information, the Board judged that holding the stance of monetary policy unchanged at this meeting would be consistent with sustainable growth in the economy and achieving the inflation target over time.

ASIC reports on Australian bank audits following Wells Fargo misconduct

ASIC has outlined the results of audits conducted by eight banks in Australia following the regulatory action taken in the United States against Wells Fargo Bank, N.A. (Wells Fargo) in late 2016. Overall, the audits did not find evidence of systemic misconduct involving illegal opening of accounts as seen at Wells Fargo.

While not identifying systemic unlawful conduct, the results of the audits indicated that improvements should be made to the sale of consumer credit insurance (CCI), which is leading to further action announced today (refer: 17-255MR).

Conduct at Wells Fargo

In late 2016, Wells Fargo was fined US$100 million by United States regulators after it was found that its staff had systematically and unlawfully opened as many as two million customer accounts since 2011. Many customers incurred fees and other charges as a result.

The misconduct at Wells Fargo involved widespread secret opening of accounts by employees in order hit sales targets spurred by compensation incentives. In most cases, customers were completely unaware that the accounts had been opened.

Audits by Australian banks

Although ASIC did not have information to suggest that similar systemic misconduct had been occurring in Australia, in December 2016 ASIC required eight banks to audit their sales practices. The audits were designed to identify whether aggressive sales targets had driven bank staff to act illegally by issuing products without customer knowledge or consent.

ASIC required audits of:

  • ANZ
  • Bank of Queensland
  • Citibank
  • Commonwealth Bank
  • HSBC
  • NAB
  • Suncorp
  • Westpac

The audits examined processes in relation to three common consumer banking products: basic deposit products, credit cards and CCI from 2014 to 2016. The audits reviewed:

  • Account and product onboarding processes, with a focus on customer acknowledgement and account activation controls;
  • Details of the processes in place to proactively detect potential misconduct arising from sales incentives;
  • Analysis of complaints where customers claimed they had not applied for an account or product;
  • Details of internal reporting processes to ensure senior management had visibility of potential issues; and
  • Organisational whistleblower processes and protections.

All of the audits found that the systemic misconduct that occurred at Wells Fargo had not been occurring in the banks and that, overall, controls were adequate to prevent and identify misconduct.

However, while systemic illegal misconduct was not identified, the audits highlighted CCI as a standout product for customer complaints and at heightened risk for sale without proper informed customer consent. The audits also identified potential weaknesses in account opening and activation controls, record keeping, and change of address processes in relation to CCI. The banks have commenced enhancing their controls and processes in light of the audit findings.

ASIC Deputy Chair Peter Kell said the audits were an example of ASIC proactively responding to potential issues in the market: ‘These audits were all about ensuring that banks were not – intentionally or inadvertently – encouraging illegal sales practices by staff and that the banks have processes in place to identify unlawful selling of retail banking products,’ he said.

Following the audit findings, ASIC has announced today it will be working with the banking industry and consumer advocates to improve sales practices in relation to CCI, including the introduction of a deferred sales model for CCI sold with credit cards over the phone and in branches (refer: 17-255MR).

Changes to bank sales incentives

The Retail Banking Remuneration Review conducted by Mr Stephen Sedgwick AO (published on 19 April 2017) identified that some current sales incentives could promote behaviour that is inconsistent with customers’ interests. All banks involved in the review will be moving away from a primary sales-based reward structure for frontline staff to one that reduces conflicts of interest between staff and customers.

Mr Kell welcomed the banks’ move toward sales incentives based on customer experience: ‘Sales staff should be ensuring first and foremost that consumers understand what they’re purchasing and that what they buy meets their needs. ASIC supports sales processes and incentives that are consistent with these objectives.’

NAB Retail Will Align Staff Incentives To Customer Outcomes

NAB is changing the incentives program for its most senior branch and contact centre managers, to reward delivery of great customer outcomes, leadership, and performance.

More than 700 NAB Retail branch managers, assistant branch managers, and sales team leaders in consumer call centres will move from their existing incentive plan to NAB’s Group Short Term Incentive (STI) Plan.

This will take effect from 1 October 2017, well ahead of the 2020 deadline set by Stephen Sedgwick AO for bank remuneration reforms.

NAB Chief Customer Officer of Consumer Banking and Wealth, Andrew Hagger, said the change will see greater emphasis placed on customer outcomes, actions and behaviours, not just product sales, for staff incentives.

“Our branch managers are the respected and trusted face of our business in the community, and their priority is to deliver the best outcomes for customers,” Mr Hagger said.

“This change to our staff incentive program sends a very clear message: that the customer must be at the heart of everything we do, and that great leadership is both valued and rewarded.”

The NAB Group STI Plan has a sharp focus on deep understanding of customer needs, and also links incentives to an overall assessment against a range of factors, including risk management, conduct, and adherence to NAB values.

“We’ve heard the message from our customers and the community, and we’re taking action to make banking better for our customers,” Mr Hagger said.

The move of these employees to the Group STI Plan is consistent with final recommendations made by Stephen Sedgwick AO in April as part of the Australian Bankers’ Association’s Better Banking reform package, which aims to protect consumer interests, increase transparency and accountability, and build trust and confidence in the industry.

“This change is just one of many things we’re doing to ensure we are better serving our customers,” Mr Hagger said.

“Over the coming 12 months we will continue to review our practices – including things that influence our culture, such as performance plans, incentives, visual management, and team meeting structures – to ensure we are consistently delivering great customer outcomes,” Mr Hagger said.

NAB has already made a number of other changes to its employee remuneration structure, including:

  • In 2016, NAB moved away from performance-based, fixed pay increases for customer service and support staff. These staff receive a standard pay rise of 3% per year, under our 2016 NAB Enterprise Agreement;
  • All of our people have a balanced scorecard where demonstration of values is as important as performance metrics;
  • We have introduced higher standards for conduct and compliance; and
  • NAB was the first bank to commit to implementing the Sedgwick reforms and we aim to implement them well ahead of the 2020 deadline.

Mortgage Stress Gets Worse in July

Digital Finance Analytics has released mortgage stress and default modelling for Australian mortgage borrowers, to end July 2017.  Across the nation, more than 820,000 households are estimated to be now in mortgage stress (last month 810,000) with 20,000 of these in severe stress. This equates to 25.8% of households, up from 25.4% last month. We also estimate that nearly 53,000 households risk default in the next 12 months, 2,000 down from last month.

We have been tracking the number of households in stress each month since 2000, and since a small easing in February 2016, the number under pressure have been rising each month.  The RBA cash rate cuts have provided some relief, especially directly after the GFC, but now mortgage rates appear to be more disconnected from the cash rate as banks seek to rebuild their margins.

The main drivers of stress are rising mortgage rates and living costs whilst real incomes continue to fall and underemployment is on the rise.  This is a deadly combination and is touching households across the country, not just in the mortgage belts. On the other hand, employment remains strong in NSW in particular, so income rose a little and small reductions in some owner occupied mortgage rates helped too.

This analysis uses our core market model which combines information from our 52,000 household surveys, public data from the RBA, ABS and APRA; and private data from lenders and aggregators. The data is current to end July 2017.

We analyse household cash flow based on real incomes, outgoings and mortgage repayments. Households are “stressed” when income does not cover ongoing costs, rather than identifying a set proportion of income, (such as 30%) going on the mortgage.

Those households in mild stress have little leeway in their cash flows, whereas those in severe stress are unable to meet repayments from current income. In both cases, households manage this deficit by cutting back on spending, putting more on credit cards and seeking to refinance, restructure or sell their home.  Those in severe stress are more likely to be seeking hardship assistance and are often forced to sell.

Martin North, Principal of Digital Finance Analytics said “flat incomes and underemployment mean rising costs are not being managed by many, and when added to rising mortgage rates, household budgets are really under pressure. Those with larger mortgages are more impacted by rate rises”.

“The latest housing debt to income ratio is at a record 190.4[1] so households will remain under pressure. Stressed households are less likely to spend at the shops, which acts as a drag anchor on future growth. The number of households impacted are economically significant, especially as household debt continues to climb to new record levels.”

“We continue to see the spread of mortgage stress in areas away from the traditional mortgage belts. A rising number of more affluent households are also being impacted.”

Regional analysis shows that NSW has 225,090 households in stress, VIC 229,988 (217,655 last month), QLD 144,825 (141,111 last month) and WA 107,936 (106,984 last month). The probability of default fell a little, with around 10,000 in WA, around 10,000 in QLD, 13,000 in VIC and 14,000 in NSW. There were falls of about 1,000 from last month in NSW and VIC, thanks to improved employment prospects. Probability of default extends our mortgage stress analysis by overlaying economic indicators such as employment, future wage growth and cpi changes.

Here are the top 30 post codes sorted by risk of default estimated over the next 12 months.

[1] *RBA E2 Household Finances – Selected Ratios March 2016