
The RBA released a freedom of information request today. They say:
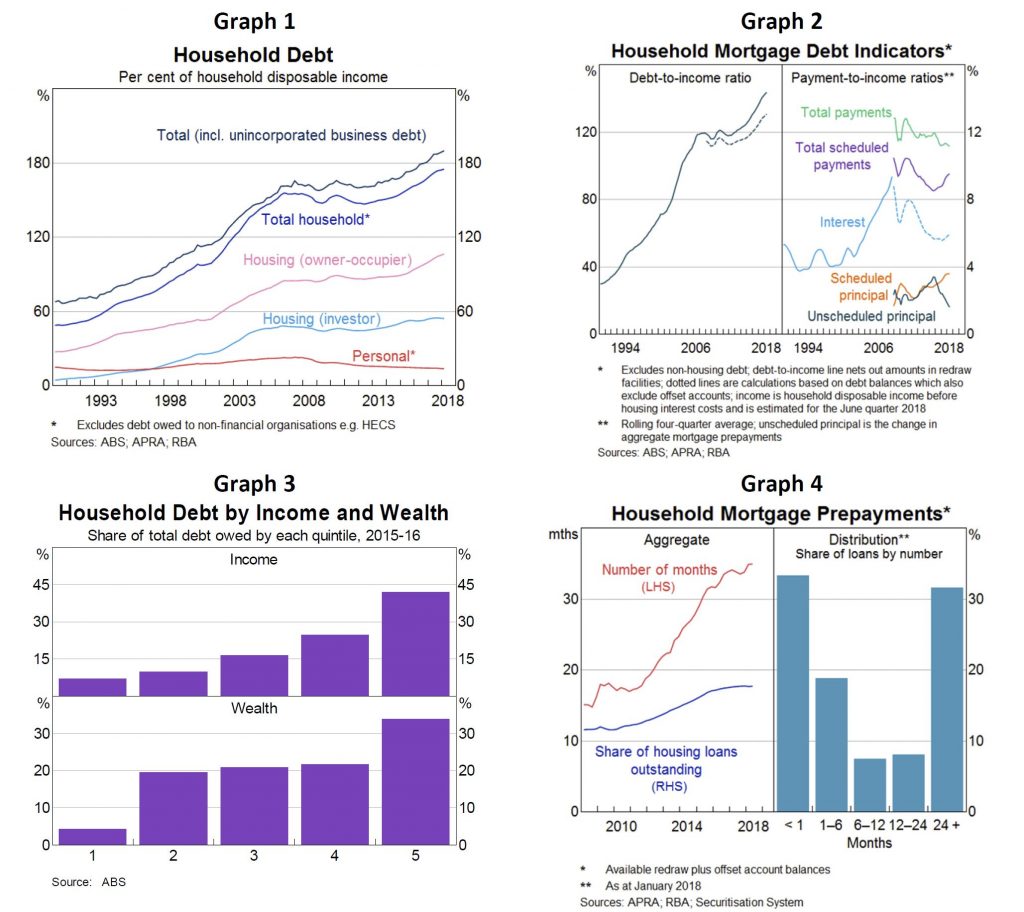
Household debt-to-income has drifted up, to 190 per cent (Graph 1 – broad measure, includes debt of unincorporated enterprises, new migrants’ offshore debt, HECS and to non-financials).
More frequently we cite housing debt-to-income which has increased to over 140 per cent (up 23 percentage points over five years) (Graph 2); net of offset accounts this is around 130 per cent (up 16 percentage points over five years).
High income and wealthy households hold a large proportion of household debt (Graph 3). In 2015-16 the top income quintile accounted for about 40 per cent of total debt and the top wealth quintile owed one-third of total debt; this share has been stable over time.
Debt servicing ratios have been broadly steady: falling rates offset rising debt.
Aggregate mortgage prepayments (offsets and redraws) are equivalent to 18 per cent of outstanding mortgages and nearly 3 years of scheduled repayments at current interest rates (Graph 4). One-third have no buffer: many are investors, on fixed-rate or new borrowers. Largest buffers typically: wealthier, higher income and more seasoned mortgages.
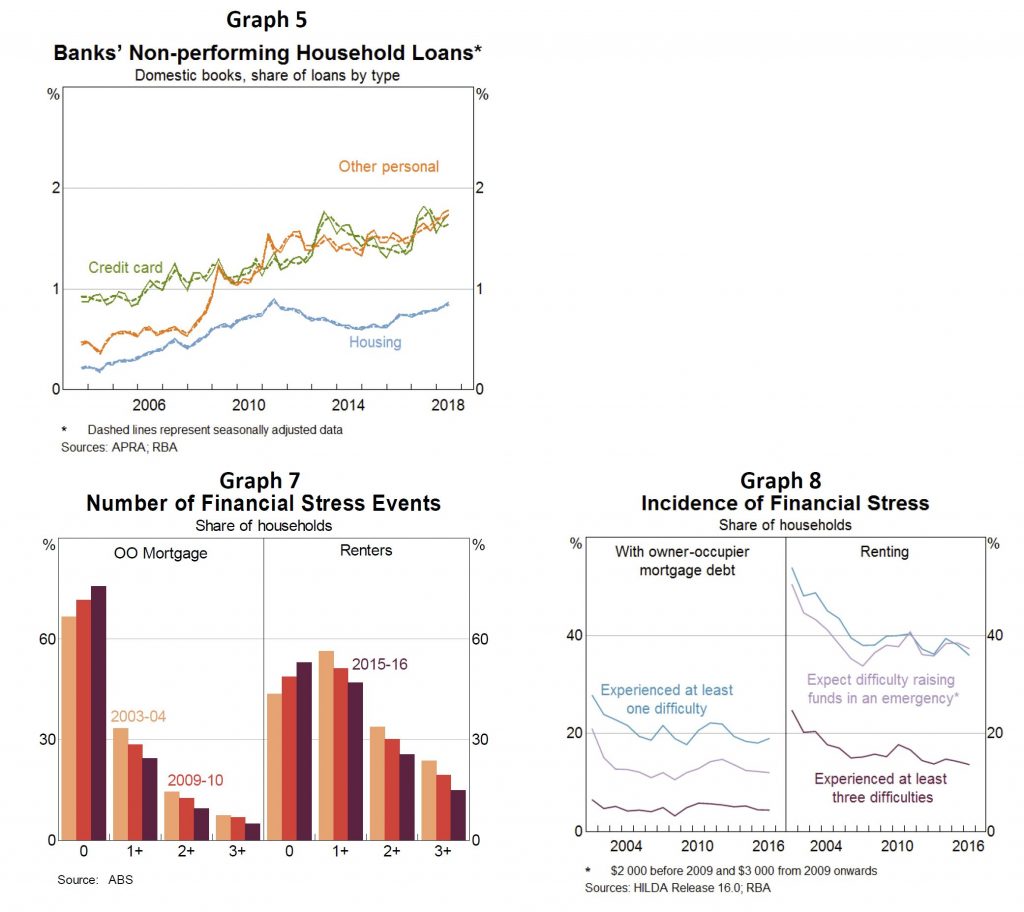
The housing non-performing loan (NPL) ratio has increased since the end of 2015 (mostly WA), but remains below the most recent peak in 2011 (Graphs 5 and 6).
NPL ratios for personal loans and credit cards remain high relative to recent history (personal credit is only about 4 per cent of banks’ household lending).
Broad data sources suggest the number of households experiencing financial stress has fallen over the past decade, but there are regional variations. Household Expenditure Survey (2015/16): the number of households experiencing financial stress has fallen steadily since the mid-2000s (Graph 7). HILDA (2016): measures of financial stress are little changed over the decade and are lower than the early 2000s (Graph 8).
ASIC’s recent report on credit cards links problematic debt with multiple credit card usage, corroborating messages from liaison (but overall more households are paying off each month).
Some private surveys point to rising mortgage stress. These surveys are timely but their methodologies often seem to overstate financial stress (e.g. using actual, rather than required mortgage payments, which include prepayments).
Concerns about stress when IO loan converts to a principal-and-interest (P&I) loan. Required repayments are estimated to increase by 30-40 per cent (about $7,000 per year) for a ‘representative interest-only borrower with a $400,000 mortgage converting to P&I.
Based on loans in the Securitisation Dataset, a large share of borrowers should qualify for an IO extension or could refinance with a different lender.
Borrowers that can’t meet new lending standards and are unable to service P&I repayments might sell their properties or default. We estimate this is a small group (eg borrowers with multiple highly leveraged investment properties).
Tighter lending standards are unlikely to bind for borrowers that: undertook a serviceability assessment at loan origination that already took into account the step up in repayments at the end of the interest-only periods (as APRA has required for all such assessments since end 2014); Did not borrow (close to) the maximum loan size available to them; Have experienced income growth since the loan was originated; Have made prepayments on their loans; and/or Were assessed for their original loans at significantly higher interest rates than current assessment rates.
Most borrowers will have positive equity given the rate of housing price growth over the last five years.