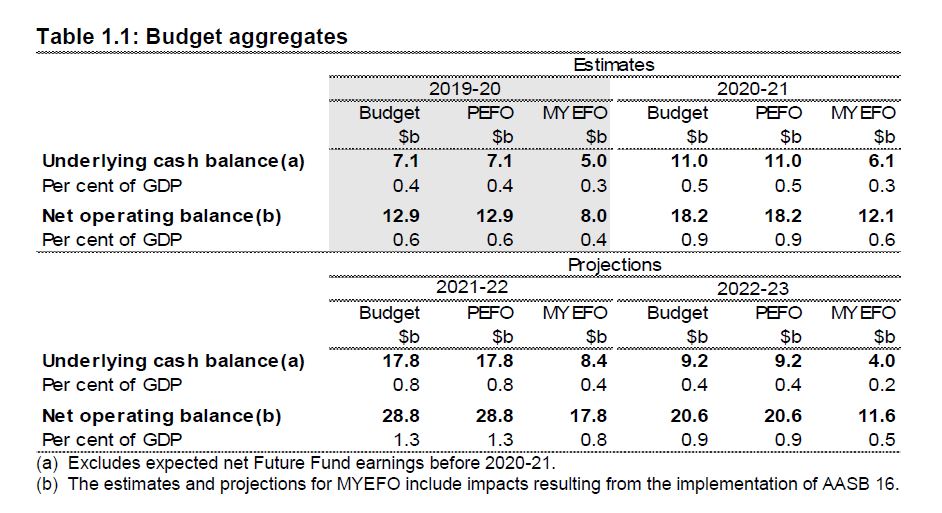
MYEFO has been released, and as expected the Government is still forecasting a surplus, this year down from $7.1 billion to $5 billion, but still a surplus for the first time in 12 years. The surplus for 2020/21 is now seen at $6.1 billion instead of $11 billion as previously estimated. Tax receipts are down 32.6b over 4 years.
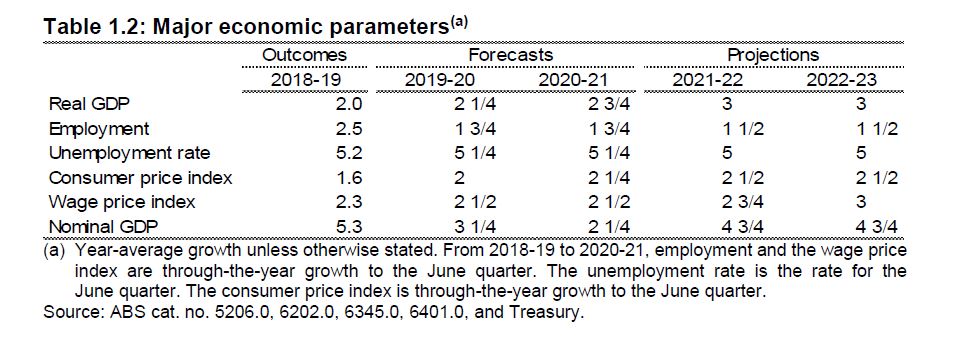
Wage growth forecasts were reduced, but are still too optimistic, while the unemployment rate was expected to be higher than hoped at 5.25 per cent, rather than five per cent for this financial year and next.
Treasury still is sticking with a 5% employment threshold below which inflation is expected to rise, while the RBA has this at 4.5%.
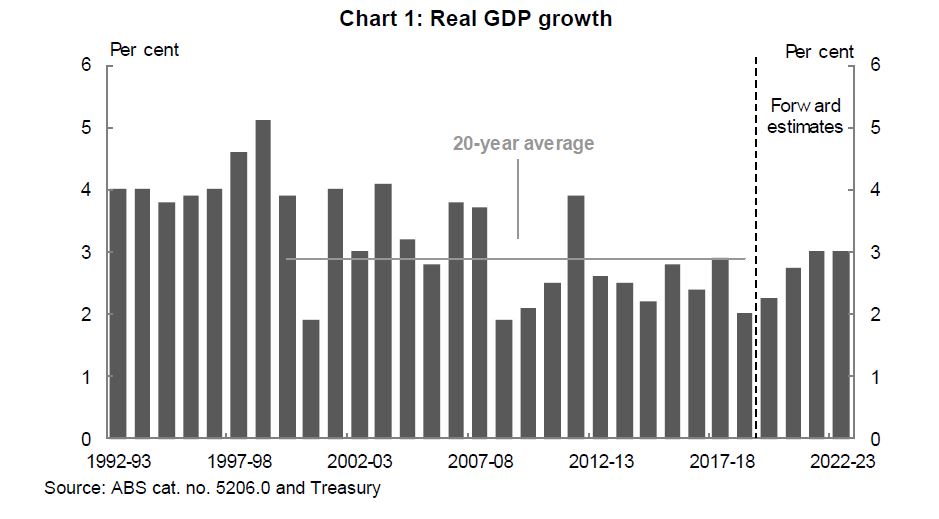
The forecast for economic growth has reduced from 2.75 per cent, to 2.25 per cent. The downgrade to growth was blamed on weak momentum in the global economy, as well as domestic challenges such as the effects of drought and bushfires. The drought in Australia that had already taken a quarter of a percentage point off GDP growth and reduced farm output by a significant amount over the last two years. Growth is then expected to strengthen to 2¾ per cent in 2020-21.
They have shrunk the expected surpluses over the next four years due to a downgrade of tax receipt expectations, with total receipts revised down by $3 billion in 2019/20 and by $32.6 billion over the four years to 2022/23. GST to the states is down nearly 2 billion in the next year, due to weaker activity.
Australia’s interest bill on its debt will fall from $19 billion last year to $14.5 billion (thanks to lower interest rates). Over the next four years this amounts to $13.5 billion savings.
While the mid-year update included a $623.9 million aged care package, there were no other new major spending measures to lift economic growth. This will keep the pressure on the Reserve Bank of Australia to reduce the cash rate even further next year.
In essence, the Treasury is leaving the action to the Reserve Bank, further confirmation we are likely to get more cuts next year.
But they are also counting on stronger house prices leading to a positive wealth effect.
After a recent period of significant falls in housing prices from mid-late 2017 to mid-2019, the established housing market has stabilised. In July 2019, combined capital city housing prices rose for the first time in almost two years, and this has continued in recent months. Although increases have been largest in Sydney and Melbourne, increases have now spread to all cities except Darwin. Overall, combined capital city housing prices are now almost 6 per cent higher than their recent trough in June, although they are still around 5 per cent lower than their peak in September 2017.
This increase in housing prices is expected to support the outlook for household consumption, particularly as corresponding increases in housing turnover should see a pick-up in spending on household goods such as furnishings. More broadly, continued rises in housing prices should provide a boost to confidence and household wealth, as well as increasing borrowing capacity given changes in collateral.
Ownership transfer costs — various fees incurred when fixed assets such as dwellings are sold (including legal and real estate agent fees, stamp duty, and other government charges) — were negatively affected by low rates of housing market turnover in 2018-19 and detracted from real GDP growth. Ownership transfer costs rose by 4.5 per cent in the September quarter 2019 and a further increase supported by stronger housing turnover and prices should contribute to economic growth over the forecast period.
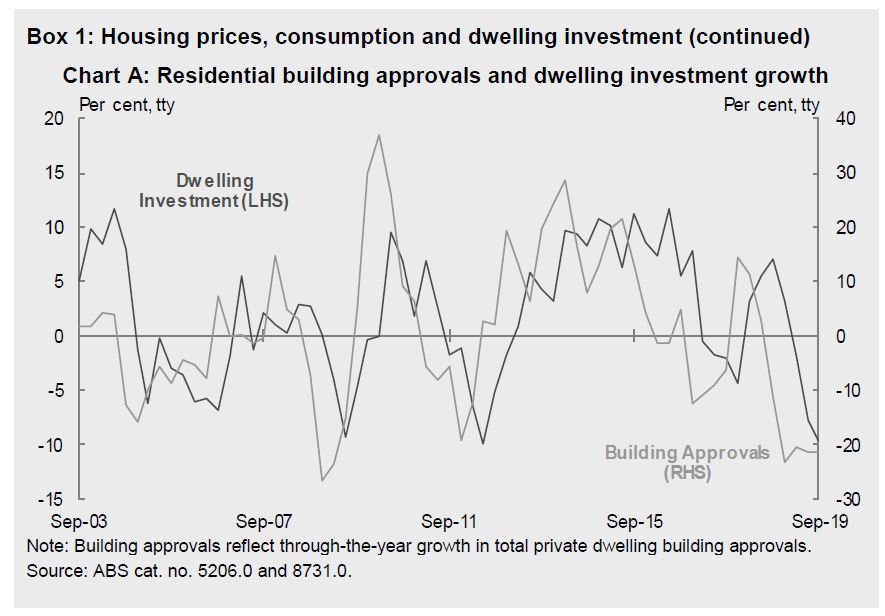
Movements in housing prices impact dwelling investment activity through changes to expected returns to residential construction. However, recent price gains will affect new dwelling investment with a delay. This is because planning and approval processes take time to work their way through into new construction. On average, depending on the type of dwelling, it can take around 2 to 5 months for new dwellings to commence following approval, and a further 6 to 20 months for activity to be completed. High-density dwellings have the longest approval and construction times, and houses the shortest on average.
New dwelling approvals have trended down since late 2017, with the total number of building approvals over the year to October 2019 down by more than 20 per cent from the preceding 12 months and below the 10-year average. The falls in building approvals have been particularly stark in medium-high density dwellings, which also have the longest lag between approval and completion. This means that further moderation in dwelling investment is likely over the forecast period (Chart A). This weakness should be partly offset by a solid pipeline of housing construction work yet to be done.
The other area of sensitivity is the iron ore price and commodity prices in general.
Iron ore spot prices increased sharply in the first half of 2019, mainly due to supply issues in Australia and Brazil, and stronger-than-expected demand from China. Iron ore prices peaked in early July at almost US$120 per tonne free-on-board (FOB). Prices have since fallen, but remain above the price assumed at PEFO. The decline in the price has mainly been due to uncertainty about demand from Chinese steel mills and the recovery in supply. As such, prudent assumptions have been retained and the iron ore spot price is assumed to decline to reach US$55 per tonne FOB by the end of the June quarter 2020. This is one quarter later than was assumed at PEFO.
Coal prices have fallen since PEFO. Metallurgical coal prices have fallen faster and further than had been assumed at PEFO, with the spot price below US$150 per tonne FOB since October 2019. The fall in the spot price is due in large part to uncertainty about demand from Chinese steel mills and policy changes in China. The metallurgical coal price is assumed to remain around recent levels of US$134 per tonne FOB over the forecast period. This is lower than the PEFO assumption, which was for the price to fall to US$150 per tonne FOB by the end of the March quarter 2020.
After reaching a peak of just over US$125 per tonne FOB in mid-2018, thermal coal prices have trended lower, mainly due to increases in seaborne supply and softer global demand. The thermal coal price is assumed to remain around recent levels of US$64 per tonne FOB over the forecast period, below the PEFO assumption of US$91 per tonne FOB.
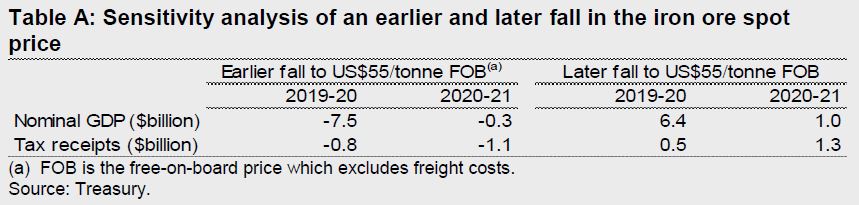
If the iron ore price were to fall immediately to US$55 per tonne FOB, two quarters earlier than assumed, nominal GDP could be around $7.5 billion lower than forecast in 2019-20 and $0.3 billion lower in 2020-21. This would have a negative flow-on impact to company tax receipts estimated at around $0.8 billion in 2019-20 and $1.1 billion in 2020-21.
By contrast, if the iron ore price remained elevated for two quarters longer than currently assumed, before falling immediately to US$55 per tonne FOB, nominal GDP could be around $6.4 billion higher than forecast in 2019-20 and $1.0 billion higher in 2020-21. This would have a flow-on impact to company tax receipts estimated at
around $0.5 billion in 2019-20 and $1.3 billion in 2020-21.The actual impact on company tax receipts may vary due to timing of tax collections and the availability of tax losses.