
We have had a number of people asking for some analysis of the rental sector, (including on our recent Live Event, which by the way is still available to watch) as well as in the comments on the channel. So today we take a look, using data from our household surveys, and other sources. This is part one of our latest series.
And by the way, if you value the content we produce please do consider joining our Patreon programme, where you can support our ability to continue to make great content.
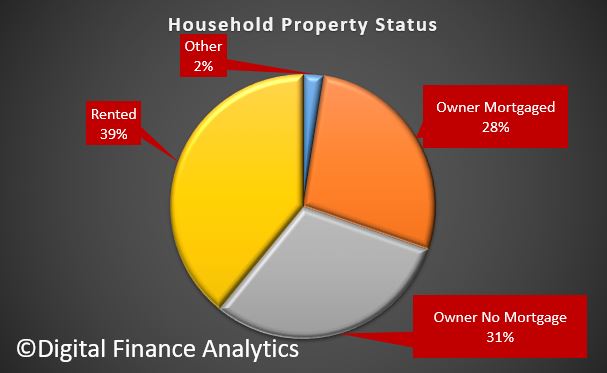
To start with, across our surveys, there are 31% of households owning property mortgage free, 28% who have owner occupied property with a mortgage, and 39% of households renting. In fact, in recent years the proportion of households renting has been rising, and faster than the mortgaged sector, which itself is growing.
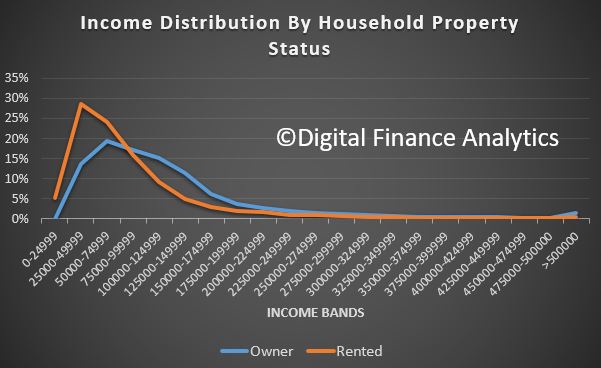
 Looking at average household incomes across those who are owners and those who are renting, it is striking that relatively more households with an income below $100,000 are renting, whereas higher up the income ranges, more are owners. So income is one element which drives property choices, perhaps no surprise there.
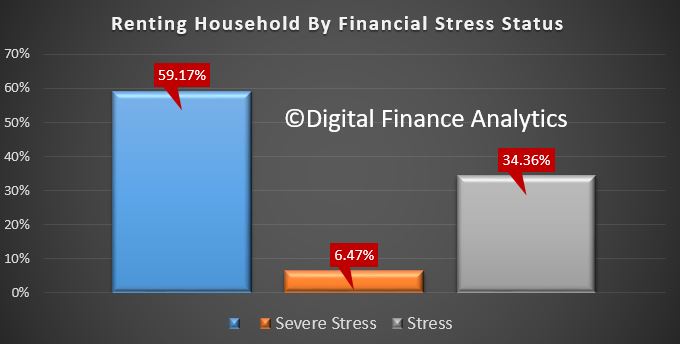
 Turning specifically to the rental sector, we can look at household income and expenditure, just as we do with mortgage stress. Where expenses, including rental payments are lower than incomes, we classify these households as in severe rental stress. Where income and expenditure is borderline, they are in stress. And here’s the thing. 34% of renters are in stress and an additional 6% are in severe stress, meaning that close to 40% of those renting are living in financial stress, combined. This is compared with 30% of those in mortgage stress. So financial stress is more widespread among renters.
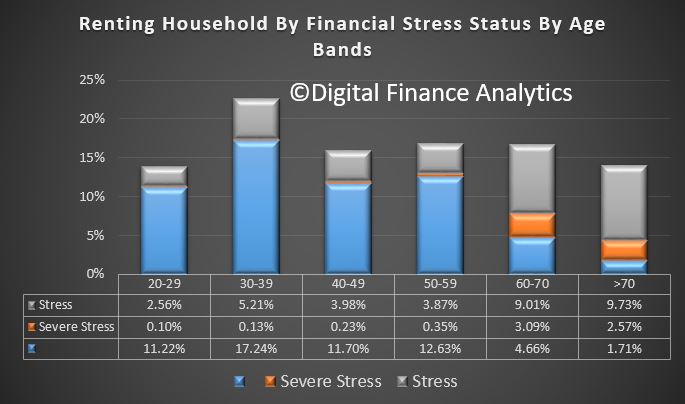
 We can take the analysis further by looking at the relative stress distribution by age bands. While stress appears across all the age groups, we find that the bulk of households in severe stress are aged 60 or more. We also see a significant concentration of financial stress more generally here, as well as in those aged 30-39, where we see many young growing families are also under the gun.
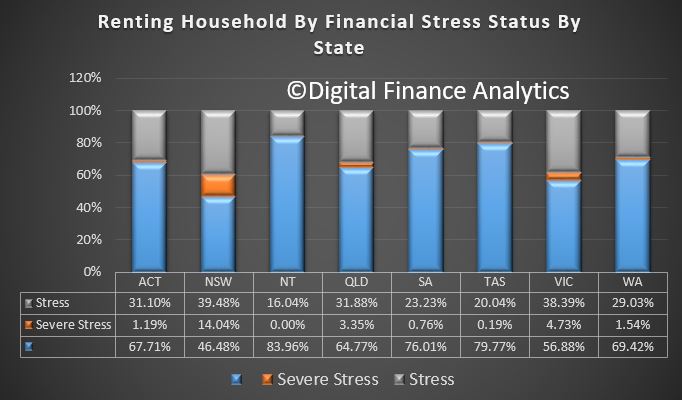
 Looking across the states, we find that the state with the most stress is NSW, where just 46% of renters have no financial stress, compared with nearly 80% in Tasmania. In addition, we find that 14% of renters in NSW are in severe stress, compared with 5% in VIC and 3% in QLD. This can be directly traced to the average property value, and rental payments, which are highest in NSW.
 Now let’s flip the view to those providing rentals, by looking at investment property owners. We are able to calculate the gross rental yield and net rental yield, the latter after accounting for the costs of managing the property, repairs, etc. as well as repayments on the mortgage. On average, net rental yields are highest in ACT, TAS and NT, whereas those in VIC are most likely to be under water – in fact many owners, according to our surveys have not even tried to calculate these returns, preferring to look at the capital appreciation, and after tax position. We calculate our returns before any tax breaks, on a cash flow basis.
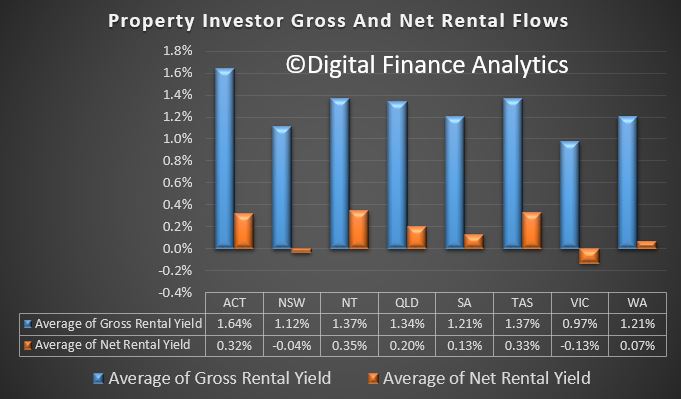 This means that many investors are NOT covering the full costs of owning a rental property, and of course if capital values fall in real terms, then this becomes a significant drain on household finances, and that’s before the upcoming changes in interest only loans, as they are switched to higher cost principal and interest loans.
So standing back, we can see the on one side renters are under pressure, and on the other so are many property investors, who despite owning the property are also feeling the pinch. This does not bode well for the future health of the market. In summary we are looking at a major policy failure.
Next time we will go further in to the sector.
Housing policy is close to the most egregious policy failure of government of all levels of government over decades and decades.
Saul Eslake has been calling this endlessly but could never get any traction.
This is but just one of his many many attempts to get some attention to the problem.
https://www.prosper.org.au/2013/09/03/saul-eslake-50-years-of-housing-failure/
So I guess nothing will be done until we have a full blown crisis