We look at the latest ABS data in household income and wealth. And compare Australia with selected countries via World Bank data.

NOTE: Gini refers to the method in the analysis – it was a pun … sorry if it went over your head!
Digital Finance Analytics (DFA) Blog
"Intelligent Insight"

We look at the latest ABS data in household income and wealth. And compare Australia with selected countries via World Bank data.
NOTE: Gini refers to the method in the analysis – it was a pun … sorry if it went over your head!
We look at the latest from the ABS.
 Blog")
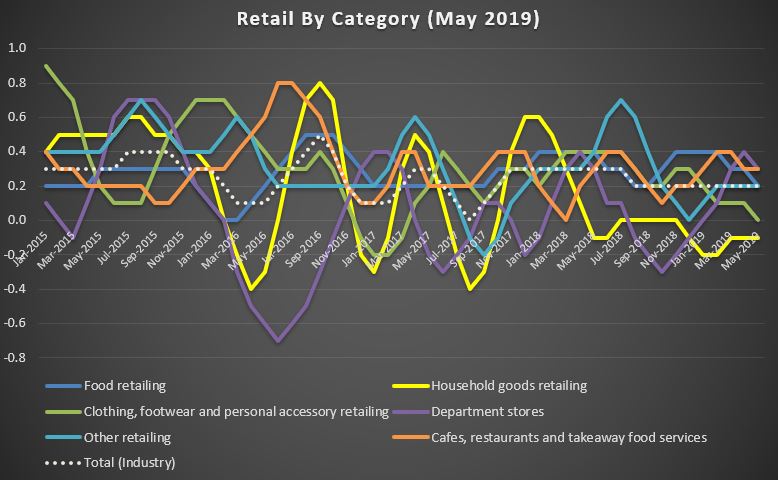
The ABS released their retail turnover figures today.
The trend estimate rose 0.2% in May 2019. This follows a rise of 0.2% in April 2019, and a rise of 0.2% in March 2019.
The seasonally adjusted estimate rose 0.1% in May 2019. This follows a fall of 0.1% in April 2019, and a rise of 0.3% in March 2019.
In trend terms, Australian turnover rose 2.7% in May 2019 compared with May 2018.
The following industries rose in trend terms in May 2019: Food retailing (0.2%), Cafes, restaurants and takeaway food services (0.3%), Other retailing (0.2%), and Department stores (0.3%). Clothing, footwear and personal accessory retailing (0.0%) was relatively unchanged. Household goods retailing (-0.1%) fell in trend terms in May 2019.
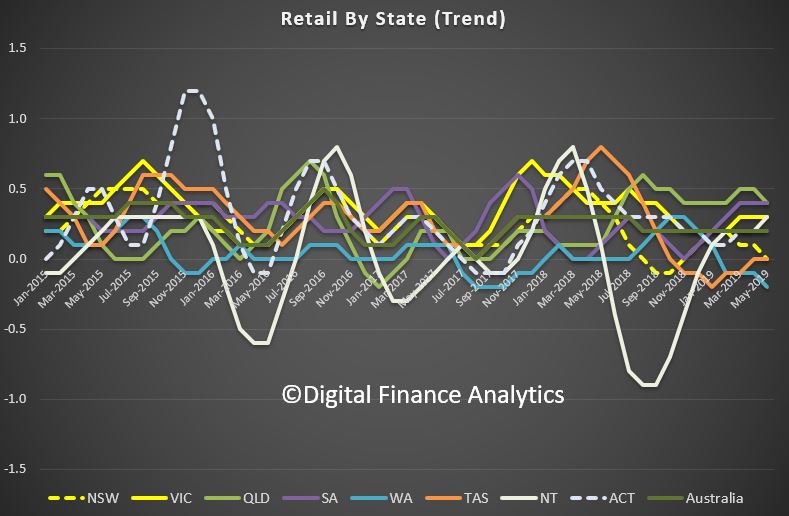
The following states and territories rose in trend terms in May 2019: Queensland (0.4%), Victoria (0.3%), South Australia (0.4%), the Northern Territory (0.3%), and the Australian Capital Territory (0.2%). New South Wales (0.0%) and Tasmania (0.0%) were relatively unchanged. Western Australia (-0.2%) fell in trend terms in May 2019.
We look at the May 2019 stats from the ABS, and examine how they have been interpreted.
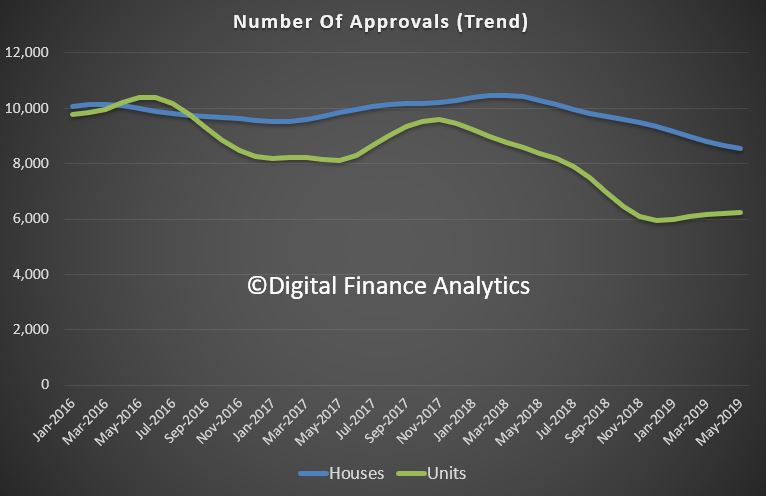
The ABS released their May 2019 Building Approvals data today. The trend estimate for total dwellings approved fell 0.5% in May, while the less reliable seasonally adjusted estimate for total dwellings approved rose 0.7% in May.
As you know DFA uses the trend series in our analysis and modelling.
However, most reports will pick the seasonally adjusted series and claim a “rebound” in approvals.
In fact, on both trend and seasonally adjusted measures, private sector house approvals fell, by 1.3% in trend terms and 0.3% in seasonally adjusted terms.
On the other hand, private sector dwellings excluding houses rose 0.6% in trend terms. while the seasonally adjusted estimate rose 1.2%.
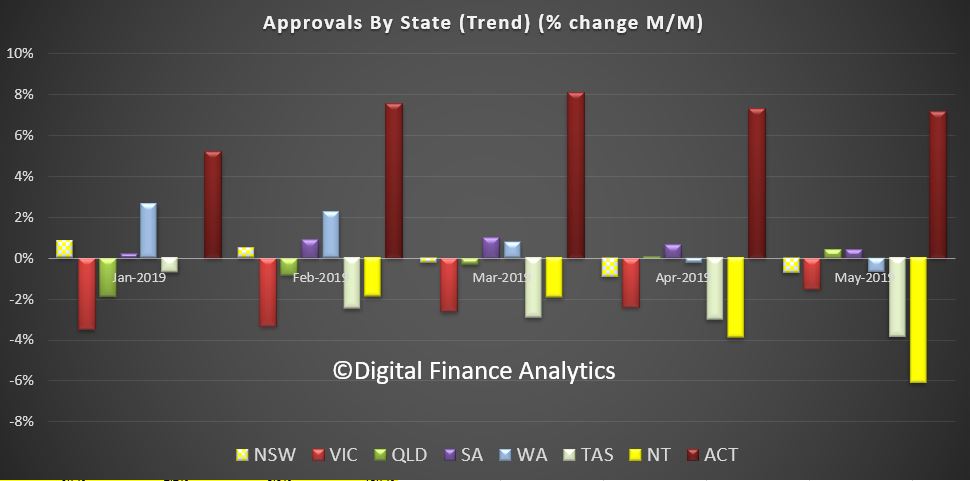
Across the states, total approvals rose a little in Queensland and South Australia, together with a big hike in Canberra (on small volumes), while there was a percentage fall in New South Wales and Victoria, as well as Western Australia and the Northern Territories.
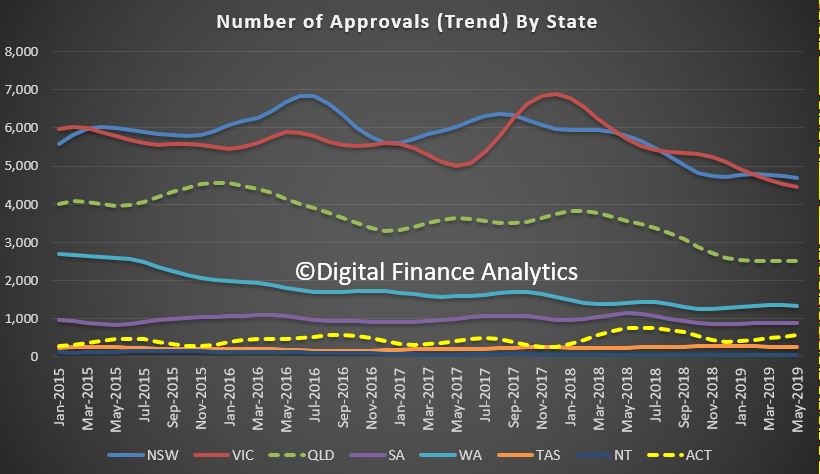
The volume trends really highlight the declines in New South Wales and Victoria, which are not offsetting the small rises elsewhere, especially in the ACT.
In New South Wales the trend estimate for total number of dwelling units approved fell 0.7% in May, while the number of private sector houses fell 2.9%.
In Victoria the trend estimate for total number of dwelling units approved fell 1.5% in May, while the number of private sector houses fell 1.3%.
In Queensland, the trend estimate for total number of dwelling units approved rose 0.4% in May, while the number of private sector houses fell 0.1% in May.
And in South Australia, the trend estimate for total number of dwelling units approved rose 0.4% in May, while the number of private sector houses was flat in May.
Finally, In Western Australia, the trend estimate for total number of dwelling units approved fell 0.7% in May and the number of private sector houses fell 0.7% in May.
The trend estimate of the value of total building approved fell 0.2% in May and has fallen for three months. The value of residential building fell 0.6% and has fallen for 16 months. The value of non-residential building rose 0.3% and has risen for nine months.
The seasonally adjusted estimate of the value of total building approved fell 0.2% in May. The value of residential building rose 4.7%, while the value of non-residential building fell 6.7%.
The HIA said “The decline in dwelling approvals appears to be losing momentum. This is a welcome reprieve for the housing industry after the persistent declines measured throughout 2018”.
“Recent positive news relating to house prices and new home sales has started filtering through. Even if this isn’t the bottom of the cycle the pick-up in new home sales in May suggests the pace of decline is slowing”.
Westpac said ” Overall the May update was a touch firmer than expected but the detail was not great with clear questions around the sustainability of the gain in high rise approvals and weakness elsewhere”.
That is closer to the mark. Little here, yet to argue for a shift in gears.
As Westpac put it ” All of this still predates several positive developments for housing, in particular: the Federal election result, which has removed the threat of tax policy changes around negative gearing and capital gains tax; and the RBA’s interest rate cuts in June and July. More timely market measures suggest wider housing market conditions have improved, especially in Sydney and Melbourne. We suspect that shift will be slow to flow through to new dwelling construction with an overhang of stock in some segments and financing issues likely to continue restraining activity near term.
Certainly the major markets of Sydney, Melbourne and Brisbane all have a way to go before we can claim a rebound, and of course there is a significant oversupply of new high-rise under construction in these centres, despite the worries about construction standards, and the disappearing indemnity insurance in the sector.
To be a registered surveyor with the Victorian Building Authority (VBA) a person must have professional indemnity insurance, without any exemptions.
The same rule applies in NSW and Queensland.
But insurance companies are no longer providing this option and the industry is warning work on buildings may simply stop.
Other surveyors have reported that the cost of their insurance premiums and excesses have more than quadrupled.
Building surveyors are responsible for signing off on buildings, including building permits and occupancy permits.
While local government building surveyors can also sign off on permits, private building surveyors have been the preferred option for most of the building industry.
The chief executive of the Australian Institute of Building Surveyors, Brett Mace, warned the building industry could start to slow down over the next year.
“We think it’s a huge crisis,” Mr Mace said.
“If building surveyors are unable to be registered then you’re not going to be able to provide approvals and the construction industry will come to a stop.”
The Master Builders Association (MBA) said up to 30 per cent of building surveyors are required to renew their insurance by the end of June.
“If they are unable to obtain insurance or the insurance offered to them is non-compliant due to exclusions being imposed, many building projects could come to a standstill,” the MBA said in a statement.
One more reason to be cautious about a lift in approvals ahead.
We look at the latest ABS stats on household wealth. How do falls in real estate values compare with recent lifts in share prices?
We look at the latest ABS stats on household wealth. How do falls in real estate values compare with recent lifts in share prices?
The ABS released their latest Household Finance and Wealth Statistics to March 2019.
Household wealth per capita decreased for a third consecutive quarter to $404,556.4, falling $1,511.9. This follows a record $9,992.7 fall in household wealth per capita in the previous quarter, and reflects the continued holding losses on residential land and dwellings.

The falls in property values were offset by rises in stock markets (for those with shares/superannuation). Residential land and dwellings experienced real holding losses for a fifth consecutive quarter.
Household debt to assets ratio increased from 19.3% to 19.4%, as growth in household debt (0.7%) outweighed the increase in total assets (0.3%).
The mortgage debt to residential land and dwellings ratio increased from 28.1% to 29.0% and is the largest quarterly increase since September quarter 2011.
A fall in gross disposable income was driven by falls in compensation of employees and gross mixed income.
Household wealth (net worth) increased 0.2% in the March quarter 2019, a positive turn around from the decline of 2.1% recorded in the previous quarter. A rebound in the Australian stock market drove increases in real holding gains on financial assets ($147.8b), recovering the real holding losses ($146.2b) in the previous quarter. Positive revaluations on reserves of pension funds (superannuation) accounted for 68.0% of holding gains on household financial assets, reflecting the 70% of investment of total pension fund assets in shares which in turn was helped by the rebound in the Australian stock market. Residential land and dwellings experienced real holding losses for a fifth consecutive quarter and offset the gains on financial assets during the quarter. Through the year, household wealth decreased 0.7%, reflecting continued falls in residential property prices.
The percentage point contributions to the change in household wealth were:
Graph 1. Net worth and residential land and dwellings year-on-year growth
Household wealth per capita decreased for a third consecutive quarter to $404,556.4, falling $1,511.9. This follows a record $9,992.7 fall in household wealth per capita in the previous quarter, and reflects the continued holding losses on residential land and dwellings.
Real holding gains on financial assets drove a 0.3% increase in total household assets, following a 1.5% fall in the previous quarter. Household liabilities grew 0.7%, with through the year growth at 3.7%, which is its lowest rate since March quarter 2013. This weakness is driven by soft growth in long term loans, which account for 92.0% of household liabilities.
Household transactions in net worth were $28.9b. The largest component at $23.0b, was the net acquisition of financial assets ($36.0b), with superannuation reserves the main contributor, followed by shares and other equity. Net capital formation at $6.0b was driven by net acquisitions of land and dwellings ($7.9b). These were offset by net incurrence of liabilities ($13.0b), driven by transactions in long term loans.
Household debt to assets ratio increases
The household debt to assets ratio gives an indication of the extent to which the overall household balance sheet is geared. Household debt to assets ratio increased from 19.3% to 19.4%, as growth in household debt (0.7%) outweighed the increase in total assets (0.3%).
The mortgage debt to residential land and dwellings ratio increased from 28.1% to 29.0% and is the largest quarterly increase since September quarter 2011. The rise in ratio reflects the fall in the value of residential land and dwellings (2.6%) together with an increase in mortgage debt (0.6%). Despite the large increase in the ratio, it is predominantly driven by the continued fall in the value of residential land and dwellings, as growth in mortgage debt has reduced to its slowest pace since September quarter 2013.
The household debt to liquid assets ratio reflects the ability of households to quickly extinguish debts using liquid assets (currency and deposits, short and long term debt securities, and equity). The household debt to liquid asset ratio decreased from 113.9% to 112.5%. The decrease in the debt to liquid assets ratio indicates growth in household liquid assets (2.0%) outweighed growth in household debt (0.7%). Growth in liquid assets was driven by increases in equity and deposits of 3.2% and 1.0% respectively, while the slow growth in debt reflects weak growth in household loan borrowing.
Graph 2. Risk ratios
The wealth effect
Household net saving increased $6.8b to $9.5b, driven by a decrease in
final consumption expenditure ($17.7b), partly offset by a decrease in
gross disposable income ($10.6b) and an increase in consumption of fixed
capital ($0.3b). The fall in gross disposable income was driven by
falls in compensation of employees and gross mixed income.
Household gross disposable income adjusted for other changes in real net
wealth (wealth effect) increased $263.5 from $18.9b to $282.5b,
reflected by real holding gains on financial assets. Household net
saving adjustment for other changes in real net wealth increased to
-$10.4b, from -$291.3b in the previous quarter. The $280.9b increase in
household net saving plus other changes in net wealth reflects the real
holding gains on financial assets, however the household sector remains
in a dis-saving position for third consecutive quarter due to the
continued real holding losses on residential land and dwellings.
Graph 3. Net saving plus other changes in real net wealth, original
Australia continued to borrow from overseas to fund investment, borrowing $1.0 billion from non-residents during the March quarter as national investment exceeded national saving. In seasonally adjusted terms, Australia has been a net borrower from overseas since the September quarter 1975.
National investment decreased $22.2b in March quarter 2019 to $100.9b.
The fall comes off the back of a record high in the December quarter
2018 and, despite the decrease, remains at high levels.
Graph 1. Total capital formation, current prices
Private non-financial corporations invested $39.5b over the quarter,
down $8.5b from December. Investment in machinery and equipment was down
this quarter, while the decline in mining investment continued as
significant LNG projects move into the production phase.
Households invested $36.4b, down $9.6b from the previous quarter. The
decrease was driven by falls in dwelling investment and ownership
transfer costs, reflecting the weak conditions in the residential
housing market.
Australia’s borrowing narrows to $1 billion
National net borrowing of $1.0b in March quarter 2019 was the lowest
since December quarter 1983. The $1.0b worth of lending by the rest of
the world was derived by repayments of their liabilities ($18.2b) being
larger than the disposal of their financial assets ($17.2b).
During the quarter, rest of the world acquired $15.1b of private
non-financial corporations’ shares and other equity but these were
offset by maturities of their holdings of bank one name paper ($21.3b)
and settlements of their bank derivative contracts ($17.1b). On the
liabilities side, rest of the world borrowed $11.1b of short term loans
from banks and other private non-financial corporations, and paid off
their long term bank loans ($24.0b) and settled their derivative
contracts with banks ($16.8b).
Graph 2. Net financial investment (net lending (+) / net borrowing (-))
Net borrowing by non-financial corporations was $13.8b driven by loan borrowing of $17.5b and net issuances of equity of $13.2b.
The general government was a net lender of $956m this quarter driven by maturities of long-term debt securities of $5.1b.
Households were net lenders of $23.0b, accruing $18.8b in net equity in
reserves of pension funds (superannuation) and $10.0b of deposits. These
were offset by their loan borrowing of $9.9b.
Credit market rebounds on valuation increases in equities and bonds
Credit market outstanding of the non-financial domestic sectors rose
2.8% in March quarter 2019, following last quarter’s fall of 0.7%.
Valuation increases in the equity of other private non-financial
corporations drove the result, aided by valuation increases in
government bonds as yields fell.
Graph 1. Credit market outstandings
Demand for credit was subdued as the government repays debt
National general government demand for credit fell $4.0b this quarter.
Debt repayment outweighed new issuance of bonds for the first time since
June quarter 2013, as the government’s net saving position continues to
improve.
Credit was raised mainly in the loan market by other private
non-financial corporations ($13.7b) and households ($9.9b). However,
through the year growth in household borrowing continues to slow due to
tighter lending conditions and falling investor demand in the
residential property market.
Equity raised by other private non-financial corporations was $12.0b
after a subdued December quarter 2018 which reflected the share buy
backs of major mining companies.
Graph 2. Total demand for credit
Residential property prices fell 3.0 per cent in the March quarter 2019, according to figures released today by the Australian Bureau of Statistics (ABS).
Through the year growth in property prices fell 10.3 per cent in Sydney and 9.4 per cent in Melbourne. Adelaide (0.8 per cent) and Hobart (4.6 per cent) are the only capital cities recording positive through the year growth.
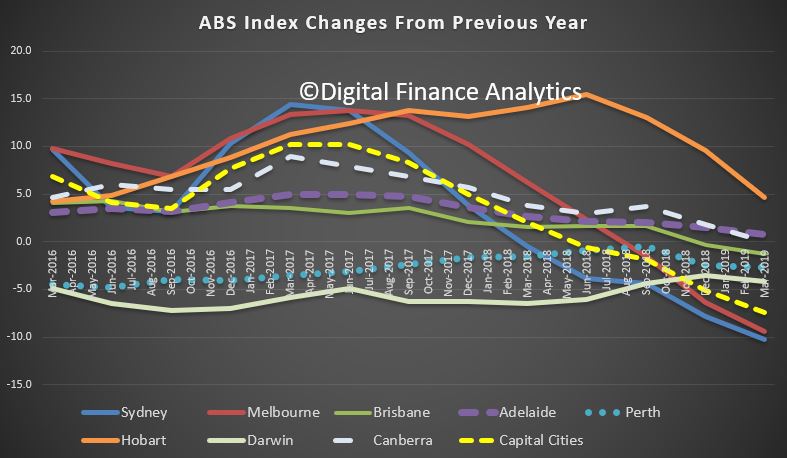
All capital cities recorded falls in property prices in the March quarter 2019, with the larger property markets of Sydney (-3.9 per cent) and Melbourne (-3.8 per cent) continuing to observe the largest falls.
In the March quarter 2019, property prices in Adelaide (-0.2 per cent) and Hobart (-0.4 per cent) recorded their first falls since March quarter 2013 and September quarter 2012 respectively. Falls were also recorded in Brisbane (-1.5 per cent), Perth (-1.1 per cent), Canberra (-0.9 per cent) and Darwin (-1.8 per cent).
ABS Chief Economist, Bruce Hockman said: “These results are in line with soft housing market indicators, with sales transactions and auction clearance rates lower than one year ago, and days on market trending higher.”
“A continuation of tight credit supply and reduced demand from investors and owner occupiers has contributed to weakness in property prices in all capital cities this quarter,” he said.
The total value of Australia’s 10.3 million residential dwellings fell by $172.7 billion to $6.6 trillion in the March quarter 2019. The mean price of dwellings in Australia is now $636,900. The total value of residential dwellings has fallen for four consecutive quarters, down from $6,957.2 billion in the March quarter 2018. The mean price of residential dwellings has now fallen for five consecutive quarters, down from $689,700 in the December quarter 2017.