The ABS released their new data series today on loan flows. This includes some enhancements on the old data, though mostly back to July 2019 only, as well as some of the previously reported series. It will take some time to examine these in detail, but here is my first take.
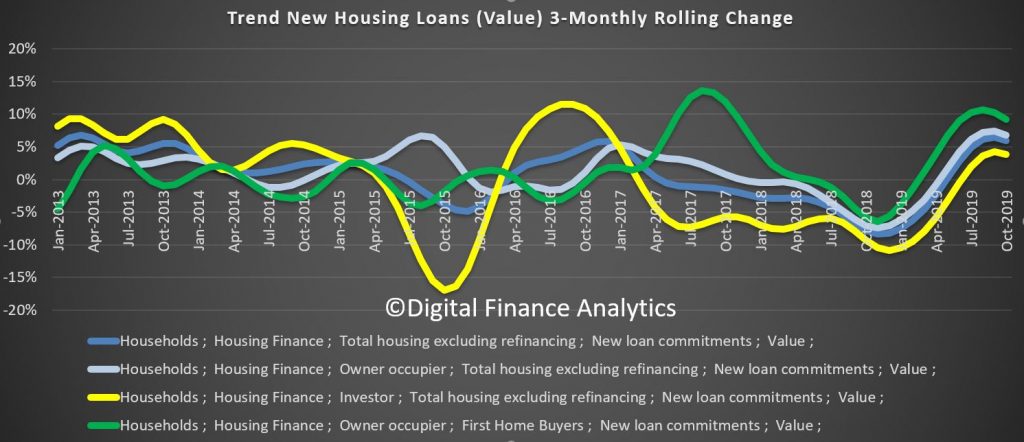
New loan flows rose through the past few months, though the rate of growth slowed in October.
More focus on owner occupied loans than investor loans as expected. First time buyers also remain active, mainly for owner occupation purchase.
New loan commitments for housing rose by 2.0 per cent, seasonally adjusted, in October according to new data released today by the Australian Bureau of Statistics (ABS) in its Lending Indicators publication (previously called Lending to Households and Businesses).
ABS Chief Economist, Bruce Hockman, said: “New loan commitments for housing showed further strength in October, with the series up 15.2 per cent on the most recent trough in May 2019. Recent growth continues to be driven by new commitments for owner occupier housing, which rose 2.2 per cent in October, the fifth consecutive monthly increase.”
The data released today for the first time is based on new and improved data from the Economic and Financial Statistics collection.
“The new collection provides a more contemporary view of a changing economy. It also provides more information on investment lending, including new information on first home owners who are investors,” Mr Hockman said.
Previously published levels have changed with the data in the new publication presented on a consistent basis. An information paper released by the Australian Bureau of Statistics last week explains the impacts of the changes.
The number of loan commitments to owner occupier first home buyers rose 1.4 per cent in October, accounting for 29.9 per cent of new housing loan commitments to owner occupiers.
Personal finance fixed term loan commitments rose 3.1 per cent in October following a 0.8 per cent fall in September and were down 0.4 per cent on October 2018.
In trend terms, the value of new loan commitments to businesses for construction rose 1.2 per cent in October, while new loan commitments to businesses for the purchase of property fell 2.2 per cent.