Residential Building Approvals Fall Again

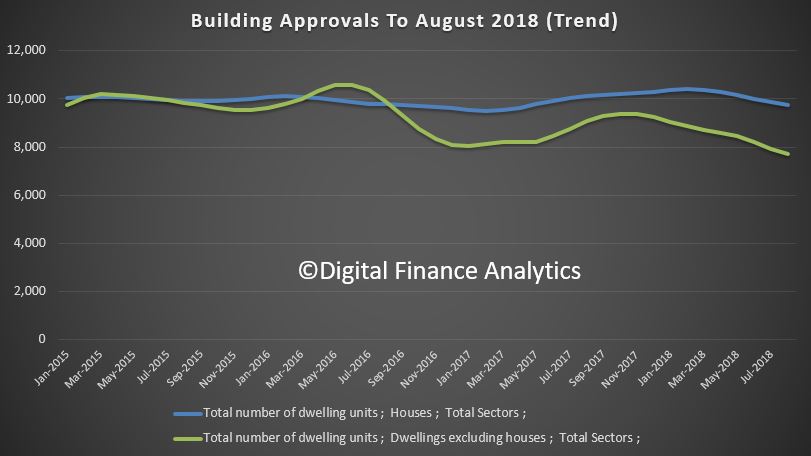
The ABS data released today shows that the number of dwellings approved in Australia fell by 1.9 per cent in August 2018 in trend terms.

In seasonally adjusted terms, total dwellings fell by 9.4 per cent in August, driven by a 17.2 per cent decrease in private dwellings excluding houses. Private houses fell 1.9 per cent in seasonally adjusted terms.

We will continue to base our analysis on the trend data, but this will understate more recent falls…

The cause is simple, a significant fall in the number of new high-rise residential development applications, especially in Victoria. Recent falls in demand and prices suggests a significant reduction in momentum is on the cards there.

Justin Lokhorst, Director of Construction Statistics at the ABS said “The fall was mainly driven by private dwellings excluding houses, which decreased by 2.7 per cent in August, Private sector houses also fell, by 1.2 per cent.”

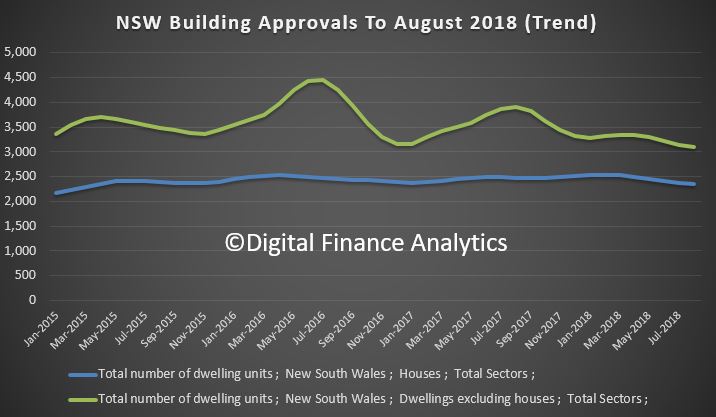
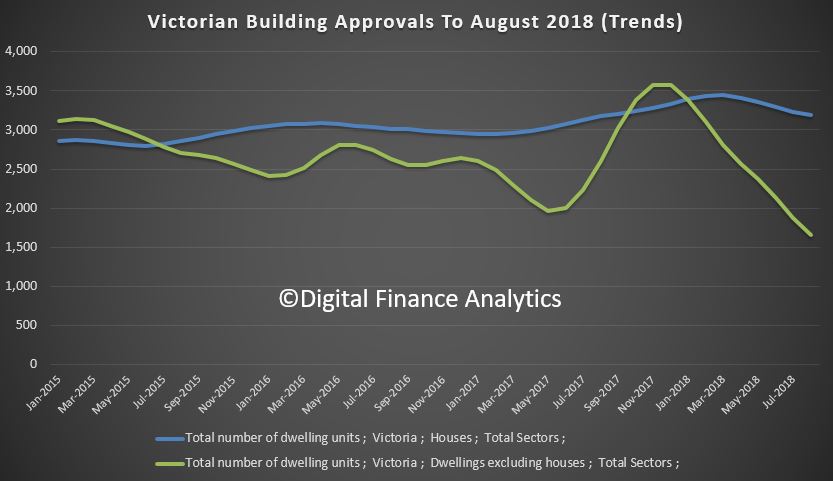
Among the states and territories, dwelling approvals fell in August in Victoria (5.1 per cent), South Australia (3.6 per cent) and New South Wales (1.6 per cent) in trend terms.

Dwelling approvals rose in trend terms in Western Australia (2.7 per cent), Tasmania (2.3 per cent), Northern Territory (1.5 per cent) and Australian Capital Territory (0.1 per cent). Dwelling approvals were flat in Queensland.  But the significant falls in the two most populated states swamps any better news elsewhere.

In trend terms, approvals for private sector houses fell 1.2 per cent in August. Private sector house approvals fell in Queensland (3.3 per cent), Victoria (1.4 per cent), New South Wales (1.1 per cent) and South Australia (0.7 per cent), but rose in Western Australia (1.4 per cent).

The value of total building approved fell 1.3 per cent in August, in trend terms, and has fallen for nine months. The value of residential building fell 0.8 per cent while non-residential building fell 2.3 per cent.

Now, its worth comparing this approvals data with the latest RLB Crane Index, an interesting measure of construction activity (especially high-rise development).

Their Q3 2018 data – the 13th edition of the RLB Crane Index has seen
Australia reach a new record high of 173. Nationally, the number of cranes rose 7%, to 735, the highest count. Melbourne and Newcastle saw a strong crane increases, overtaking the record levels reached six months earlier. Sydney continues to decline from the peak reached in Q4 2017, falling 6%.

They say that the residential index pick up from its fall in Q2 2018, increasing 8%, to 170. Additionally, the non-residential index continued its rise, increasing 7%, recording a new high of 180. Recent construction statistics released by the Australian Bureau of Statistics highlight the ongoing strength of the construction industry. For FY 2018,total construction in Australia reached $221 billion.

Strong increases were seen in the non-residential and engineering construction sectors of 11.1% and 20.7% respectively, while the residential building sector remained constant at $74 billion.

They say that Melbourne’s crane numbers rose, increasing by 35 cranes. Driving this rise is the civil sector with the introduction of 13 new cranes. All
other sectors remained strong, either maintaining or increasing cranes from the count six months ago.

Since its peak in Q3 2017, Sydney’s crane count has been falling, driven by a declining residential sector. The residential crane count has fallen by 55 cranes from its peak in Q4 2017, while the non-residential sector recorded an increase of 26 cranes.

Brisbane has bounced back from its dip in the last edition, driven by a rise in mixed-use projects. While the residential sector remained stable, 11 new cranes were added to the mixed use sector.

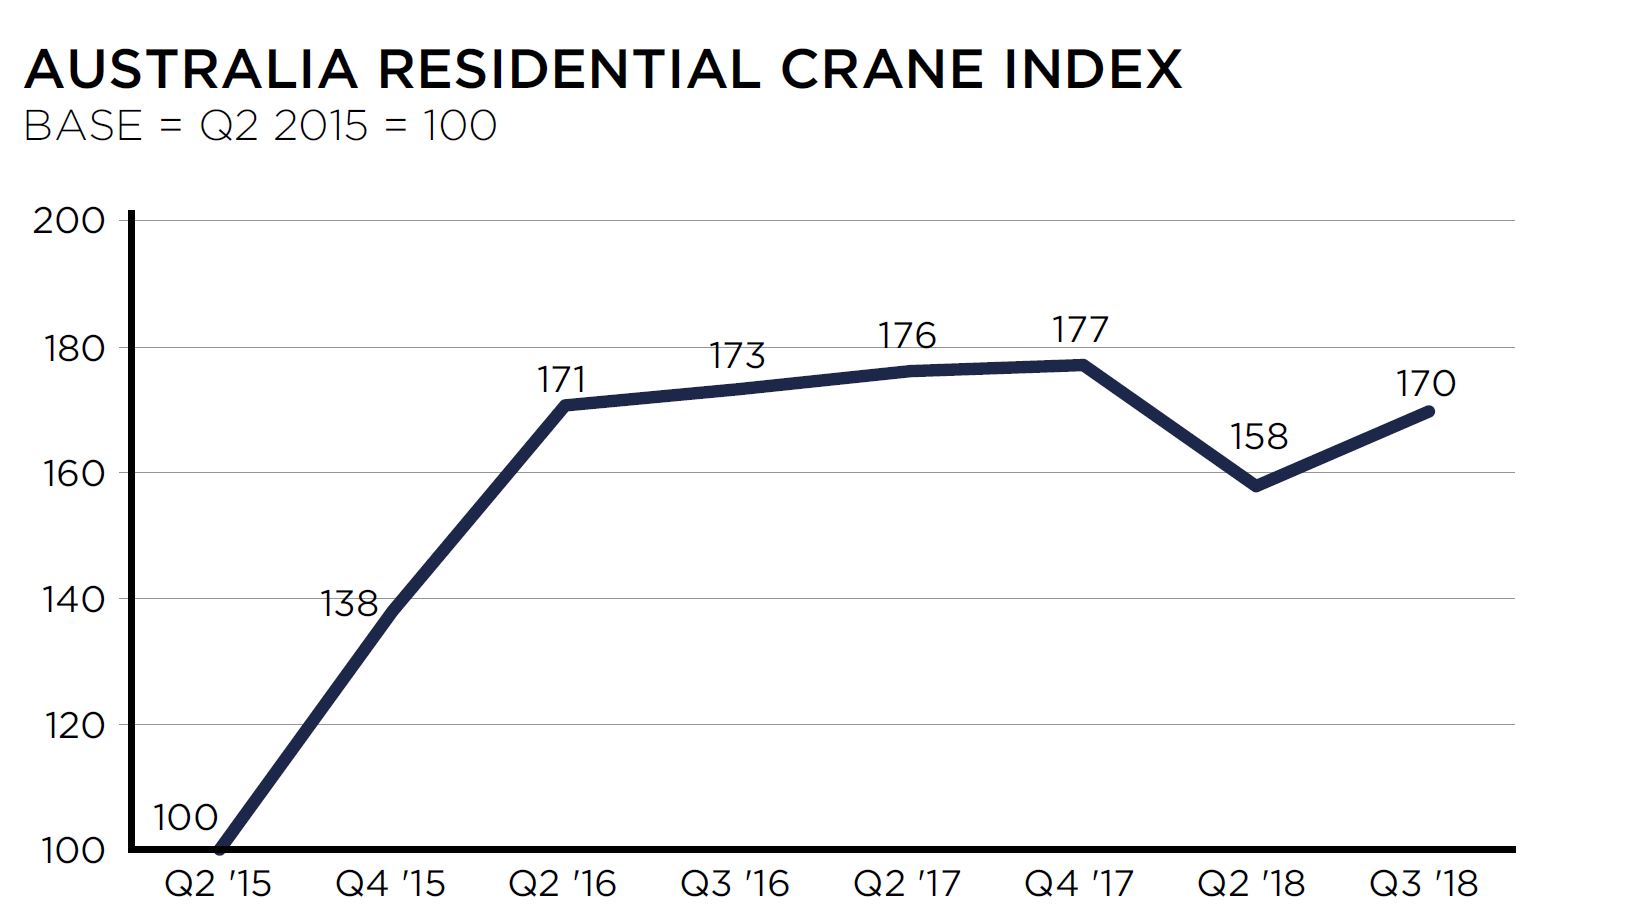
The Residential Crane Index at 170 is just below the peak in late 2017 of 177.  Note this is NOT the number of cranes. However, we suspect construction momentum is easing, so the number is likely to fall in the months ahead, and the index will decline – Melbourne looks likely to be worst hit in the months ahead.

Overseas Migration Down by 9 Per Cent

The ABS data on migration shows a 9% fall since visa changes made in April 2017. No surprise then the HIA bemoans the fall, pointing to slowing demand for new property.

Of course this is another reason why home prices are likely to go lower.

ABS data released today shows that Australia’s annualised population growth rate slowed for the fourth consecutive quarter.

Over the year to March 2018, Victoria saw the strongest growth in population (+2.2 per cent), followed by the ACT (+2.1 per cent) and Queensland (+1.7 per cent). New South Wales was fourth fastest (+1.6 per cent) with Tasmania fifth (+1.0 per cent), Western Australia sixth (+0.8 per cent) and South Australia seventh (+0.7 per cent). The population of the Northern Territory has actually declined over the last two quarters and the annual rate of growth has slowed to 0.1 per cent.

“Australia’s overseas migration fell by 9 per cent since changes to visa requirements came into force in April 2017, slowing the population growth rate to 1.6 per cent,” Mr Murray added.

“In April 2017, Australia introduced a range of visa changes which have been successful in reducing the number of skilled migrants arriving in Australia.

“The current phase of Australia’s 28 years of continuous economic growth is built upon the arrival of skilled migrants. Skilled migration is necessary to offset the impact of our aging population.

“Looking domestically, states such as New South Wales and Victoria that have benefitted the most from overseas migration over recent years are now seeing population growth rates slowing.

“The slowing rate of population growth, while it remains high for a developed economy, will contribute to slower growth of household consumption.

“This means slower growth in sectors such as retail and residential building. Given that these two sectors are amongst the nation’s largest employers the risks presented a decline in population growth should not be underestimated,” concluded Mr Murray.

ABS Confirms Home Value Falls

The ABS reported their residential price indices to June 2018 today.

The total value of residential dwellings in Australia was $6,926,538m at the end of the June quarter 2018, falling $13,321.1m over the quarter. We need to get use to more falls ahead. Of course it varies by locations and property types.

The mean price of residential dwellings fell $4,100 to $686,200 despite the  number of residential dwellings rising by 40,800 to 10,093,700 in the June quarter 201

The price index for residential properties for the weighted average of the eight capital cities fell 0.7% in the June quarter 2018. The index fell 0.6% through the year to the June quarter 2018. So the falls are accelerating and the more recent CoreLogic series shows further falls ahead.

The capital city residential property price indexes fell in Sydney (-1.2%), Melbourne (-0.8%), Perth (-0.1%) and Darwin (-0.9%), and rose in Brisbane (+0.7%), Hobart (+3.0%), Adelaide (+0.3%) and Canberra (+0.6%).

Annually, residential property prices fell in Darwin (-6.1%), Sydney (-3.9%) and Perth (-0.9%), and rose in Hobart (+15.5%), Canberra (+3.0%), Melbourne (+2.3%), Adelaide (+2.1%) and Brisbane (+1.7%).

Employment Booms (A Little)

The trend unemployment rate decreased from 5.4 per cent to 5.3 per cent in the month of August 2018, according to the latest figures released by the Australian Bureau of Statistics (ABS) today.


ABS Chief Economist Bruce Hockman said that “since last August, the trend unemployment and underemployment rates have both fallen. As a result, underutilisation in Australia was at its lowest level since late 2013, at 13.6 per cent.”

Employment and hours

Trend employment increased by around 29,000 persons in August 2018 with full-time employment increasing by around 21,000 persons.

The trend participation rate remained steady at 65.6 per cent in August 2018, after the July figure was revised up.

“For those people aged 15 to 64 years, trend participation was the highest on record. Female participation in this age group, at 73.2 per cent, was also a record high,” Mr Hockman said.

Over the past year, trend employment increased by around 300,000 persons or 2.5 per cent, which was above the average year-on-year growth over the past 20 years (2.0 per cent).

The trend monthly hours worked increased by 0.1 per cent in August 2018 and by 1.8 per cent over the past year.

States and territories

For most states and territories, year-on-year growth in trend employment was at or above their 20 year average, except for Western Australia, Tasmania and the Australian Capital Territory. Over the past year, the states and territories with the strongest annual growth in trend employment were New South Wales (3.6 per cent), the Northern Territory (3.0 per cent) and Victoria (2.5 per cent).

Seasonally adjusted data

The seasonally adjusted number of persons employed increased by around 44,000 persons in August 2018. The seasonally adjusted unemployment rate remained steady at 5.3 per cent, the underemployment rate decreased to 8.1 per cent and the underutilisation rate decreased to 13.4 per cent. The labour force participation rate increased to 65.7 per cent.

The net movement of employed in both trend and seasonally adjusted terms was underpinned by well over 300,000 people entering employment, and more than 300,000 leaving employment in the month.

More Negative Lending Indicators

The ABS has released their data to July 2018 for Housing Finance.  Investors continue to fee the market, and even first time buyers are getting twitchy, while refinancing transactions props up the numbers a little. All as expected, and this underscore more falls in lending flow, and home prices ahead. The rate of decline is increasing.  Loan stock grew 0.26% in the month, but that was in the owner occupied segment. Investor loan stock fell.

The trend estimate for the total value of dwelling finance commitments excluding alterations and additions fell 0.6%. Owner occupied housing commitments was flat, while investment housing commitments fell 1.7%.

As a result the proportion of loan flows for investment property purposes continues to drift lower to 32.7%, the lowest in recent years, while there was no change in owner occupied lending and refinance rose just a little to 20%.

In trend terms, the number of commitments for the purchase of new dwellings fell 1.8%, the number of commitments for the purchase of established dwellings fell 0.2%, while the number of commitments for the construction of dwellings rose 0.2%. In fact that was the only positive indicator!

In trend terms,  overall, the number of commitments for owner occupied housing finance fell 0.2% in July 2018.

In original terms, the number of first home buyer commitments as a percentage of total owner occupied housing finance commitments fell to 18.0% in July 2018 from 18.1% in June 2018.

The number of FTB loans for owner occupied borrowers rose by around 50.  There was a small rise in the number of fixed loans, and the average FTB loan fell by $4,000 perhaps indicating tighter borrowing terms.

The number of FTB investors continues to fall away in line with the broader trends in the investor sector.

All this points to a continued tightening of lending standards and a likley continued decline in loan volumes – which is also a leading indicator of more home price falls ahead.


Securitised Mortgage Assets Rising

The ABS released their June 2018 data today relating the securitised loans in Australia “Assets and Liabilities of Australian Securitisers“.

In the past year residential mortgages securitised rose by 8.9% to $108.8 billion. Overall securitised assets rose by 8.2%, which shows mortgage assets grew stronger than system.

This reflects what we have seen in the market with  non-bank and some bank lenders using this funding channel. The rise of non-bank securitisation is a significant element in the structure of the market.  As major lenders throttle back their lending standards, more higher risk loans are moving into the non-bank and securitised sectors. Of course a decade ago it was the securitised loans which took lenders down in the US and Europe.

The growth we are seeing here is in our view concerning, bearing in mind the more limited regulatory oversight.  Plus. on the liabilities side of the balance sheet, around 90% of the securities are held by Australian investors, a record.

This includes a range of sophisticated investors, including super funds, wealth managers, banks, and high-net worth individuals. But the point to make is that if home price falls continue, the risks in the securitised pools will grow, and this risk is fed back to the investor pools.

Another risk-laden feedback loop linked to the housing sector, and one which is not fully disclosed nor widely understood. The fact that the securitised pools are rated by the agencies does not fill me with great confidence either!


Economy grew 0.9 per cent in June quarter

The Australian economy grew 0.9 per cent in seasonally adjusted chain volume terms in the June quarter 2018, according to figures released by the Australian Bureau of Statistics (ABS) today.

New dwelling investment continued to prop up the numbers, along with government and domestic consumption.

But the two key, and concerning trends are a significant fall in the households savings ratio (as they dip into them to support their spending), and the slower GDP per capita growth, which shows that much of the GDP momentum is simply population related. This is based in trend data.

Plus, real national disposable income per capita fell by 0.2% over the quarter though it was up 2.1% over the year. And average remuneration per employee rose by only 1.7% in the year to June, so remains underwater after adjusting for inflation (2.1%).  Households remain under the gun.

Of course GDP is a really poor set of measures by which to assess the economy in any case….

Chief Economist for the ABS, Bruce Hockman, said: “Growth in domestic demand accounts for over half the growth in GDP, and reflected strength in household expenditure.”

Domestic demand increased 0.6 per cent for the quarter, driven by a 0.7 per cent growth in household consumption, with increased expenditure on both discretionary and non-discretionary goods and services.

General government final consumption expenditure increased 1.0 per cent in the June quarter. Public investment remained at elevated levels reflecting continued work on infrastructure projects across the nation.

Investment in new dwellings increased 3.6 percent for the quarter. with strength observed in Victoria and South Australia. This strength was reflected in the Construction industry, which grew 1.9 per cent for the quarter.

Compensation of employees (COE) grew 0.7 per cent for the quarter due to a rises in the number of wage and salary earners and wage rates. COE growth was prominent in the Health Care and Social Assistance industry.

Moderate growth in household disposable income coupled with strength in household consumption resulted in a decline in the household saving ratio to 1.0 per cent, recording its lowest rate since December 2007.

Will Retail Trade Weaken Ahead?

We look at the latest retail turnover figures from the ABS. What do they tell us about future growth?

Please consider supporting our work via Patreon

Please share this post to help to spread the word about the state of things….

Economics and Markets
Will Retail Trade Weaken Ahead?
Loading
/

Will Retail Trade Weaken Ahead?

The ABS released the retail trade turnover figures today for July 2018. The noisy seasonally adjusted numbers returned no growth on last month (which had exceed expectations in June). This is what will be reported, I suspect and equates to 2.7% annually.

However, as usual we look beyond the seasonally adjusted series to the trend data, which provides a better longer term indication of what is happening. In fact on an annual basis retail is sitting at 3.1% for the past 12 months, still above both wages growth and inflation, at circa 2%. So we can conclude that households are still spending, but financial pressures are crimping their style. Savings are being raided, and credit extended.  But 3.1% is reasonably healthy, given the state of things.

The data is reported firstly by major category, with Household Goods sitting at 3.8% annually, Food Retailing at 2.7%, Departmental Stores at 2.5%, and Clothing & Footwear at 1.4%.

The state annual data, on the same basis highlights significant contrasts across the country, with Victoria leading the charge at a massive 5.4%, followed by Tasmania at 4.7%, the ACT at 4.2%, NSW 3.7%, South Australia 2.8%, Queensland 1.4% and Western Australia down 0.5%.

We often see a correlation between home price growth and retail, and as a result, we suspect Victoria will slide lower now, given the fact that in the past quarter values fell in VIC.

The mix of low income, and rising costs coupled with the latest home price falls suggests that retail will be struggling ahead, as shops continue to discount heavily to turn trade over. Indeed, the retail turnover data actually tells us very little in terms of margin and profit, and the data from our own SME surveys suggests that it is really tough for many across discretionary categories, while food costs are rising.

Later we will get a read on GDP, but it looks like household consumption will not be providing a significant leg-up to the next set of indicators.

Finally, Online retail turnover contributed 5.5 per cent to total retail turnover in original terms in July 2018, a fall from 5.7 per cent in June 2018. In July 2017 online retail turnover contributed 4.3 per cent to total retail.