Residential Construction Rotates

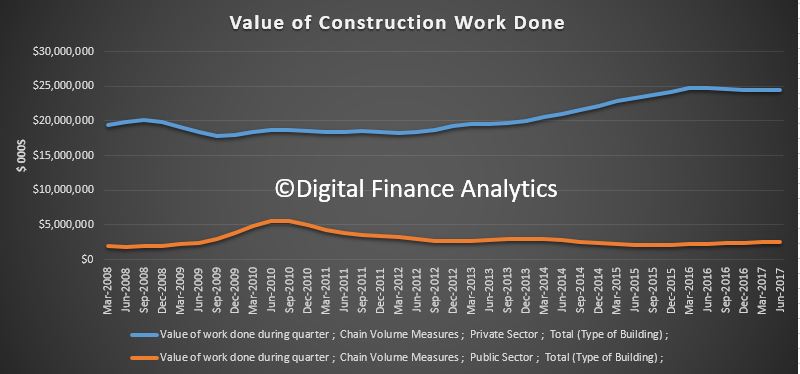
The latest data from the ABS shows building construction activity to June 2017. We see a small rotation towards non-residential work, supported by investment from the public sector. The trend estimates, which irons out the bumps in the series, shows a rise in total building work done, with a fall in residential building of 1.2% and a rise in non-residential building of 2.8%.

Within the residential data, new houses fell 1.3% and other new residential building fell 1.0%.

The trend estimate of the value of total building work done rose 0.3% in the June 2017 quarter.

The trend estimate of the value of new residential building work done fell 1.2% in the June quarter. The value of work done on new houses fell 1.3% while new other residential building fell 1.0%.

The trend estimate of the value of non-residential building work done rose 2.8% in the June quarter.

The trend estimate for the total number of dwelling units commenced fell 3.0% in the June 2017 quarter following a fall of 2.8% in the March quarter.

The trend estimate for new private sector house commencements fell 1.6% in the June quarter following a fall of 2.7% in the March quarter.

The trend estimate for new private sector other residential building commencements fell 4.6% in the June quarter following a fall of 3.0% in the March quarter.

Retail Turnover On The Slide

More evidence of strained household budgets with the release today of the August 2017 ABS data on Retail Turnover.

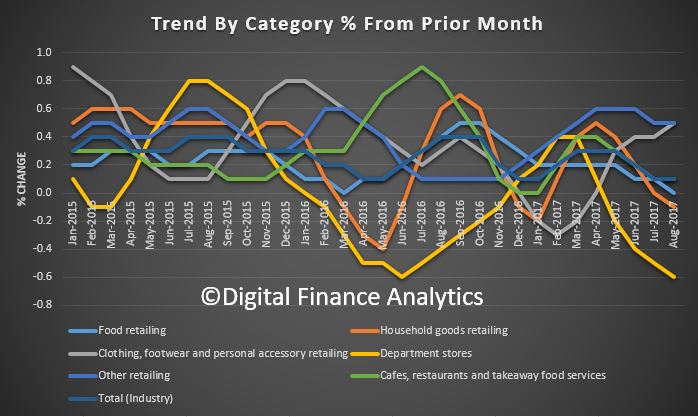
Australian retail turnover fell 0.6 per cent in August 2017, seasonally adjusted, according to the latest Australian Bureau of Statistics (ABS) Retail Trade figures. This follows a fall of 0.2 per cent in July 2017.

In seasonally adjusted terms, there were falls in food retailing (-0.6 per cent), cafes, restaurants and takeaway food services (-1.3 per cent), household goods retailing (-1.0 per cent) and clothing, footwear and personal accessory retailing (-0.2 per cent). There were rises in department stores (0.7 per cent) and other retailing (0.1 per cent) in August 2017.

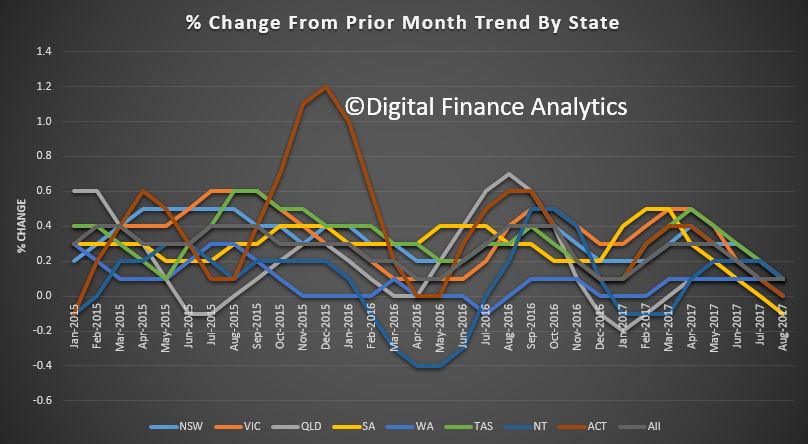
In seasonally adjusted terms, there were falls in all states and territories. “Victoria (-0.8 per cent) and Queensland (-0.8 per cent) led the falls,” said Ben James, Director of Quarterly Economy Wide surveys.

“There were also falls in New South Wales (-0.2 per cent), Western Australia (-0.6 per cent), South Australia (-0.6 per cent), the Australian Capital Territory (-0.8 per cent), Tasmania (-0.7 per cent) and the Northern Territory (-0.7 per cent).”

The trend estimate which irons out the bumps was a little more sanguine, with retail turnover rising 0.1 per cent in August 2017 following a 0.1 per cent rise in July 2017. Compared to August 2016, the trend estimate rose 2.8 per cent.

Some significant state variations, but overall direction is clearly down.

Online retail turnover contributed 4.6 per cent to total retail turnover in original terms.

More evidence of stressed household budgets, which is no surprise given the current economic settings.

Trend dwelling approvals rise 1.1 per cent in August

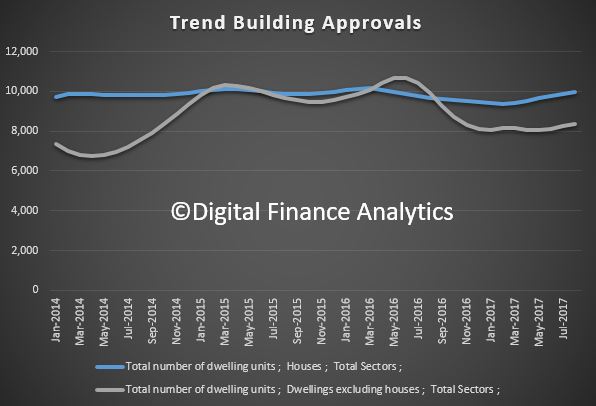
The number of dwellings approved rose 1.1 per cent in August 2017, in trend terms, and has risen for seven months, according to data released by the Australian Bureau of Statistics (ABS) today.

In trend terms, approvals for private sector houses rose 0.9 per cent in August. Private sector house approvals rose in Queensland (2.0 per cent), South Australia (1.4 per cent), Victoria (1.1 per cent) and Western Australia (0.3 per cent), but fell in New South Wales (0.3 per cent).


Dwelling approvals increased in August in the Australian Capital Territory (8.9 per cent), Northern Territory (8.3 per cent), Victoria (1.5 per cent), Tasmania (1.2 per cent), Queensland (1.0 per cent), South Australia (0.9 per cent) and New South Wales (0.7 per cent), but decreased in Western Australia (0.8 per cent) in trend terms.

“Dwelling approvals have shown signs of strength in recent months, although are still below the record high in 2016,” said Bill Becker, Assistant Director of Construction Statistics at the ABS. “The August 2017 data showed that the number of dwellings approved is now 6.5 per cent lower than in the same month last year, in trend terms.”

In seasonally adjusted terms, dwelling approvals increased by 0.4 per cent in August, driven by a rise in private dwellings excluding houses (4.8 per cent), while private house approvals fell 0.6 per cent.

The value of total building approved fell 0.3 per cent in August, in trend terms, after rising for six months. The value of residential building rose 0.7 per cent while non-residential building fell 1.8 per cent.

A Floor Under Property Price Falls

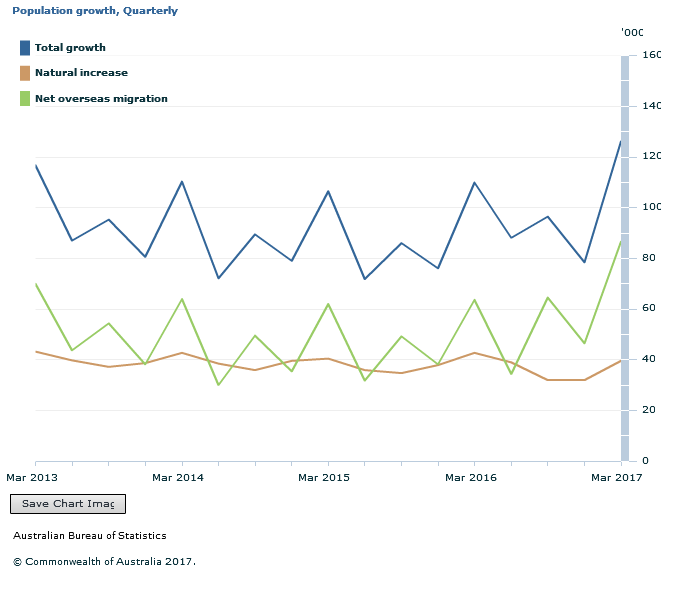
The ABS today released March 2017 demographic statistics, which shows that natural population growth is being dwarfed by net overseas migration. All these new households will need somewhere to live, so they be competing with existing residents for property, both in the rental sector, and for purchase. This is likely to put a floor under property demand and so home prices.

Bottom line, there is a strong link between home prices and population growth.  So, one lever which should be considered to take the sting out of the property cycle is to reduce net migration. Politically speaking, this appears unlikely as a “big Australia” strategy lays behind much of current public discourse.

The ABS says that the preliminary estimated resident population (ERP) of Australia at 31 March 2017 was 24,511,800 people. This is an increase of 389,100 people since 31 March 2016, and 126,100 people since 31 December 2016.

Within that, the preliminary estimate of natural increase for the year ended 31 March 2017 (142,400 people) was 5.8%, or 8,800 people lower than the natural increase recorded for the year ended 31 March 2016 (151,300 people).

The preliminary estimate of net overseas migration (NOM) for the year ended 31 March 2017 (231,900 people) was 26.9%, or 49,100 people higher than the net overseas migration recorded for the year ended 31 March 2016 (182,800 people).

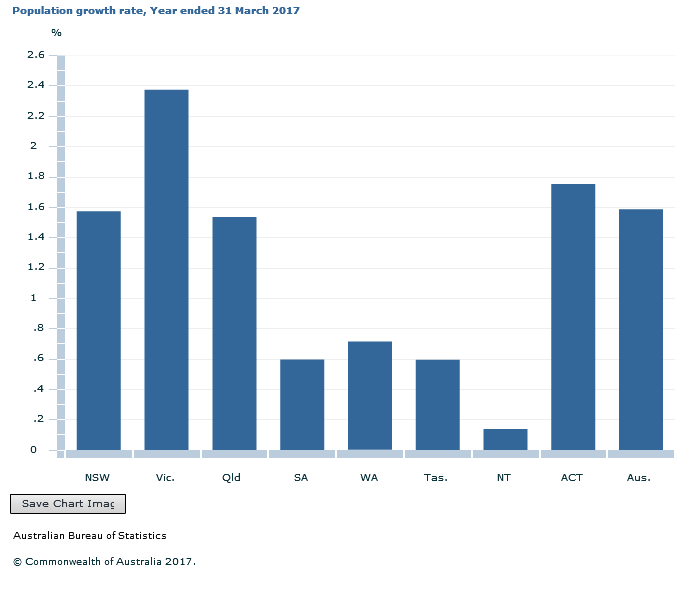
Significantly, the state with the highest growth rate was Victoria, which is currently seeing the strongest auction clearance rates, strong demand, and home price growth. This is not a surprise, given the high migration

The ABS says Australia’s population grew by 1.6% during the year ended 31 March 2017. Natural increase and NOM contributed 36.6% and 59.6% respectively to total population growth for the year ended 31 March 2017 with intercensal difference accounting for the remainder. All states and territories recorded positive population growth in the year ended 31 March 2017. Victoria recorded the highest growth rate of all states and territories at 2.4%. The Northern Territory recorded the lowest growth rate at 0.1%.


Property Price Rises; It Depends

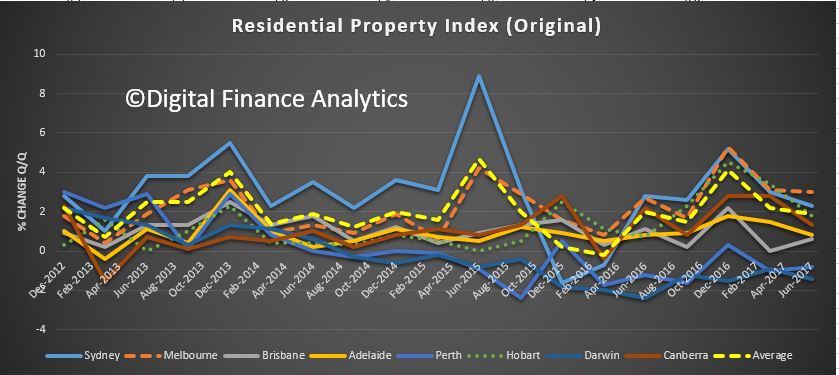
The latest ABS data on Residential Property Prices to Jun 2017 are out. They show considerable variations across the states, with Melbourne leading the charge, and Perth and Darwin languishing.

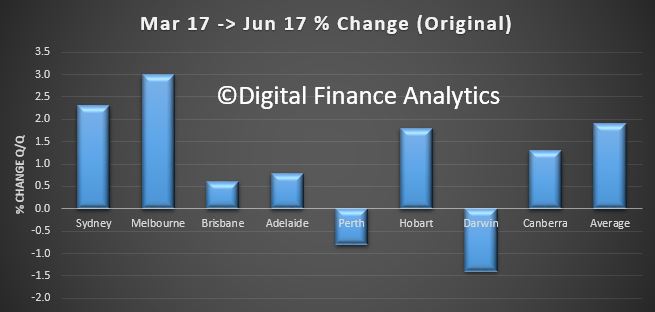
The price index for residential properties for the weighted average of the eight capital cities rose 1.9% in the June quarter 2017. The index rose 10.2% through the year to the June quarter 2017.

The capital city residential property price indexes rose in Sydney (+2.3%), Melbourne (+3.0%), Brisbane (+0.6%), Adelaide (+0.8%), Canberra (+1.3%) and Hobart (+1.8%) and fell in Perth (-0.8%) and Darwin (-1.4%).

Annually, residential property prices rose in Sydney (+13.8%), Melbourne (+13.8%), Hobart (+12.4%), Canberra (+7.9%), Adelaide (+5.0%) and Brisbane (+3.0%) and fell in Darwin (-4.9%) and Perth (-3.1%).

The total value of residential dwellings in Australia was $6,726,783.5m at the end of the June quarter 2017, rising $145,868.5m over the quarter.

The mean price of residential dwellings rose $12,100 to $679,100 and the number of residential dwellings rose by 40,000 to 9,906,100 in the June quarter 2017.


Trend Full-Time Employment Rate Still At 5.6%

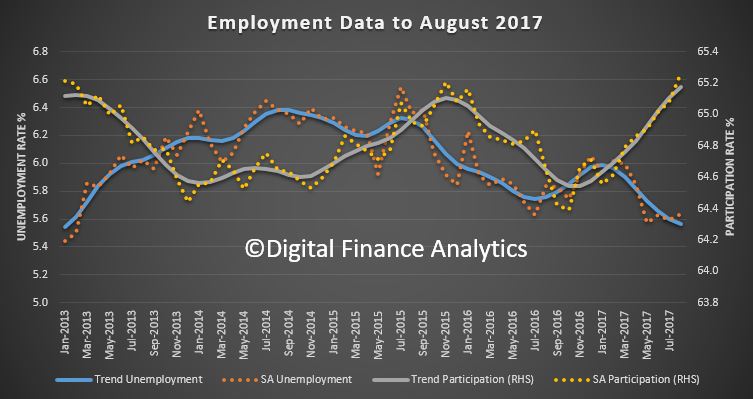
Monthly trend full-time employment increased for the 11th straight month in August 2017, according to figures released by the Australian Bureau of Statistics (ABS) today.

The trend unemployment rate in Australia remained at 5.6 per cent in August 2017, and the labour force participation rate increased to 65.2 per cent, the highest it has been since April 2012.

The quarterly trend underemployment rate remained steady at 8.7 per cent over the quarter to August 2017 from a revised figure for May 2017 quarter.

“The underemployment rate is an important indicator of the spare capacity of workers in Australia, and it has remained at 8.7 per cent, a historical high, for the third consecutive quarter,” the ABS said.

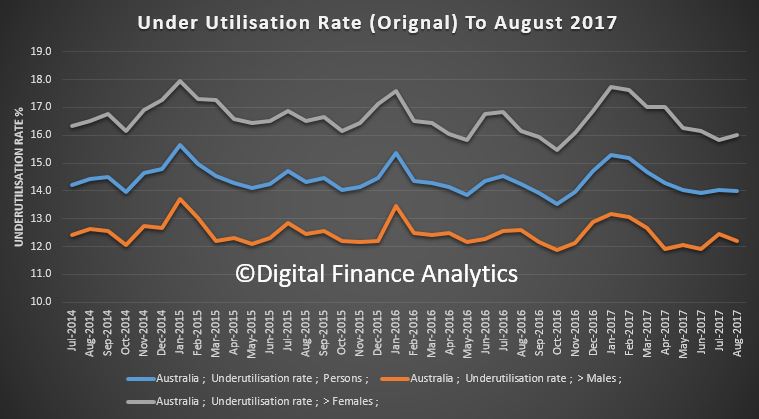
The quarterly trend underutilisation rate, which includes both unemployment and underemployment, decreased by 0.1 percentage points to 14.2 per cent.

Trend series smooth the more volatile seasonally adjusted estimates and provide the best measure of the underlying behaviour of the labour market.

Full-time employment grew by a further 22,000 persons in August, while part-time employment increased by 6,000 persons, underpinning a total increase in employment of 27,000 persons.


“Full-time employment has now increased by around 253,000 persons since August 2016, and makes up the majority of the 307,000 person increase in employment over the period,” Chief Economist for the ABS, Bruce Hockman, said.

Over the past year, trend employment increased by 2.6 per cent, which is above the average year-on-year growth over the past 20 years (1.9 per cent).

The rate of employment growth (2.6 per cent) was greater than the growth in the population aged 15 years and over (1.7 per cent), which was reflected in an increase in the employment to population ratio (which is a measure of how employed the population is). This ratio increased by 0.6 percentage points since August 2016, up to 61.5. This is the highest it has been since February 2013.

Over the past year the three states and territories with the strongest growth in employment were Tasmania (4.0 per cent), Queensland (3.7 per cent) and Victoria (3.2 per cent).

The trend monthly hours worked increased by 3.9 million hours (0.23 per cent) to 1,708.6 million hours in August 2017.

The seasonally adjusted number of persons employed increased by 54,200 in August 2017. The seasonally adjusted unemployment rate remained steady at 5.6 per cent and the labour force participation rate increased to 65.3 per cent.

Income inequality ticks down as the rich see their incomes fall: ABS

From The Conversation.

Income inequality has dropped slightly in Australia, largely driven by a fall in incomes for the richest 20% of the population, according to the latest Australian Bureau of Statistics (ABS) Survey of Household Income and Wealth.

The richest 20% of the population have seen their real disposable incomes (adjusted for the number of people living in the household) fall by nearly 5%, or close to A$100 per week. Most other households have seen no real increase in their incomes over the two years since the previous survey was released.

Our recent public debate over whether inequality is rising or falling ran into the problem that the two most important sources of data were showing different trends. The ABS survey continues to show a higher level of income inequality than the HILDA survey, but the latest trends now look more similar.

Possibly the best characterisation of the latest ABS figures is that they show inequality remains higher than at any period before 2007-08, but in the short term it is unclear what to expect.

As you can see in the following chart, there has been a slight fall in income inequality between 2013-14 and 2015-16, with the Gini coefficient for “Equivalised Disposable Household Income” falling from 0.333 to 0.323. The Gini coefficient is a measure between zero (where all households have the same income) and one (where only one household claims all the income).Equivalised Disposable Household Income is the total income of the household from all sources including social security payments, minus direct taxes, and then adjusted for the number of people living in the household. For example, a household of a couple with two children under the age of 15 is assumed to need 2.1 times the income of a household of a single adult to achieve the same standard of living.

So what explains these most recent trends? At this stage, it’s difficult to be definitive. It should also be borne in mind that it has only been two years since the last survey, the overall change is not large, and so we should be cautious in unpacking the trends.

But it is worth noting that this small reduction in income inequality has come at the same time as a small fall in both median and mean disposable incomes for Australian households.

The average taxes paid by households have also risen slightly in real terms (adjusted for inflation) since 2013-14, while the average social security benefits have stayed the same in real terms. This masks a significant drop in the real level of family payments (such as the family tax benefit) received by households, and increases in age pensions and “other payments” (overseas pensions and benefits, partner allowance, sickness allowance, special benefit, war widow pension (DVA), widow allowance, and wife pensions etc.).

However, where there does appear to be large changes are in the sources of income for households. If we compare incomes between the 2013-14 and 2015-16 surveys, we find that the only group that has enjoyed real increases in incomes are those whose main source of income is social security benefits. But these have risen by only A$6 per week, or about 1.3%, and they remain by far the lowest income households in Australia, with their average incomes remaining less than half of all other household groups.

Households who mainly rely on wages and salaries have seen their average real disposable incomes fall by about A$17 per week, or about 1.4%.

The biggest declines are among those who mainly rely on self-employment income from unincorporated businesses – usually a small business which has not incorporated as a registered company – and people whose main source of income is “other”.

“Other” includes many things, such as income received as a result of ownership of financial assets (interest, dividends), and of non-financial assets (rent, royalties), as well as from sources such as incorporated business income (i.e. companies), superannuation, child support, workers’ compensation and scholarships.

This group is fairly small – about 8% of households, but they are both the group with the highest and most unequal incomes and by far the highest level of net worth (assets minus liabilities). Their average incomes have fallen by around A$93 a week in real terms, or around 8%, but their median real incomes rose by around A$11 per week, suggesting that the loss in income was concentrated among higher income households in this group.

This group in 2013-14 had by far the highest level of income inequality with a Gini coefficient of 0.474. This has fallen to 0.423 in 2015-16. But because a lot of this income comes from the stockmarket, we can expect it to be more volatile.

The group who appear to have lost by far the most, however, are households whose main source of income is unincorporated business income. This is an even smaller group – around 4.6% of all households in 2015-16. Their real average incomes have fallen by more than A$160 per week, or around 16%. They also have a high level of inequality within their group, with a Gini coefficient of 0.353 in 2015-16, down from 0.389 two years previously.

But the overall change in income inequality is not large, and it does not significantly change Australia’s international ranking.

Writing in the Australian yesterday, Nick Cater of the Menzies Research Centre asserted that Australia is “one of the most equal and socially mobile nations on earth”. But even with the slight reduction in inequality, we are slightly above the OECD average, and there are around 20 OECD countries who are likely to have lower levels of income inequality than Australia.

Overall, the data shows a relatively small change in incomes for employee households and for households whose main source of income is social security payments. Together, these account for 87% of all households in Australia.

The reduction in overall income inequality in this period is therefore explained by the falls in income for the self-employed and for the “other” group – the group with the highest incomes and wealth.

Understanding what exactly has been happening for these groups and why will require further time and analysis. The volatility of the income sources for these groups is another reason to be cautious about projecting future trends.

Author: Peter Whiteford, Professor, Crawford School of Public Policy, Australian National University

Households Spending More On Basics

The ABS has released their 2015-16 Household Expenditure Survey (HES).

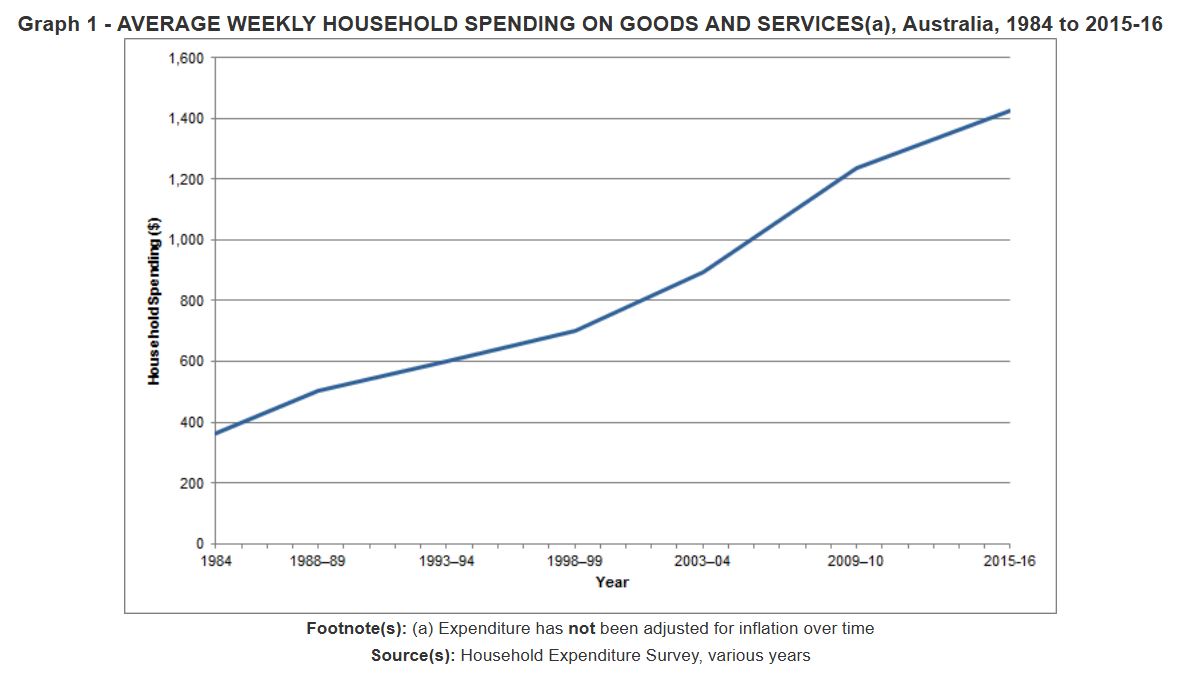
More than half the money Australian households spend on goods and services per week goes on basics – on average, $846 out of $1,425 spent.

Australian household spending on goods and services increased by 15% between 2009-10 and 2015-16, going from an average of $1,236 per week to $1,425.

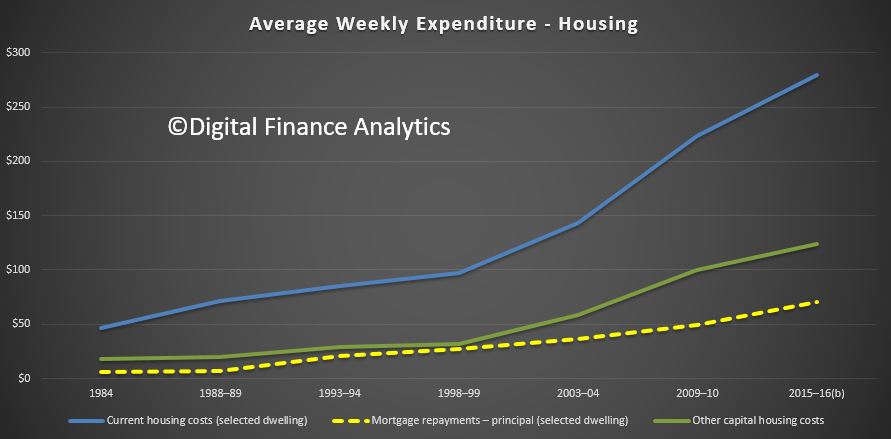
Housing costs have accelerated significantly.

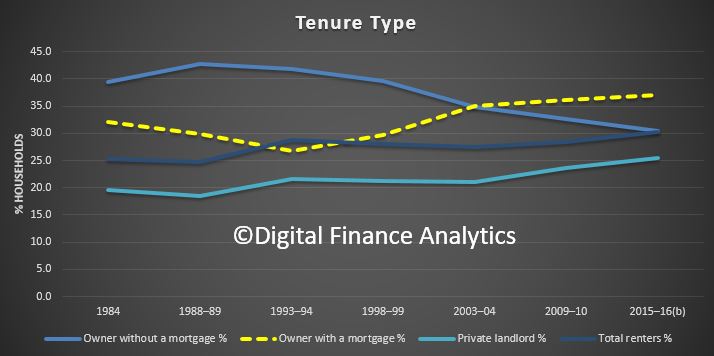
The data shows that more households now have a mortgage, while less are mortgage free. Rental rates remain reasonably stable, despite a rise in private landlords.

The goods and services that Australian households were spending the most on in 2015-16 were current housing costs ($279 per week), food and non-alcoholic beverages ($237 per week) and transport ($207 per week).

Average weekly spending on goods and services was highest in the Northern Territory and Australian Capital Territory ($1,700 and $1,670) and lowest in Tasmania and South Australia ($1,141 and $1,192).

“We can broadly think about household spending as either being for ‘basics’ or for ‘discretionary’ purchases – with basics covering essentials such as housing, food, energy, health care and transport,” ABS Chief Economist, Bruce Hockman said.

Today’s release shows that a growing portion of weekly outlays is spent on basics. Spending on basics accounted for 56 per cent of weekly household spending in 1984, growing to 59 per cent in 2015-16.

“The survey also shows that since 1984, the pattern of household spending has changed considerably,” explained Mr Hockman.

“In 1984, the largest contributors to household spending were food (20 per cent), then transport (16 per cent) and housing (13 per cent).”

“Jump forward to 2015-16, and housing is now the largest contributor (20 per cent), followed by food (17 per cent), and transport costs (15 per cent).”

More recently, since the last survey in 2009-10, the biggest increases in spending on goods and services by households have been in education (44 per cent), household services and operations, such as cleaning products and pest control services (30 per cent), energy (26 per cent), health care (26 per cent) and housing (25 per cent).

On the other hand, spending on alcohol, tobacco, clothing and footwear and household furnishings have not changed significantly from six years ago.

Mr Hockman added that, in 2015-16, 1.3 million Australian households (15 per cent) reported 4 or more markers of financial stress, down from 16 per cent in 2009-10. In addition, the proportion of Australian households who did not report experiencing any markers of financial stress has steadily increased, from 54 per cent in 2009-10, to 59 per cent in 2015-16.


  • ‘Housing’ includes expenditure on rent, interest payments on mortgages, rates, home and content insurance and repairs and maintenance. Principle repayments on mortgages are reported separately.
  • ‘Food’ also includes expenditure on non-alcoholic beverages and meals out. Expenditure on alcoholic beverages are reported separately.
  • ‘Energy’ includes domestic fuel and power costs such as gas and electricity.
  • ‘Health care’ includes expenditure on health practitioner’s fees, accident and health insurance, and medicines, pharmaceutical produces and therapeutic appliances.
  • ‘Transport’ includes vehicle purchases and their ongoing running costs, public transport, taxi and ride sharing fares.
  • Proportions of spending are based on total goods and services expenditure. This excludes items which increase household wealth (such as the principal component of mortgage repayments).
  • Financial stress indicators include a range of items, such as not being able to raise emergency funds.
  • Estimates are for people who reside in private dwellings in Australia, excluding Very Remote areas.

Green Shoots Of Business Investment – Maybe!

The latest data from the ABS: Lending Finance to end July 2017, is the final piece on the monthly data releases which is the story of finance. Most striking is the rise in commercial lending, other than for investment home investment, up 2%, while lending for property investment fell as a proportion of all lending, and of lending for residential housing. This included significant falls in NSW where it appears investors may be changing their tune.

So, finally some green shoots of business investment perhaps. We really need this to come on strong to drive the growth we need to stimulate wages. The upswing is there, but quite small, so we need to watch the trajectory over the next few months.  Overall lending grew 0.64% in the month, (which would be 7.8% on an annualised basis), way stronger than wages or cpi.

The total value of owner occupied housing lending excluding alterations and additions rose 0.7% in trend terms. The trend series for the value of total personal finance commitments fell 0.5% within which fixed lending commitments fell 0.6% and revolving credit commitments fell 0.4%.

The trend series for the value of total commercial finance lending rose 0.8% of which fixed lending commitments rose 1.0% and revolving credit commitments rose 0.1%, while the value of total lease finance commitments fell 4.1% in July 2017.

The ABS made a series of revisions in prior months – without explanation: Commercial Finance for the month of June 2017, Personal Finance for the periods between April 2017 to June 2017 and Investment housing finance for the month of June 2017.


There’s No Stopping The Housing Train

The latest data from the ABS, Housing Finance to July 2017, confirms what we knew. Owner occupied purchases are steaming ahead, while investment lending is stagnating. A clear reflection of the tightening in investor lending regulation, and the availability of new incentives and grants for first time buyers, alongside the attractor loan rates for new borrowers.

We saw first time buyers more active in NSW and VIC, two states where new concessions started in July.

A small but important rise, which is still well below the pre-GFC peak of 30%.

Importantly, owner occupied lending is still rising stronger than inflation or incomes, so the burden of household debt is set to rise further. Some revisions to earlier months data were made, and the RBA already highlighted that $1.4 billion of loans were reclassified between investment and owner occupied loans in the month.

In July, the trend lending flows were $33 billion, up 0.1%, with owner occupied lending up $20.8 billion or 0.7%, and Investment lending down 1% to $12.1 billion.  The number of owner occupied transaction rose 0.6%, construction of dwellings rose 2%, new dwellings, 2% and the purchase of established dwellings 0.3%.

The owner occupied lending trends highlight the rise in loans for construction and new building, as well as a rise in refinanced loans.

In original terms, the number of first home buyer commitments as a percentage of total owner occupied housing finance commitments rose to 16.6% in July 2017 from 14.9% in June 2017. The absolute number of loans also rose.

The number of first time buyer investors fell (using data from our surveys) showing a clear movement towards owner occupied first time buyer purchase.

The number, and proportion of first time buyers rose, and there was a rise in the proportion of loans on a fixed rate, reflecting attractive offers, and concerns about future rate rises.

As a result, in original terms, the total pool of loan stock rose more than $6 billion in the month,  to another record of $1.61 trillion.

  The bulk of the rise was in the owner occupied sector.

So the good news for banks is their loan portfolios are still growing, and their margins are now quite healthy. The longer term social impact of households saddled with massive debt will work out over a generation, but it highlights how exposed the nation is to any potential rise in interest rates.