Wages Growth Flat, and Low

The seasonally adjusted Wage Price Index (WPI) rose 0.5 per cent in the June quarter 2016 and 2.1 per cent over the year, according to figures released today by the Australian Bureau of Statistics (ABS). This is the same result as in March quarter 2016.

Seasonally adjusted, private sector wages grew 0.5 per cent and public sector wages grew 0.6 per cent in the June quarter 2016. Through the year private sector wages grew 2.0 per cent and public sector wages grew 2.4 per cent.

The wholesale trade industry recorded the highest quarterly rise of 0.9 per cent in June quarter 2016 and the retail trade industry recorded the lowest quarterly rise of 0.1 per cent.

Wage growth remains low across many industries. Through the year rises for the June quarter 2016 ranged from 1.3 per cent for mining to 2.6 per cent for electricity, gas, water and waste services.

Here is the original data by states.

Wages-June-2016Inflation is running at a similar low level, according to the official figures, at 0.4% but data from our surveys indicates that many households are going backwards in real terms.  This is especially true in the mining heavy states of WA and QLD, as well as NSW.

The All Consuming Housing Lending Machine

The June 2016 finance data released by the ABS today underscores the fundamental in-balances in bank lending, and signals the underlying issues and risks in the economy.

Lending-Trends-Jun-16Looking at the trend series of lending flows, we see that overall lending fell in the month by 1.21% compared with last month, or $819 million, and continues the fall in overall lending flows since March 2015. Remember the trend series irons out the monthly variations.

But, if we look across the series, secured lending for owner occupied housing, rose 0.17% or $34 million, whilst secured housing alterations and additions fell 0.59% or $2 million. Personal credit fixed loans rose 0.81% or 35 million, whilst revolving personal credit fell 0.43% or 12 million.

Business lending is split into loans for investment housing, which rose 0.77% or 88 million, whilst lending for other commercial purposes fell by 3.26% or $617 million.  Revolving business lending fell 3.82% or $330 million. Overall business lending, including for housing fell 2.21% or 859 million.

Then, look at the various ratios, as calculated from the chart above. More than 30% of all business lending was for investment housing, this is the highest in more than a year. Overall the banks lent 48.6% of their flows to housing related borrowing across the board, this has never been higher. The percentage of lending to business net of housing lending was down to 39.9%, significantly lower than ever before, even taking into account the period around the GFC, and investment housing related lending rose to 17.2% of all lending flows, compared with 12% in 2008.

This continues to be a worryingly myopic approach to building sustainable economic growth. Businesses are unwilling or unable to investment in growth related programmes, and banks prefer to lending to the “safe as houses” property sector.

Two points to make. First, real growth, sustainable growth, has to come from real productive investments, not just more housing which pumps up home prices and bank balance sheets, and makes households feel a little more wealthy (actually more “in hoc” to ever bigger banks).

Second, putting all the eggs in the housing basket simply exposes more to risk, should home prices begin to correct toward their long term values – values which are currently on average 25-30% above where they should be.

Underlying this is the risk reward trade off the banks are making, facilitated by the still too generous capital weightings for housing, compared with other lending categories. We need to have the ground shift such that there is more willingness for banks to lend to business. This will be hard, given the rising commercial exposures reported in this results season. The housing machine continues to consume all it its wake, leaving households with ever more debt, and no clear path to sustainable long term growth.


Latest Home Finance Data Is All About Investment Loans

The latest finance data, for June was released by the ABS today. The trend estimate for the total value of dwelling finance commitments excluding alterations and additions rose 0.4%. Investment housing commitments rose 0.8%, and owner occupied housing commitments rose 0.2%.  Ignore the 3.2% seasonally adjusted investment loan number, it is too unreliable.

The proportion of loans for investment purposes rose in the month, and was 35.85% of all home loans.

Jun16HouFin1Looking at the composition of the changes, month on month, in percentage terms (left hand scale, bars), investment loans for individuals rose 1.27% (up $115m), whilst OO lending for new dwellings fell.

Jun16HouFin2 In trend terms, the number of commitments for owner occupied housing finance rose 0.2% in June 2016 whilst the number of commitments for the purchase of new dwellings rose 0.6%, the number of commitments for the purchase of established dwellings excluding refinancing rose 0.2%, while the number of commitments for the construction of dwellings fell 0.1%.

In original terms, the number of first home buyer commitments as a percentage of total owner occupied housing finance commitments rose to 14.3% in June 2016 from 14.2% in May 2016. However the number of purchasers fell 2.2%.

Jun16HouFin3The DFA investment tracker, which measures first time buyers going direct to the investment sector rose 1.1%, with more than 4,000 purchasers in the month.

Jun16HouFin4 It is worth remembering the RBA identified $1bn of loans switched between investment and owner occupied in the month, so this may have distorted the figures. In addition the ABS warns:

Monthly First Home Buyer statistics will be subject to revision as the modelled component is adjusted to reflect improved reporting by lenders. The ABS is currently investigating the effect of improved reporting on the model and, subject to all institutions providing improved data, expects to revise First Home Buyer statistics in coming months. The revisions will be preceded by an Information Paper explaining the changes. Information relating to changes to the method of estimating loans to first home buyers, introduced from the December 2014 issue. First home buyers are defined as persons entering the home ownership market as owner-occupiers for the first time. First time investors are excluded.

Retail turnover rises 0.1 per cent in June

Australian retail turnover rose 0.1 per cent in June 2016, seasonally adjusted, according to the latest Australian Bureau of Statistics (ABS) Retail Trade figures.

Wallet-PicThis follows a rise of 0.2 per cent in May 2016.

In seasonally adjusted terms, there were rises in clothing, footwear and personal accessory retailing (3.5 per cent), household goods retailing (0.3 per cent) and department stores (0.7 per cent). There were falls in food retailing (-0.6 per cent), cafes, restaurants and takeaway food services (-0.1 per cent) and other retailing (-0.1 per cent) in June 2016.

In seasonally adjusted terms, there were rises in Queensland (1.1 per cent) and Western Australia (0.1 per cent). Turnover in South Australia was relatively unchanged (0.0 per cent). There were falls in New South Wales (-0.2 per cent), Victoria (-0.1 per cent), the Australian Capital Territory (-0.6 per cent), the Northern Territory (-1.1 per cent) and Tasmania (-0.2 per cent).

The trend estimate for Australian retail turnover rose 0.2 per cent in June 2016 following a 0.2 per cent rise in May 2016. Compared to June 2015 the trend estimate rose 3.1 per cent.

Online retail turnover contributed 3.4 per cent to total retail turnover in original terms.

In seasonally adjusted volume terms, turnover rose 0.4 per cent in the June quarter 2016, following a rise of 0.5 per cent in the March quarter 2016. The largest contributor to the rise was other retailing, which rose 1.9 per cent in seasonally adjusted volume terms in the June quarter 2016.

Retirees choosing income streams over super lump sums

Retirees are increasingly choosing to access their superannuation through income streams rather than withdrawing lump sums, according to new analysis released today by the Australian Bureau of Statistics (ABS).

OldiesBjorn Jarvis, the Program Manager of the ABS’ Labour and Income Branch reported that almost 1.2 million people were receiving an income stream from their superannuation in 2013-14, at an average of $502 per week.

“Of that 1.2 million, about three quarters were aged 65 years or over and one quarter were between 55 and 64 (876,000 and 307,000, respectively),” said Mr Jarvis.

“This means just over one in four people aged 65 years and over (excluding those in nursing homes and retirement villages) were receiving a superannuation income stream in 2013-14, up from one in five in 2003-04.”

Mr Jarvis also said that in 2013-14, 420,000 people reported they had withdrawn a lump sum from their superannuation in the previous two years. Half were for amounts less than $25,000.

“Three quarters of people used the lump sum to invest in their home, make other investments, buy or pay off a vehicle, or to pay off outstanding debts. For the other one quarter, the most commonly cited reasons were for holidays, followed by general living and medical expenses,” said Mr Jarvis.

The number of people with some superannuation and the average value of their accounts have both grown in the 10 years to 2013-14.

In 2003-04, around twothirds (64 per cent) of people aged 15 years and over, had superannuation. By 2013-14, this had risen to 71 per cent, with about 85 per cent of people aged 25 to 54 years having superannuation. For people with superannuation, the average value of their accounts increased in real terms from $68,000 to $110,000.

Dwelling Approvals Fall In June

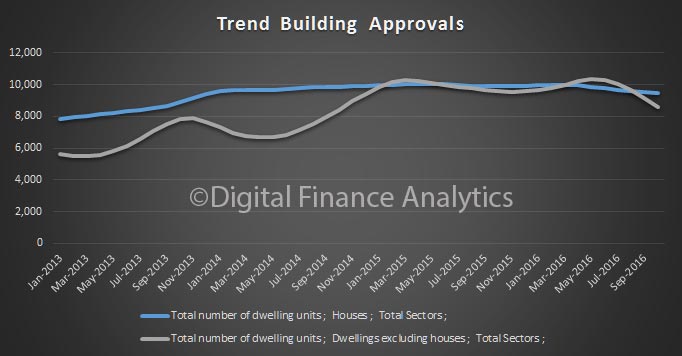
The number of dwellings approved fell 0.9 per cent in June 2016, in trend terms, according to data released by the Australian Bureau of Statistics (ABS) today. This is the second successive monthly fall.

Building-Approvals-June-2016Dwelling approvals decreased in June in Western Australia (5.2 per cent), Tasmania (3.7 per cent), Queensland (3.2 per cent), Australian Capital Territory (2.8 per cent) and Victoria (0.1 per cent), but increased in the Northern Territory (3.6 per cent), South Australia (1.6 per cent) and New South Wales (0.8 per cent) in trend terms.

In trend terms, approvals for private sector houses fell 0.6 per cent in June. Private sector house approvals fell in Western Australia (3.5 per cent), Victoria (0.6 per cent), Queensland (0.5 per cent) and South Australia (0.3 per cent). Private sector house approvals rose in New South Wales (0.9 per cent).

In seasonally adjusted terms, total dwelling approvals decreased 2.9 per cent, with both total other residential dwelling approvals (3.4 per cent) and total houses (2.4 per cent) recording falls.

The value of total building approved rose 1.2 per cent in June, in trend terms, and has risen for six months. The value of residential building rose 0.1 per cent while non-residential building rose 3.7 per cent.

Inflation subdued in the June quarter 2016

The Consumer Price Index (CPI) rose 0.4 per cent in the June quarter 2016, according to the latest Australian Bureau of Statistics (ABS) figures.

The RBA will probably take this as a signal to cut the cash rate again next week, despite the fact that evidence is mounting that rate cutting at these low interest rate levels will not help much, and create a problem down the track. In fact we should ask if a 2-3% target for inflation is meaningful anymore. Worth reading Mark Carney, Governor, Bank of England comments on this subject. Low inflation appears to carry significant risks, and low interest rates do not help.

CPI-2016-JunThis follows a fall of 0.2 per cent in the March quarter 2016.

The most significant price rises this quarter are in medical and hospital services (+4.2 per cent), automotive fuel (+5.9 per cent) and tobacco (+2.1 per cent). These rises are partially offset by falls in domestic holiday travel and accommodation (–3.7 per cent), motor vehicles (–1.3 per cent) and telecommunication equipment and services (–1.5 per cent).

The increase of 4.2 per cent for medical and hospital services was driven by the annual increase in Private Health Insurance (PHI) premiums, which rise on 1 April every year.

The increase of 5.9 per cent for automotive fuel follows three consecutive quarterly falls, with the rise driven by increases in unleaded, premium and ethanol fuels, as world oil prices increased from a 12-year low last quarter.

The CPI rose 1.0 per cent through the year to the June quarter 2016. This is the weakest annual rise since the June quarter 1999.

There are interesting state variations, with Brisbane recording 1.5 per cent, and Darwin 0 per cent this time.

June-2106-State-CPI


ABS oversteps mark in demanding names in census

From IT Wire.

A former head of the Australian Bureau of Statistics, Bill McLennan, says the ABS has no authority to demand that people supply their names in the forthcoming census to be conducted in August.

McLennan, who helped rewrite the Census and Statistics Act in the 1980s, has written a paper for the Australian Privacy Foundation which appears to be the lone organisation campaigning against what seems to be an organisation that has gone mad.

The ABS made its unilateral move in December, issuing a statement that the mainstream media missed in toto, saying it had “decided to retain names and addresses collected in the 2016 Census of Population and Housing in order to enable a richer and dynamic statistical picture of Australia through the combination of census data with other survey and administrative data.”

Binary-PeopleIn his paper, McLennan says the ABS is collecting the names and addresses of all Australians and will retain that information “and will match the census records with various administrative records held by government (health, tax, New Start, social security, etc)”.

In other words, it is open slather for a government that has grown increasingly reluctant to tell the public anything about itself, while at the same time demanding more and more that the people reveal everything about themselves.

Over the last few years, we have seen the introduction of a draconian data retention act. We have also seen moves to collect biometric data that would enable facial recognition.

And now comes the ABS with its demand that we provide our names for the census.

As McLennan points out, this invasion of privacy could see many people provide incorrect information or else boycott the census altogether.

And this would mean that government, business, academic and other users, who rely on high-quality census data, would have data which was substantially inaccurate.

Secondly, the census data is used to determine the number of seats that each state has in the House of Representatives. If there are doubts about the accuracy of “the population counts coming from the 2016 Census, then this would be a very serious matter indeed, and it would be difficult to redress”.

McLennan points out that the public has not been consulted before making this change and the ABS has not bothered to tell people that the exact same change was proposed for the 2006 Census and then dropped after a damning privacy impact report by Nigel Waters, a privacy expert.

The Australian Labor Party, which always bends over backwards when any proposal that violates the privacy of Australians is mooted, has kept silent on this issue. This is not surprising. The Greens are silent too. So too, the champions of the masses like Nick Xenophon and Andrew Wilkie.

McLennan adds that the data collected by the ABS is done on a voluntary basis – and if anyone should know, he should.

As he points out, “by regulation, the ABS has prescribed ‘name’ as a topic on which statistical information may be collected and from which statistics may be produced. However, as far as I can determine, no statistics are planned to be produced from the Census about ‘name’. Therefore that statistical information, that is ‘name’, can’t be considered as being collected ‘for the purposes of taking the Census’.”

And, he concludes, “The ABS doesn’t have the authority to collect ‘name’ in the 2016 Census on a compulsory basis”.

Trend Unemployment Stable But…

Employment grew by 0.07 per cent in June, consistent with the average growth rate over the last six months, according to trend figures released by the Australian Bureau of Statistics (ABS) today.

The latest Labour Force data shows over the past month, trend employment increased by 8,300 persons to 11,933,400 persons. Trend full-time employment increased by 700 persons after falling for the previous four months. Part-time employment increased by 7,600 persons, its weakest monthly growth since August 2014.

“The figures show that hours worked by employed people declined, but not by as much as in previous months. This reflects the small increase in trend employment. We are yet to see an increase in hours worked in 2016,” said General Manager of the ABS’ Macroeconomic Statistics Division, Bruce Hockman.

The trend unemployment rate remained steady at 5.7 per cent. The participation rate also remained steady at 64.8 per cent.

“Trend series smooth the more volatile seasonally adjusted estimates and provide the best measure of the underlying behaviour of the labour market,” Mr Hockman said.

The seasonally adjusted number of persons employed increased by 7,900 in June 2016. The seasonally adjusted unemployment rate for June 2016 increased 0.1 percentage points to 5.8 per cent and the seasonally adjusted labour force participation rate increased by less than 0.1 percentage points to 64.9 per cent.

Investment Home Lending Is Where It Is At

The data from the ABS of lending finance for May 2016 shows an overall fall of 0.8% in borrowing flow of all types, or $885 million, compared with the previous month. Within this, there was a relative rise in the proportion of new loans for investment housing (16.% of all lending flows), whilst the relative proportion of lending to business, net of investment housing, fell, to 53.8% of all lending in the month, down from a maximum of 61% of all flows in Match 2015.

Trend-Lending-Flows-May-2016This is not a good outcome when lending to business can translate to productive growth, whilst lending for investment housing continues to stoke up home prices and bank balance sheets. No surprise the banks are cutting mortgage rates to try and attract more business, but at the expense of business lending.

The total value of owner occupied housing commitments excluding alterations and additions fell 0.6% in trend terms to $20.5 billion. Investment lending volumes, which are included in the business volumes, were similar to the previous month, showing a relative swing towards investment loans at $11.6 billion.

The trend series for the value of total personal finance commitments rose 0.9%, or $65 million to $7.3 billion. Revolving credit commitments rose 1.8% and fixed lending commitments rose 0.3%. The seasonally adjusted series for the value of total personal finance commitments fell 4.6%. Revolving credit commitments fell 7.8% and fixed lending commitments fell 2.3%. Households are borrowing more on personal credit, including making up the difference on deposits for housing, as lending criteria get tighter.

The trend series for the value of total commercial finance commitments fell 1.2% to $28.4 billion, net of investment housing. Revolving credit commitments and Fixed lending commitments both fell 1.2%. The seasonally adjusted series for the value of total commercial finance commitments fell 4.1%. Fixed lending commitments fell 4.4% and revolving credit commitments fell 3.2%.

The trend series for the value of total lease finance commitments fell 3.9% in May 2016 and the seasonally adjusted series fell 14.2%, following a fall of 0.6% in April 2016 to $517 million.