Residential Real Estate Now Worth $5.76 trillion

The ABS released their data on capital city house prices today, to June 2015.  Total property is now worth $5.76 trillion, reflecting recent significant price rises in Sydney and Melbourne. The number of dwelling rose to 9.53 million, and the average price was $604,700.

The capital city residential property price indexes rose in Sydney (+8.9%), Melbourne (+4.2%), Brisbane (+0.9%), Adelaide

The price index for residential properties for the weighted average of the eight capital cities rose 4.7% in the June quarter 2015. The index rose 9.8% through the year to the June quarter 2015.

(+0.5%) and Canberra (+0.8%), was flat in Hobart (0.0%) and fell in Perth (-0.9%) and Darwin (-0.8%).

Annually, residential property prices rose in Sydney (+18.9%), Melbourne (+7.8%), Brisbane (+2.9%), Canberra (+2.8%), Adelaide (+2.7%) and Hobart (+1.5%) and fell in Darwin (-1.8%) and Perth (-1.2%).

The total value of residential dwellings in Australia was $5,761,607.2m at the end of June quarter 2015, rising $271,939.1m over the quarter.

The mean price of residential dwellings rose $26,200 to $604,700 and the number of residential dwellings rose by 38,400 to 9,528,300 in the June quarter 2015.

Data indicates the recession is effectively here; it’s what policy makers do next that counts

From The Conversation.

The latest economic figures released by the Australian Bureau of Statistics (ABS) have fuelled the debate on the future of the Australian economy and prompted many to ask: “Will Australia go into a recession?”

This question is legitimate, but off the mark. In fact, the data tells us that we should not be worried about going into recession.

What we should worry about instead is how to get out of the recession. Because, like it or not, the recession is already here and the sooner we acknowledge the problem, the sooner we can start the recovery.

So, what does the data say?

According to ABS, trend Gross Domestic Product (GDP) growth in Australia in the second quarter of 2015 was 0.5%. This was only marginally below the rate observed in the first quarter of the year (0.6%). The implied annual growth rate of GDP is therefore around 2%.

While considerably below the long-term average of 3.25% a year, trend growth is still positive, which means that Australia is not technically in a recession.

Economists technically define a recession as a period of at least two consecutive quarters of negative GDP growth. This occurs rarely in an advanced economy like Australia.

The last time Australia was technically in recession was 24 years ago, when trend growth turned negative in the third quarter of 1990 and did not go back to positive until quarter four of 1991.

Before then, trend growth was negative for five quarters between 1982 and 1983, for two quarters in the middle of 1974, and for four quarters between 1960 and 1961.

However, while not being technically in a recession, Australia today shows most of the symptoms of recession.

Reload: what does the data say?

First of all, trend GDP is by construction smoothed. However, recessions (and expansions) are cyclical phenomena that are better represented by seasonally adjusted GDP.

In the second quarter of 2015, seasonally adjusted GDP in Australia grew by a mere 0.2%, sharply down from the first quarter when it grew by 0.9%. That is, seasonally adjusted data suggests that the country is much closer to the beginning of a technical recession.

Second, seasonally adjusted Gross Domestic Income (GDI) showed negative growth of -0.4%. This is particularly worrying because GDI is statistically more reliable than GDP as a predictor of the cyclical fluctuations of the economy.

Third, and probably even more importantly, indicators of an individual’s welfare are taking a turn for the worse. The second quarter of the year saw a negative growth in GDP per capita (-0.2%) and net national disposable income per capita (-1.2%).

These negative income dynamics add to persistently weak labour market performance.

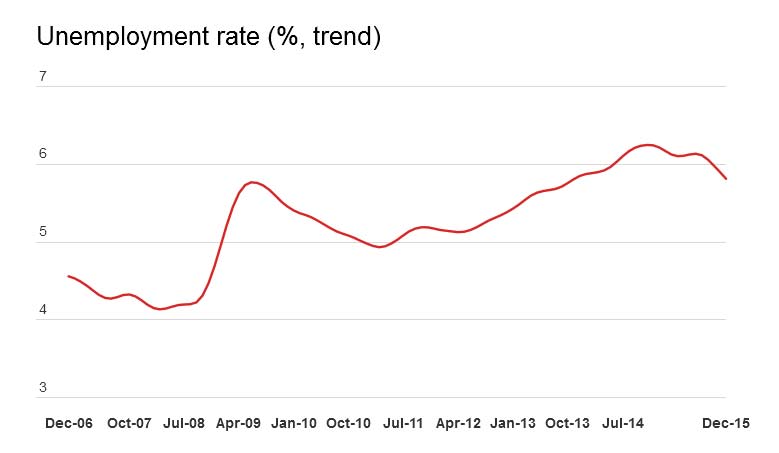
The ABS labour force survey shows that in July 2015, seasonally adjusted unemployment reached 795,500 units. This is the highest level since November 1994 and approximately 125,000 units higher than at the peak of the global financial crisis (June 2009). The corresponding unemployment rate was 6.3%.

In the same month of July 2015, youth unemployment increased to 13.8%. This was the first monthly increase since the beginning of the year.

Perhaps this is not technically a recession, but certainly it looks, smells, and feels a lot like one.

Intervention needed

The government, however, seems to be in denial.

Finance Minister Mathias Cormann is reportedly “very optimistic about the outlook moving forward”. Treasurer Joe Hockey recently said that “the Australian economy is showing a deep resilience that people in Canada and elsewhere would die for.”

Unfortunately, the fact that Canada is in a technical recession and other resource intensive countries are suffering from falls in commodity prices does not make the situation of Australia any better.

Conversely, the business sector seems to have understood the reality of the situation. This is evident, for instance, in the declining levels of business confidence and conditions reported by the NAB Monthly Business Survey of July 2015.

The good thing about recessions is that, generally, they end. The bad thing, instead, is that their effects are felt proportionally more by households at the bottom end of income distribution.

Another bad thing is that the consequences of a recession (in terms of unemployment, reduced welfare for instance) tend to outlive the recession itself.

For all these reasons, some form of intervention would be desirable; but how?

In Australia’s case, the empirical evidence clearly indicates that fiscal stimulus works: for each dollar spent by the government, GDP increases by more than one dollar.

In fact, already now, what has prevented the country from recording negative GDP growth is good old Keynesian spending.

Government final consumption grew by 2.2% in the second quarter of the year and 4% since the beginning of the year. Public gross fixed capital formation increased by 4% in the second quarter.

Without this extra public spending Australia would have probably experienced its first quarter of negative growth.

Certainly, Australia also has structural problems that condition its longer-term performance and that a fiscal stimulus will not solve.

But the stimulus will improve the short-term outlook, restore confidence, and create favourable socioeconomic conditions to undertake structural reforms.

To get there, however, an initial step is required: the government must get past its denial of the problem. Let’s hope that this happens sooner rather than later.

Author: Fabrizio Carmignani, Professor, Griffith Business School at Griffith University

Lending To End July 2015 – Investment Housing Still Strong

The ABS released their finance statistics to end July today. Investment housing flows made up 38.2% of all new fixed commercial lending in the month, and 29% of all new commercial lending. Overall lending for housing was more than 44% of all new bank lending in the month. Investment lending remains strong, and after recent bank’s loan reclassification, was higher than previously reported. The tightening of lending criteria for investment loans was yet to work through into meaningful outcomes.

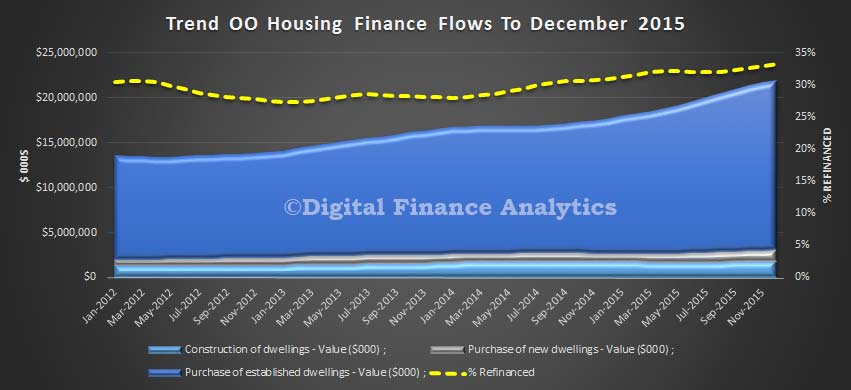
Secured lending for owner occupation, including refinance was $18.86 bn (up from $18.71 bn last month) . Owner occupied was $12.6bn (up from $12.5 bn in June) and refinancing was $6.20bn, (up from 6.15 last month).

Housing-Trends-to-July-2015Investment housing was $13.72 bn, (up from $13.69 bn last month), and other commercial lending was $22.22 bn, (down from $22.26 bn last month). Personal finance was $7.48 bn (down from $7.51 bn in June).

All-Finance-July-2015 The total value of owner occupied housing commitments excluding alterations and additions rose 0.8% in trend terms, and the seasonally adjusted series rose 2.2%.

The trend series for the value of total personal finance commitments fell 0.4%. Revolving credit commitments fell 1.0% and fixed lending commitments fell 0.1%. The seasonally adjusted series for the value of total personal finance commitments fell 2.6%. Fixed lending commitments fell 5.8%, while revolving credit commitments rose 2.6%.

The trend series for the value of total commercial finance commitments fell 1.2%. Revolving credit commitments fell 1.7% and fixed lending commitments fell 1.1%. The seasonally adjusted series for the value of total commercial finance commitments fell 2.7%. Revolving credit commitments fell 13.0%, while fixed lending commitments rose 0.9%.

The trend series for the value of total lease finance commitments fell 0.1% in July 2015 and the seasonally adjusted series rose 60.2%, following a rise of 2.8% in June 2015.

Australia’s Unemployment Rate Decreased to 6.2 per cent in August 2015

Australia’s estimated seasonally adjusted unemployment rate for August 2015 was 6.2 per cent, a decrease of 0.1 percentage points. In trend terms, the unemployment rate was unchanged at 6.2 per cent in August 2015, as announced by the Australian Bureau of Statistics (ABS) today.

The seasonally adjusted labour force participation rate decreased 0.1 percentage points to 65.0 per cent in the August 2015 estimate.

The ABS reported the number of people employed increased by 17,400 to 11,775,800 in August 2015 (seasonally adjusted). The increase in employment was driven by increases in male full-time employment, and female full-time and part-time employment, with the largest increase seen in full-time employment for males (up 10,100).

The ABS seasonally adjusted monthly hours worked in all jobs series decreased in August 2015, down 0.6 million hours to 1,623.8 million hours.

The seasonally adjusted number of people unemployed decreased by 14,400 to 781,100 in August 2015, the ABS reported.

The seasonally adjusted underemployment rate remained steady at 8.4 per cent in August 2015, from a revised May 2015 estimate. Combined with the unemployment rate, the latest seasonally adjusted estimate of total labour force underutilisation was unchanged at 14.3 per cent in August 2015, from a revised May 2015 estimate.

So, Is Housing Lending On The Turn?

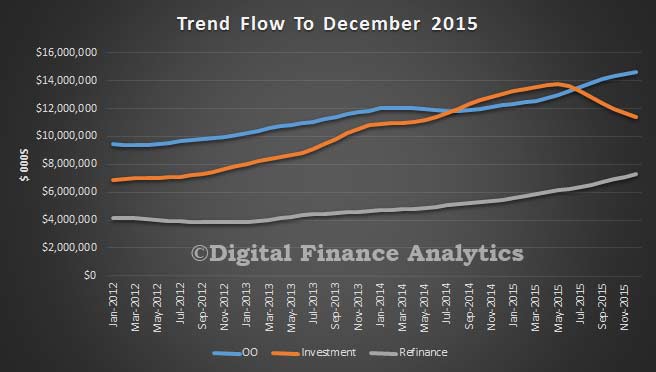
The ABS data on housing finance today suggests that the momentum in housing is shifting, as the tighter restrictions on investment lending bites; this despite strong market demand and the fact that investor property finance has never been higher at 38.9%.  Looking at the monthly flow trend data, lending overall rose 0.52% in the month, by $169 m. Within that, monthly approvals data shows that owner occupied lending rose 0.84% (up $105 m from last months approvals), refinancing up 0.72% ($44 m) and Investment lending up 0.14% ($19 m). In seasonally adjusted terms, the total value of dwelling finance commitments excluding alterations and additions rose 1.5%.

Housing-Flows-July-2015Within these numbers, we see that owner occupied construction fell 1% compared with last month, owner occupied new property purchases rose 2.24%, owner occupied refinance rose 0.72% and owner occupied “other” purchases rose 1%. On the investment side of the equation, investment purchases by individuals fell 0.47%, whilst investment construction rose 4.3% and investment by other entities (including SMSFs) rose 2%. Still momentum, but the investment sectors is shifting. We expect to see ongoing strong demand from the SMSF sector.

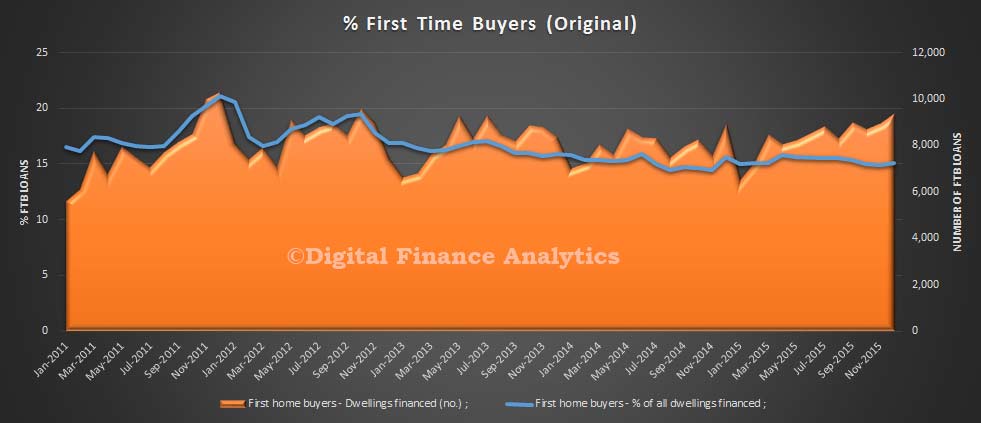
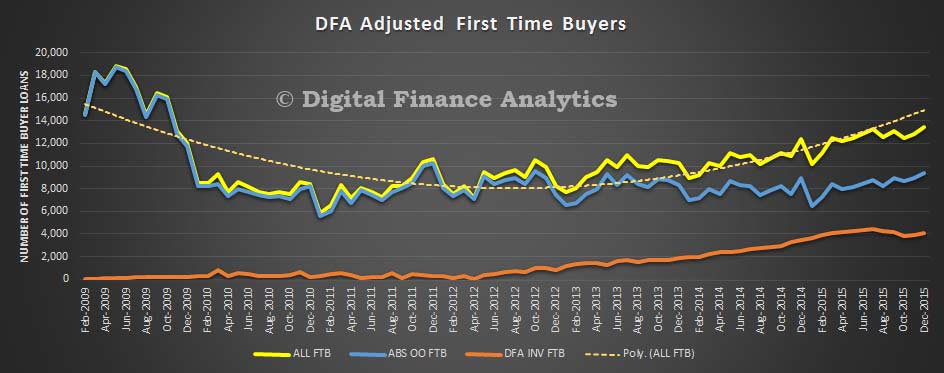
Housing-Flow-Movements-July-2015Looking at first time buyers, both the original data from the ABS, shows a small fall in the month to 15.4% in July 2015 from 15.8% in June 2015, and the DFA data for investor FTB also fell. The number of first time buyers are still sitting at around 12,000 a month in total, still well below the peaks in 2009. Our surveys indicate strong FTB investor appetite. The changed underwriting requirements however are having an impact.

FTB-Adjusted-July-2015Looking at the loan stock data, the major banks still have the lion’s share, but we see that on the investment side, credit unions grew their books the largest in percentage terms, with a 1.1% rise in investment loans (compared with a rise of 0.52% by the banks and 0.68% for the building societies).  We suspect some investors are switching to smaller banks, credit unions and the non-bank sector when they find the larger players less willing to lend. Overall growth on the owner occupied side was 0.43%.

Housing-Loan-Stocvk-By-Lender-Type-July-2015Finally, looking at the overall stock of loans, we see that investment loans now make up a record 38.9% of the total portfolio, thanks partly to the recent restatement of loan types by some the banks. We think this is too-higher share of housing lending (it is more risky in a down-turn) and the banks 60% total loan portfolio in housing is also too high, sucking finance from business sectors which might contribute to real economic growth.

Stock-Housing-Loans-July-2015

Middle Income Households Income Is Getting Squeezed

Data from the ABS looking at income and wealth, shows that the average income of high income households rose by 7 per cent between 2011-12 and 2013-14, to $2,037 per week, whist low income households have experienced an increase of around 3 per cent in average weekly household income compared with middle income households which have changed little since 2011-12.

The average income of all Australian households has risen to $998 per week in 2013–14, while average wealth remained relatively stable at $809,900. Similarly, change in average wealth was uneven across different types of households. For example, the average wealth of renting households was approximately $183,000 in 2013-14. Rising house prices contributed to an increase in the average wealth for home owners with a mortgage ($857,900) and without a mortgage (almost $1.4 million).

Most Australian households continue to have debts in 2013-14, with over 70 per cent of households servicing some form of debt, such as mortgages, car loans, student loans or credit cards. For example, the average credit card debt for all households was $2,700.

One quarter of households with debt had a total debt of three or more times their annualised disposable income. Mortgage debt was much higher

These households are considered to be at higher risk of experiencing economic hardship if they were to experience a financial shock, such as a sudden reduction in their income or if interest rates were to rise, increasing their mortgage or loan repayments.

The survey findings also allow comparisons of income and wealth across different types of households.

In 2013–14, couple families with dependent children had an average household income of $1,011 per week, which was similar to the average for all households at $998 per week.

By comparison, after adjusting for household characteristics, one parent families with dependent children had an average household income of $687 per week.

Retail Trade Down 0.1% SA in July, Though Trend Higher

The latest Australian Bureau of Statistics (ABS) Retail Trade figures show that Australian retail turnover fell 0.1 per cent in July 2015 following a rise of 0.6 per cent in June 2015, seasonally adjusted.

The less volatile trend estimate for Australian retail turnover rose 0.2 per cent in July 2015 following a 0.3 per cent rise in June 2015. The trend estimate rose 4.4 per cent compared to July 2014.

In seasonally adjusted terms there were rises in clothing, footwear and personal accessory retailing (2.9 per cent), department stores (1.3 per cent) and cafes, restaurants and takeaway food services (0.3 per cent). Food retailing (0.0 per cent) was relatively unchanged. There were falls in household goods retailing (-1.9 per cent) and other retailing (-0.6 per cent) following rises in both industries in June.

In seasonally adjusted terms there were rises in Queensland (0.3 per cent), Western Australia (0.3 per cent) and the Northern Territory (0.1 per cent). Tasmania was relatively unchanged (0.0 per cent). There were falls in New South Wales (-0.2 per cent), South Australia (-0.8 per cent), Victoria (-0.2 per cent) and the Australian Capital Territory (-0.2 per cent).

Online retail turnover contributed 3.1 per cent to total retail turnover in original terms.

GDP Below Expectations At 0.2% SA In June

The ABS released their data today showing that in the June 2015 quarter national accounts, growth in the Australian economy slowing to 0.2% in seasonally adjusted chain volume terms and 2% over the past year. It was 0.5% in trend terms, our preferred measure (given recent statistical volatility), making an annual rate of 2.2%.

GDP-Trend-June-2015The ABS showed that reduced Mining and Construction activity, coupled with a decline in Exports were the main factors to the slowdown in economic growth. Positive contributions came from Domestic final demand, and the Financial, Transport and Health industries. Mining production fell significantly this quarter (-3.0%), although it is still positive through the year with growth at 2.1%. The decline in Mining production coincides with the fall in Exports. Net exports detracted 0.6 percentage points from GDP growth in the quarter, through the year they added 1.1 percentage points to GDP growth. This quarter continues to see the decline in mining related construction (Engineering construction -0.8%), which is reflected in the decline in Construction Gross value added (-0.6%).

There was positive growth in Domestic final demand with Household final consumption growing 0.5% this quarter and 2.5% through the year. Government final consumption had growth of 2.2% for the quarter and 4.0% through the year. Public gross fixed capital formation was up 4.0% for the June 2015 quarter, but remains subdued through the year with growth at 0.4%.


Building Approvals Fell 0.7% In July

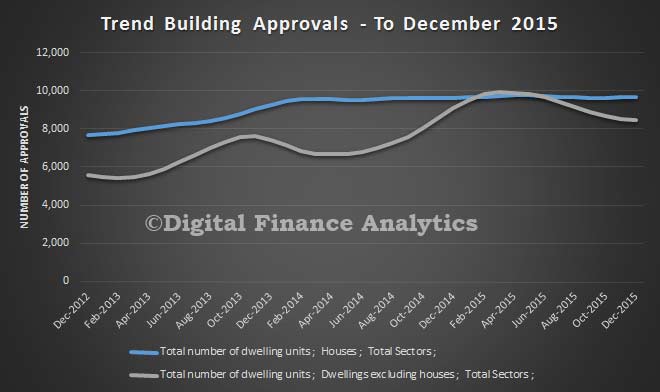
The Australian Bureau of Statistics (ABS) Building Approvals show that the number of dwellings approved fell 0.7 per cent in July 2015, in trend terms, and has fallen for five months.

Dwelling approvals decreased in July in Tasmania (5.6 per cent), Victoria (3.1 per cent), South Australia (2.1 per cent), Western Australia (1.8 per cent) and Queensland (0.8 per cent) but increased in the Northern Territory (7.3 per cent), Australian Capital Territory (4.4 per cent) and New South Wales (1.9 per cent) in trend terms.

BuildingApprovalsJuly2015BySTate
In trend terms, approvals for private sector houses fell 0.5 per cent in July. Private sector house approvals fell in Western Australia (2.3 per cent), Victoria (1.5 per cent) and South Australia (1.4 per cent) but rose in Queensland (1.2 per cent) and New South Wales (0.8 per cent).

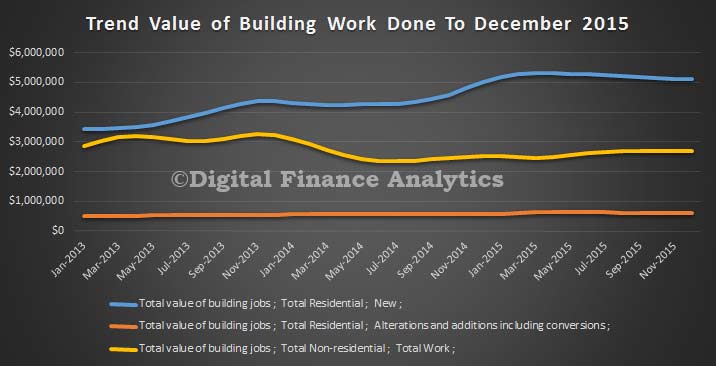
The value of total building approved rose 0.6 per cent in July, in trend terms, and has risen for three months. The value of residential building fell 0.4 per cent while non-residential building rose 2.9 per cent in trend terms.

Value of Managed Funds Fell in June 2015 Quarter

The ABS released their data on the managed funds industry. It shows the impact of recent falls in stocks, and exchange rate movements. At 30 June 2015, the managed funds industry had $2,622.2b funds under management, a decrease of $21.2b (1%) on the March quarter 2015 figure of $2,643.4b. The main valuation effects that occurred during the June quarter 2015 were as follows: the S&P/ASX 200 decreased 7.3%; the price of foreign shares, as represented by the MSCI World Index excluding Australia, decreased 0.1%; and the A$ appreciated 0.6% against the US$.

Managed-Funds-June-2015 At 30 June 2015, the consolidated assets of managed funds institutions were $2,059.9b, a decrease of $18.6b (1%) on the March quarter 2015 figure of $2,078.6b. The asset types that decreased were shares, $29.6b (5%); units in trusts, $4.0b (2%); overseas assets, $2.7b (1%); derivatives, $0.3b (10%) and other non-financial assets, $0.3b (2%). These were partially offset by increases in other financial assets, $7.2b (24%); land, buildings and equipment, $4.1b (2%); short term securities, $2.6b (3%); loans and placements, $2.4b (5%); deposits, $1.3b (0%) and bonds, etc., $0.6b (1%).

Managed-Funds-By-Type-June-2015At 30 June 2015, there were $534.3b of assets cross invested between managed funds institutions. At 30 June 2015, the unconsolidated assets of Superannuation (pension) funds decreased $25.8b (1%), life insurance corporations decreased $6.5b (2%); friendly societies decreased $0.1b (2%) and common funds decreased $0.1b (1%). Cash management trusts increased $1.4b (4%) and public offer (retail) unit trusts increased $1.0b (0%).