Retail Trade Trend Up 0.3% In April

The latest Australian Bureau of Statistics (ABS) Retail Trade figures show that Australian retail turnover was relatively unchanged in April (0.0 per cent) following a rise of 0.2 per cent in March 2015, seasonally adjusted. In monthly terms the trend estimate for Australian retail turnover rose 0.3 per cent in April 2015 following a 0.3 per cent rise in March 2015. Though the seasonally adjusted result was relatively unchanged this month, the trend result for April 2015 is up 4.4 per cent compared to April 2014.

In seasonally adjusted terms there were rises in cafes, restaurants and takeaway food services (0.8 per cent) and clothing, footwear and personal accessory retailing (1.3 per cent). Household goods retailing was relatively unchanged (0.0 per cent). There were falls in other retailing (-1.0 per cent), food retailing (-0.1 per cent) and department stores (-0.7 per cent).

In seasonally adjusted terms there were rises in Victoria (0.5 per cent), the Australian Capital Territory (0.6 per cent), South Australia (0.1 per cent) and the Northern Territory (0.1 per cent). New South Wales was relatively unchanged (0.0 per cent). There were falls in Queensland (-0.6 per cent), Tasmania (-0.9 per cent) and Western Australia (-0.1 per cent).

Online retail turnover contributed 3.0 per cent to total retail turnover in original terms.

GDP Beats Expectations In March Quarter

Latest Australian Bureau of Statistics (ABS) figures show that GDP, in seasonally adjusted chain volume terms, grew 0.9 per cent in the March quarter 2015. The consensus expectation was 0.7%.

GDPMar2015Chain

Trend GDP growth was 0.6% in the last quarter, making an annual 2.2%.

GDPMarch2015Annual Net exports contributed 0.5 percentage points to GDP growth. Household final consumption expenditure and Changes in inventories each contributed 0.3 percentage points to GDP growth. This was offset by a -0.3 percentage point contribution from Gross fixed capital formation.

The industries which drove GDP growth in the March quarter were Mining and Financial and insurance services. Mining contributed 0.3 percentage points and Financial and insurance services contributed 0.2 percentage points.

The March quarter saw the Terms of trade decrease 2.9 per cent in seasonally adjusted terms.


Building Approvals Down In April – ABS

Australian Bureau of Statistics (ABS) Building Approvals show that the number of dwellings approved fell 0.4 per cent in April 2015, in trend terms, after rising for ten months. Whilst the number of houses approved rose, we still see a hike in the volume of high-rise developments.

Dwelling approvals decreased in April in the Northern Territory (6.2 per cent), South Australia (2.3 per cent), Victoria (0.8 per cent), Queensland (0.8 per cent) and Western Australia (0.6 per cent) but increased in the Australian Capital Territory (8.4 per cent), Tasmania (4.3 per cent) and New South Wales (0.1 per cent) in trend terms.

ApprovalsApril2015States In trend terms, approvals for private sector houses rose 1.1 per cent in April. Private sector house approvals rose in New South Wales (2.8 per cent), South Australia (2.0 per cent), Victoria (0.8 per cent) and Western Australia (0.8 per cent) but fell in Queensland (0.5 per cent). This was the largest rise since 2010.

ApprovalsApril2015HousesHowever, we continue to see a steady rise in the relative proportion of high-rise dwelling approvals.

ApprovalsApril2015TypePC The value of total building approved fell 1.0 per cent in April, in trend terms, and has fallen for two months. The value of residential building fell 0.1 per cent while non-residential building fell 3.3 per cent in trend terms.

Re-balancing Unbalanced

Data from the ABS yesterday and today together sum up the problem with the Australian economy. Yesterday we got the latest construction data showing that mining was dropping, and construction, especially residential construction, was up, but not enough to compensate, so the overall trend is a fall in activity. The trend estimate for total construction work done fell 1.8% in the March quarter 2015. The trend estimate for non-residential building work done rose 0.2%, while residential building work rose 3.1%. The trend estimate for engineering work done fell 4.7% in the March quarter.

ConstructionMarch2015Today we got data on private sector capex. The trend volume estimate for total new capital expenditure fell 2.3% in the March quarter 2015, the trend volume estimate for buildings and structures fell 3.7% in the March quarter 2015 and the trend volume estimate for equipment, plant and machinery rose 0.7% in the March quarter 2015. Forward looking capital expenditure (a dodgy data set by definition) shows the same trend, mining falling away quicker then other part of the economy, including construction and manufacturing not filling the gap, so net trend is down.

ExpenditeMarch2015 The painful process of re balancing away from mining is unbalanced, and we do not think the gap will be closed by a combination of residential construction, and household spending. Further rate cuts won’t do much more to assist either. It is time for a concerted look at how to drive business harder, to make productive investments in future growth. This should be a time to drive public sector construction programmes harder. Otherwise, GDP will be weaker into 2017 than the budget base case suggests.

Managed Funds Up By 5% To $2.6 Trillion At March 2015

The ABS data today shows further substantial growth in managed funds. At 31 March 2015, the managed funds industry had $2,618.7b funds under management, an increase of $114.2b (5%) on the December quarter 2014 figure of $2,504.5b.

The main valuation effects that occurred during the March quarter 2015 were as follows: the S&P/ASX 200 increased 8.9%; the price of foreign shares, as represented by the MSCI World Index excluding Australia, increased 1.8%; and the A$ depreciated 6.9% against the US$.

At 31 March 2015, the consolidated assets of managed funds institutions were $2,073.0b, an increase of $100.3b (5%) on the December quarter 2014 figure of $1,972.7b.

ManagedFundsTrendsMar2015 The asset types that increased were shares, $45.8b (8%); overseas assets, $34.2b (8%); units in trusts, $10.8b (5%); other financial assets, $3.4b (13%); short term securities, $3.3b (4%); bonds, etc., $2.9b (3%); land, buildings and equipment, $2.7b (1%); loans and placements, $0.9b (2%); and derivatives, $0.7b (34%). These were partially offset by decreases in deposits, $4.3b (2%); and other non-financial assets, $0.1b (1%). The chart below shows the unconsolidated mix at end March 2015.

ManagedFundsSplitsMar2015At 31 March 2015, there were $536.7b of assets cross invested between managed funds institutions. At 31 March 2015, the unconsolidated assets of superannuation (pension) funds increased $106.2b (6%), life insurance corporations increased $14.3b (5%), public offer (retail) unit trusts increased $8.9b (3%), cash management trusts increased $1.4b (6%), friendly societies increased $0.2b (2%), and common funds increased $0.1b (1%).

Securitisation Of Mortgages On The Rise

The ABS released their latest statistics on the asset and liabilities of Australian securitiers to March 2015. We saw a rise in mortgage back securitisation, and a rise in issuance to Australian investors. At 31 March 2015, total assets of Australian securitisers were $140.0b, up $3.5b (2.6%) on 31 December 2014. During the March quarter 2015, the rise in total assets was due to an increase in residential mortgage assets (up $3.1b, 2.8%) and other loans (up $0.9b, 5.9%). This was partially offset by decreases in cash and deposits (down $0.4b, 9.8%). Residential and non-residential mortgage assets, which accounted for 83.1% of total assets, were $116.4b at 31 March 2015, an increase of $3.1b (2.7%) during the quarter. SecuritiserAssetsMar2015At 31 March 2015, total liabilities of Australian securitisers were $140.0b, up $3.5b (2.6%) on 31 December 2014. The rise in total liabilities was due to the increase in long term asset backed securities issued in Australia (up $4.1b, 3.9%) and loans and placements (up $0.7b, 3.5%). This was partially offset by a decrease in short term asset backed securities issued in Australia (down $0.6b, 18.8%) and asset backed securities issued overseas (down $0.3b, 3.2%). At 31 March 2015, asset backed securities issued overseas as a proportion of total liabilities decreased to 6.6%, down 0.4% on the December quarter 2014 proportion of 7.0%. Asset backed securities issued in Australia as a proportion of total liabilities increased to 78.2%, up 0.5% on the December quarter 2014 proportion of 77.7%.

SecuritisersLiabilitiesMarch2015This data relates to all Special Purpose Vehicles (SPVs) which securitise any type of asset (including mortgages, credit card receivables, lease receivables, short and long term debt securities) and which are not regulated or registered with APRA and therefore are not required to report to APRA under the Financial Statistics (Collection of Data) Act. Coverage is limited to those SPVs which are independently rated by a recognised rating agency. Internal securitisation is excluded from this survey. Internal securitisation, also referred to as self-securitisation, is a process in which an originator sells a pool of assets to a related special purpose vehicle (SPV), and the SPV in turn issues debt securities, which are held entirely by the originator. These securities are eligible for use as collateral in repurchase agreements (repos) with the Reserve Bank of Australia (RBA).

Note that revisions have been made to the original series as a result of the receipt of revised survey data. These revisions have impacted the assets and liabilities reported back to and including the September 2013 quarter.


Sales Of New Motor Vehicles In April

The ABS released the April 2015 sales today. Hard to read the data, as there are some significant variations between the trend estimate and the seasonally adjusted figures, though on both measures Sport Utilities continued to shine.

The trend estimate (our preferred view)  for April 2015 was 95 288, an increased by 0.5% when compared with March 2015. This was the highest April result on record. When comparing national trend estimates for April 2015 with March 2015, sales of Sports utility and Other vehicles increased by 1.9% and 0.1% respectively. Over the same period, Passenger vehicles decreased by 0.4%.

VehicleSalesTypesApril2015 Seven of the eight states and territories experienced an increase in new motor vehicle sales when comparing April 2015 with March 2015. Tasmania recorded the largest percentage increase (1.6%), followed by Queensland (1.1%) and the Northern Territory (0.9%). Over the same period, Western Australia was the only jurisdiction to record a decrease in sales (0.1%).

VehicleSalesStatesApril2015Turning to the seasonally adjusted estimates, the April 2015 seasonally adjusted estimate (94 888) has decreased by 1.5% when compared with March 2015. When comparing seasonally adjusted estimates for April 2015 with March 2015 sales of Passenger and Other vehicles decreased by 8.3% and 0.6% respectively. Over the same period, Sports utility vehicles increased by 7.4%.

Five of the states and territories experienced a decrease in new motor vehicle sales when comparing April 2015 with March 2015. The Australian Capital Territory recorded the largest percentage decrease (6.1%) followed by Queensland (4.8%) and Western Australia (2.8%). Over the same period, the Northern Territory recorded the largest increase in sales (3.2%).

Lending Up Thanks To Housing and Commercial, In March – ABS

The ABS released the Lending Finance data for March 2015 today. Comparing March with February, Housing for owner occupation excluding alterations and additions rose 0.8% in trend terms, and the seasonally adjusted series rose 1.6%. The trend series for the value of total personal finance commitments rose 0.3% although the seasonally adjusted series fell 0.9%. The trend series for the value of total commercial finance commitments rose 2.0% whilst the seasonally adjusted series rose 0.4%. The trend series for the value of total lease finance commitments rose 1.4% in March 2015 and the seasonally adjusted series rose 3.0%, following a rise of 3.6% in February 2015.

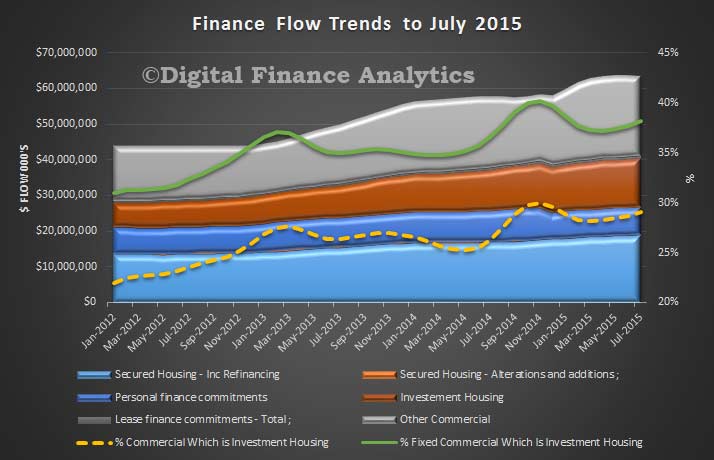
Looking at all lending, 43% was for residential property – including investment property loans, and we see a slight downward drift, as lending for other business purposed improved a little.

LendingFlowsByTypeMarch2105Looking at all commercial lending (fixed and revolving), we see that 28.8% was for residential investment property purchases, down from a high of 29.9% at the end of last year. This again shows that non-residential property lending to business lifted a little, and could suggest investment lending growth may be slowing a tad. However, investment lending remains at unprecedented levels.

InvestmentLendingAsShareofCommercialMarch2015To reinforce this view, we can compare the proportion of all commercial fixed term loans to those relating to housing investment.

InvestmentLendingAsShareofAllFixedCommercialLoansMarch2015The point we make again is that lending for investment property, whilst inflating house prices and bank balance sheets is unproductive. We need more lending to productive businesses to sustain growth, but the banks are finding it easier and more profitable to extend credit to investors, thanks to lower loss experience and capital benefits. This continues to be a significant structural problem, which needs to be addressed.


Pay Rises Slacken Further

The latest ABS data shows that to March 2015 pay increase momentum slackened further. The trend index and the seasonally adjusted index for Australia rose 0.5% in the March quarter 2015. The Private sector rose 0.4% seasonally adjusted, and the Public sector rose 0.5%.

PayMarch2015TrendsThe trend was similar across the states, other than in TAS.

PayOrignbalStatesMarch2015 The rises in indexes at the industry level (in original terms) ranged from 0.1% for Administrative and support services to 1.0% for Education and training.

The trend and seasonally adjusted indexes for Australia both rose 2.3% through the year to the March quarter 2015. Rises in the original indexes through the year to the March quarter 2015 at the industry level ranged from 1.6% for Professional, scientific and technical services to 2.8% for Education and training.  Given that core inflation is running at 2.4%, in real terms many households are going backwards.

CPICoreApril2015

It is worth comparing the trends now and in the early 2000’s. We see that incomes were rising faster then, and though house prices rose quite strongly, the growth profile was different. We know that many households got out of jail thanks to lower interest rates AND rising real incomes. This time, house prices and rising strongly (especially in some centers) but incomes are going backwards. If and when interest rates start to rise, this will lead to a world of pain.

INcomeandHousePricesMarch2015


Investor Loans Still Hot – ABS

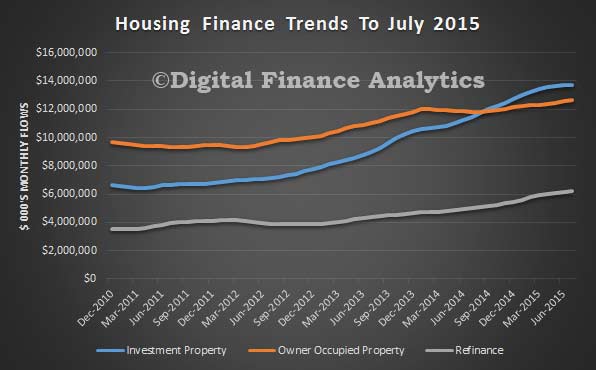
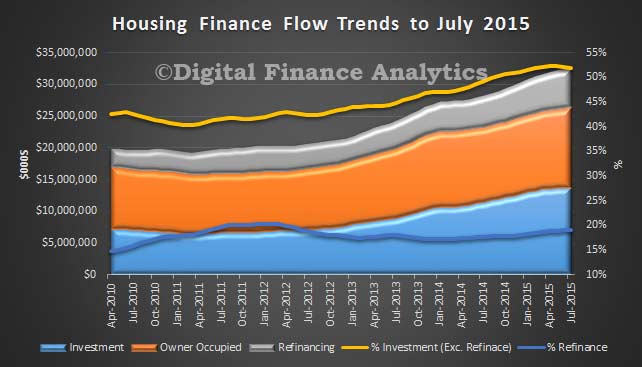
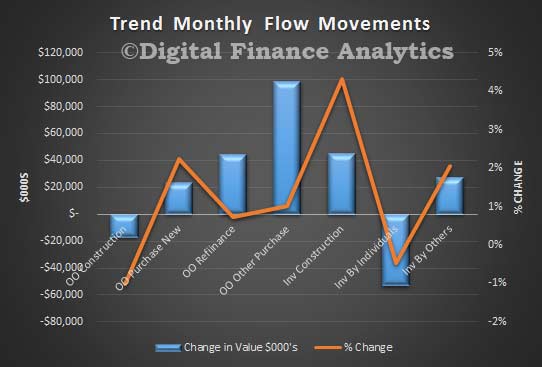
The ABS released their housing finance data to March 2015. Pretty common story, with the trend estimate for the total value of dwelling finance commitments excluding alterations and additions rising 0.8%. Owner occupied housing commitments rose 0.8% and investment housing commitments rose 0.8%.  In trend terms, the number of commitments for owner occupied housing finance rose 0.4% in March 2015.

In trend terms, the number of commitments for the purchase of established dwellings rose 0.7%, while the number of commitments for the construction of dwellings fell 1.4% and the number of commitments for the purchase of new dwellings fell 0.1%. The growth in investor property loans continued, with more than half in March (excluding refinance). Refinancing also grew in value and in percentage terms, from 18% of all loans a year ago, to over 20%, stimulated by ultra low rates.

Housing-FinanceMarch2015Looking at the First Time Buyer data, in original terms, WA had the highest share of FTB, and NSW the lowest.

FTBCountByStateMarch2015The percentage of FTB compared with all dwellings is relatively static.

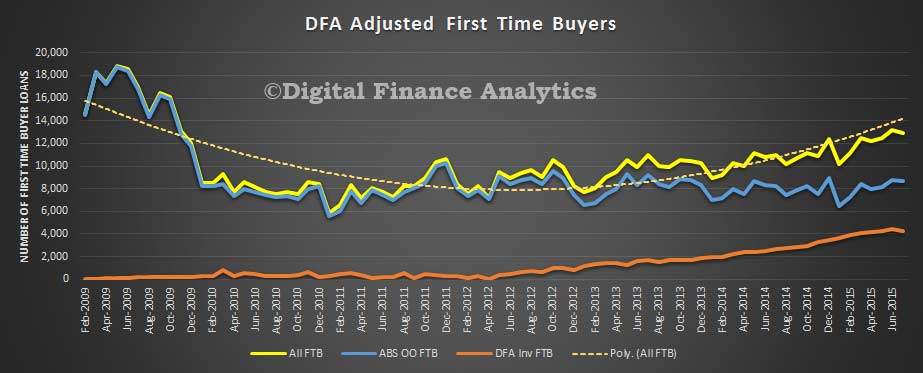
FTBMarch2015However, if we overlay the DFA survey data on first time buyers who are going straight to investment property, this continues to rise, and pushes the true number of FTB higher. We continue to see a rotation away from owner occupation to investor first time buyers.

All-FTBMarch2015