March Building Approvals Up By 1.8%

The ABS released the Building Approvals data to March 2015. In trend terms, the number of approvals was 19,333, up 1.8% on last month, and 18.2% from last year. The count has risen for 10 months. The trend estimate for private sector houses approved rose 0.2% in March and has risen for four months. The trend estimate for private sector dwellings excluding houses rose 3.6% in March and has risen for 10 months.

The value of residential building rose 2.5% and has risen for 12 months. The value of non-residential building fell 2.8% and has fallen for four months.  As the resource sector packs up its building tools, some are being applied to the residential sector.

However, it is the state by state date which really highlights the true “state” of play. In NSW, we see a strong pickup in unit approvals, driven by investment property demand and high residential prices.

NSW-Building-Approvals-March-2015Compare this with WA, where, as the resource boom slides into the dust, approvals are down for both units and houses, though we see the mix is strongly aligned towards houses rather than units.

WABuildingApprovalsMarch2015In SA, approvals are falling, and only a small number of approvals are for units.

SABuildingApprovalsMarch2015In QLD, we see momentum in units, whilst approvals for houses has fallen a little.

QLDBuildingApprovalsMarch2015Finally, in VIC. momentum is positive, and both houses and apartments are up, with slightly more than half being for units.

VIC-Building-Approvals-March-2015


Unemployment Rate Increased Slightly To 6.2% in April 2015

The ABS data for April 2015 employment was released today.  Australia’s estimated seasonally adjusted unemployment rate for April 2015 increased 0.1 percentage points to 6.2 per cent, compared with 6.1 per cent for March 2015. In trend terms, the unemployment rate decreased by less than 0.1 percentage points to 6.1 per cent. The seasonally adjusted labour force participation rate remained steady at 64.8 per cent in April 2015.

The ABS reported the number of people employed decreased by 2,900 to 11,724,600 in April 2015 (seasonally adjusted). The decrease in employment was driven by decreases in full-time employment for males (down 47,900) and part-time employment for females (down 10,700). These were offset by increases in male part-time employment (up 29,700) and female full-time employment (up 26,000).

The ABS seasonally adjusted aggregate monthly hours worked series increased in April 2015, up 17.8 million hours (1.1 per cent) to 1,651.9 million hours. The seasonally adjusted number of people unemployed increased by 7,000 to 769,500 in April 2015. This was driven by people who looked for part-time work only, which increased by 9,800 to 228,000.

Retail Sales Growth Slows In March

The latest Australian Bureau of Statistics (ABS) Retail Trade figures show that Australian retail turnover rose 0.3 per cent in March following a rise of 0.7 per cent in February 2015, seasonally adjusted.

In seasonally adjusted terms the largest contributor to the rise was department stores (3.8 per cent), clothing, footwear and personal accessory retailing (2.2 per cent), food retailing (0.4 per cent) and other retailing (0.1 per cent). There were falls in household goods retailing (-1.0 per cent) and cafes, restaurants and takeaway food services (-1.1 per cent).

In seasonally adjusted terms there were rises in Queensland (0.7 per cent), New South Wales (0.3 per cent), Victoria (0.2 per cent), South Australia (0.3 per cent) and Tasmania (0.5 per cent). There were falls in Western Australia (-0.3 per cent), the Australian Capital Territory (-0.5%) and the Northern Territory (-0.8 per cent).

The trend estimate for Australian retail turnover rose 0.3 per cent in March 2015 following a 0.4 per cent rise in February 2015. Through the year, the trend estimate rose 4.3 per cent in March 2015 compared to March 2014.

Online retail turnover contributed 3.0 per cent to total retail turnover in original terms.

Building Approvals Up Again, Especially Units In NSW

Australian Bureau of Statistics (ABS) Building Approvals show that the number of dwellings approved rose 1.8 per cent in March 2015, in trend terms, and has risen for ten months. This continued strength was driven by increases in new flats, units or apartments in residential buildings.

The value of total building approved rose 0.9 per cent in March, in trend terms, and has risen for nine months. The value of residential building rose 2.5 per cent while non-residential building fell 2.8 per cent in trend terms.

Building-Approvals-March-2015
The number of dwelling approvals increased in March in New South Wales (4.4 per cent), Tasmania (3.3 per cent), Queensland (3.0 per cent) and Victoria (1.2 per cent) but decreased in Northern Territory (14.6 per cent), Australian Capital Territory (3.8 per cent), Western Australia (1.9 per cent) and South Australia (1.7 per cent) in trend terms.

There are significant state variations with regards to the proportion of approvals relating to houses, lowest in the Sydney region.

Houses-By-state-Mar-2015In trend terms, approvals for private sector houses rose 0.2 per cent in March. Private sector houses rose in New South Wales (1.8 per cent) and Victoria (1.1 per cent) but fell in South Australia (1.3 per cent), Western Australia (1.3 per cent) and Queensland (0.9 per cent).

The trend value of residential building rose 2.5% and has risen for 12 months. The value of non-residential building fell 2.8% and has fallen for four months.  The 6 month average value moments highlights the state variations, with NSW hot, and WA coming off.

Building-Value-By-State-March-2015

ABS Tweaks First Time Buyer Data Again

The ABS released updated data for housing finance for February 2015 today. As a result the number of first time buyers in the data changed a little. The chart below shows the variation on a monthly basis between the latest revisions, and the earlier figures. They warn that further changes should be expected. The net impact is a fall in the count of first time buyer loans written. The total number of loans recorded does not change.

FTB-Adjustment-Feb-2015

From the December 2014 issue, the ABS changed its method of estimating loans to first home buyers by adjusting for under-reporting by some lenders that only report on those buyers receiving a first home owner grant. Data on first home buyers are collected by the Australian Prudential Regulation Authority (APRA) under the Financial Sector (Collection of Data) Act 2001. The ABS and APRA continue to work with lenders to ensure that loans to all first home buyers are identified in future, regardless of whether or not buyers receive a first home owner grant.

The model developed by the ABS for lenders who are under-reporting loans to first home buyers draws on the ratio of first home buyers to total loans for those lenders reporting correctly. The new estimation  method will continue to be used in future releases. Monthly First Home Buyer Statistics are likely to be subject to future revision, as the modelled component is adjusted to reflect improved reporting by lenders.

The information paper Changes to the method of estimating loan commitments to first home buyers (cat. no. 5609.0.55.003), released on the ABS website on 4 February 2015, describes the new methodology and the extent of revisions to previously published estimates.

Core CPI Right In RBA Target Range

The Consumer Price Index (CPI) rose 0.2 per cent in the March quarter 2015, following a rise of 0.2 per cent in the December quarter 2014, according to data released by the Australian Bureau of Statistics (ABS) today. The CPI rose 1.3 per cent through the year to the March quarter 2015, following a rise of 1.7 per cent through the year to the December quarter 2014. The reading is flattered by a significant fall in fuel.

The underlying rate was 2.4%, right within the RBA target range, a little higher than expected, and as such it will more than likely tip the RBA in “hold” territory next month, when coupled with better than expected previous employment data, and hot Sydney property. Moreover, little evidence that a further cut would change the picture much (other than reducing savers ability to spend).

CPICoreApril2015
The most significant price rises this quarter were in domestic holiday travel and accommodation (+3.5 per cent), tertiary education (+5.7 per cent) and medical and hospital services (+2.2 per cent), These rises were partially offset by falls in automotive fuel (—12.2 per cent) and fruit (—8.0 per cent). The decrease in fuel was registered in all fuel types with the quarterly fall the largest since December 2008 and over the twelve months to March 2015, automotive fuel has decreased by 22.5 per cent. This is the largest yearly fall in the history of the series, beginning in September 1973.

Unemployment Trend Unchanged At 6.2%

The ABS data shows that Australia’s estimated seasonally adjusted unemployment rate for March 2015 was 6.1 per cent, compared with a revised 6.2 per cent for February 2015. This represented a decrease of less than 0.1 percentage points. In trend terms, the unemployment rate was unchanged at 6.2 per cent.

The seasonally adjusted labour force participation rate increased to 64.8 per cent in March 2015 from 64.7 per cent in February 2015. The ABS reported the number of people employed increased by 37,700 to 11,720,300 in March 2015 (seasonally adjusted). The increase in employment was driven by increases in full-time employment for both males (up 24,800) and females (up 6,700).  The ABS seasonally adjusted aggregate monthly hours worked series increased in March 2015, up 4.8 million hours (0.3 per cent) to 1,630.4 million hours. The seasonally adjusted number of people unemployed decreased by 1,500 to 764,500 in March 2015.

Expectations were of a rise to 6.3 or 6.4 percent, and some analysts were expecting the rise to make a case for the RBA to cut the cash rate again in May. The data may suggest otherwise.

Building Activity Slows

The ABS released the Building Activity data to December 2014. Overall, the trend estimate of the value of total building work done fell 0.2% in the December 2014 quarter.  This is despite the estimate of the value of new residential building work done rising 1.0% in the December quarter and the value of work done on new houses rose 0.3% while new other residential building rose 1.9%. Construction for units therefore helped prop up the numbers. This is because the trend estimate of the value of non-residential building work done fell 1.4% in the December quarter.

Looking at the quarter on quarter trend estimate changes, we see a drift downward since mid last year. Momentum in NSW based on value of work done fell furthest. Residential construction cannot replace the decline in other sectors.

BuildingWorkDoneDec2014

Lending Finance Tops Out?

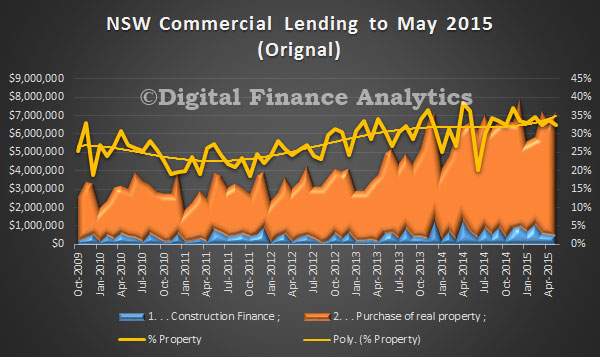
The ABS data today provides an insight into the various categories of Finance to February 2015. The total value of owner occupied housing commitments excluding alterations and additions rose 1.0% in trend terms, whilst the value of total personal finance commitments fell 0.1%. The value of total personal finance commitments fell 0.2%. The trend series for the value of total commercial finance commitments rose 2.9%. Revolving credit commitments rose 4.8% and fixed lending commitments rose 2.1%. So, we see a rise in commercial lending (which of course includes investment property lending.) The rate of momentum in housing lending on the other hand appears to be slowing somewhat.

LendingFinanceFeb2015Looking at the relative share of investment property lending, we see it has turned down from a peak of 30.3% of all commercial lending to just of 29%, but still high compared with 2011. Banks are still preferring to lend for housing, though we are seeing a rise in commercial lending which is not property aligned – this is to be welcomed, and we need to see more, as productive lending to business will translated into real economic growth, whilst lending for property purchase inflates house prices, bank balance sheets, and household net wealth in book value terms.

COmmercialFinanceandPropertyFeb2015Turning to housing lending, values still rising and a total of $31 billion was lent for property across all categories in the month. This is a record.

HousingFinanceFeb2015Looking at the mix, 38% was for investment housing, 30% for owner occupation, and 20% for refinance.

LendingMixFeb2015We see that just of 50% of secured loans (excluding refinance) were for investment purposes. Refinance was high, in response to the RBA rate cut in February.

HousingLendingFinanceFeb2015Looking at the percentage movements, month on month, we see the rate of growth slowing across the board, with investment lending slowing the most. This could well indicate a potential turning point in the months ahead, despite strong demand for investment property in the system.

HousingFinancePCMovementsFeb2015

Is The Housing Finance Worm Turning?

The ABS Housing Finance data for February 2015 was released today. The trend estimate for the total value of dwelling finance commitments excluding alterations and additions rose 0.8%. Owner occupied housing commitments rose 1.0% and investment housing commitments rose 0.4%. This is the first time growth in owner occupied loans has exceeded investment loans for many months. As a result the proportion of investment loans dropped below 50% for the first time this year. The cut in RBA rates also stimulated demand for the refinance of existing loans. We also see the bulk of investors purchased established dwellings, not newly constructed property.

OOandINVSAFeb2015The trend data (which irons out monthly changes) held investment loans over 50%, but also registered a slight drop.

OOandINVTrendsFeb2015In trend terms, the number of commitments for owner occupied housing finance rose 0.2% in February 2015.  In trend terms, the number of commitments for the purchase of established dwellings rose 0.5%, while the number of commitments for the purchase of new dwellings fell 1.4% and the number of commitments for the construction of dwellings fell 1.1%. The number of loans to owner occupiers buying established homes, excluding refinancing, fell by 0.9 per cent.NumberofLoansByPurposeFeb2105The overall value of loans made in the month was a record $18 billion, excluding refinancing of existing loans. New construction was up about 2%.

ValueofLoansByPurposeFeb2015In percentage terms, refinance of loans increased slightly, relative to new loans.

ValueofLoansByPurposePCFeb2015 In original terms, the number of first home buyer commitments as a percentage of total owner occupied housing finance commitments rose to 13.7% in February 2015 from 13.6% in January 2015.

FirstTimeBUyersFeb2015If we overlay the DFA modelling of first time investor loans, overall first time buyer activity was up. Remember, also the data refers to loans, not property transfers, and we know form our surveys that additional purchases were made without the need for a mortgage by overseas investors, and local purchases cashed up thanks to the Bank of Mum and Dad.

FirstTimeBUyersAdjustedFeb2015Finally, the bulk of lending is being done by the banks, relative to credit unions and building societies. The total loans on book was $1.375 trillion.

Loan-ValueByLenderTypeFeb2015

It is also worth noting that building societies are lending a smaller proportion of investment loans, and the falling trend here, compared with the rising trend in the credit union sector, though both are well below the 34% of banks loan portfolio.

LoanStockByTypeFeb2015


.