Investment Loans 50.8% Of Mortgages

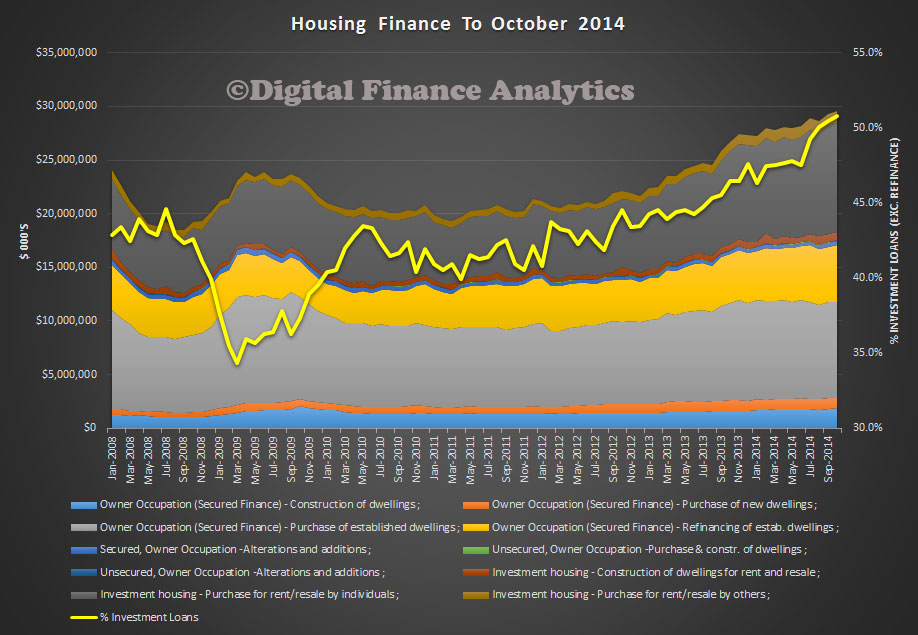
The ABS released their finance data to October 2014. The total value of owner occupied housing commitments excluding alterations and additions rose 0.2% in trend terms, and the seasonally adjusted series rose 1.0%.

LendingFinanceOct2014

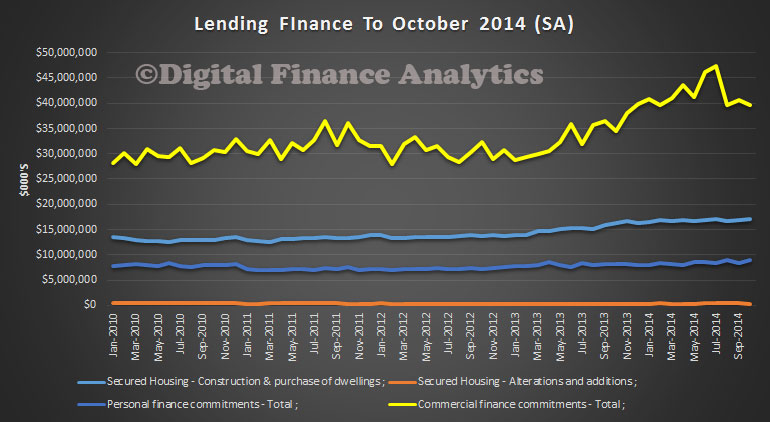
The trend series for the value of total personal finance commitments rose 0.7%. Fixed lending commitments rose 1.1% and revolving credit commitments rose 0.1%. The seasonally adjusted series for the value of total personal finance commitments rose 6.5%. Revolving credit commitments rose 11.2% and fixed lending commitments rose 3.0%.

The trend series for the value of total commercial finance commitments fell 2.6%. Revolving credit commitments fell 7.9% and fixed lending commitments fell 0.6%. The seasonally adjusted series for the value of total commercial finance commitments fell 2.2%. Revolving credit commitments fell 11.5%, while fixed lending commitments rose 0.9%.

The trend series for the value of total lease finance commitments rose 0.8% in October 2014 and the seasonally adjusted series fell 4.7%, following a fall of 0.9% in September 2014.

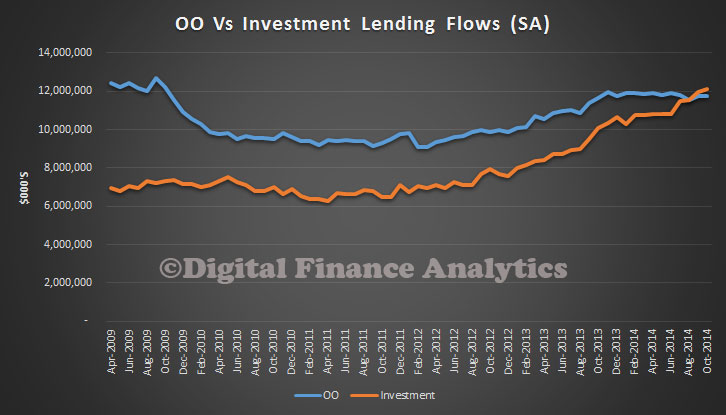
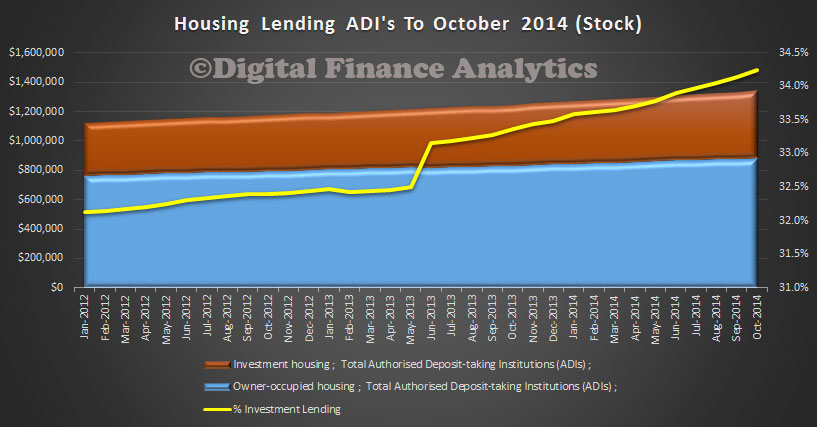
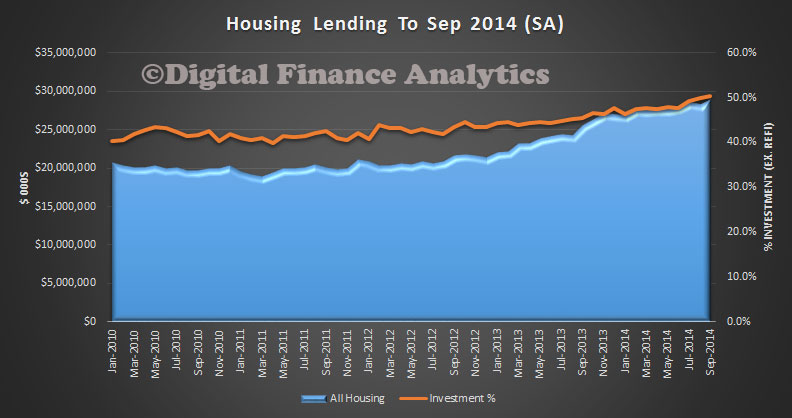
The housing lending data shows another record was achieved last month with 50.8% of mortgages for investment purposes. Another record.

HousingFinanceOct2014
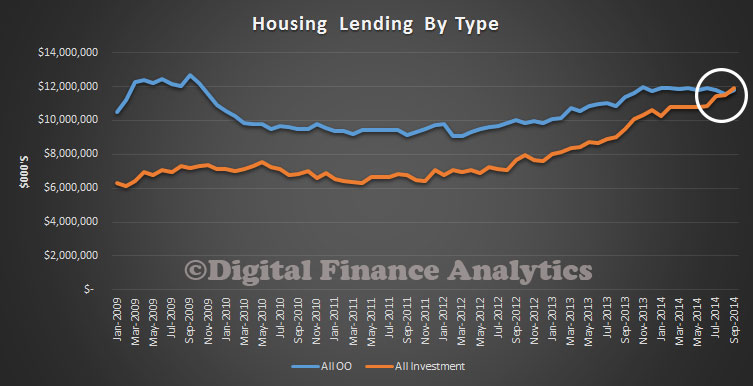
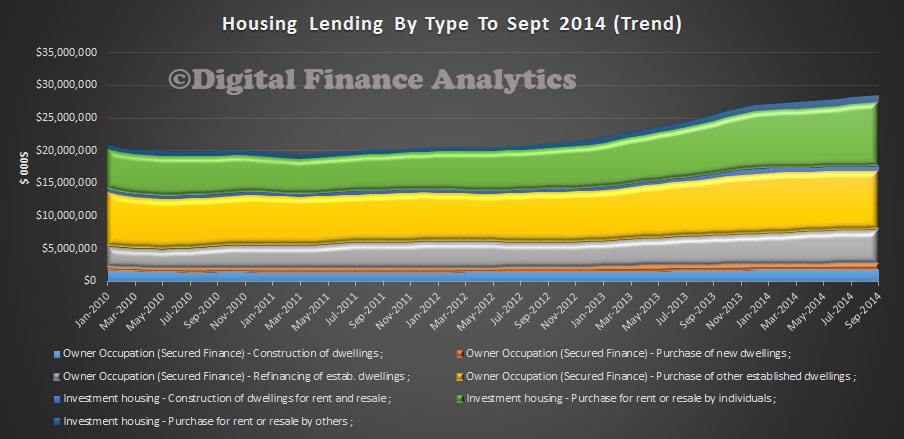
This is starkly show by plotting the flows of owner occupied versus investment loans over the past few years.

OOVSINVOct2014

Labour Force Trends – Good Or Bad?

The ABS data today can be read a couple of ways. It was the highest rate of unemployment for more than 12 years but also the strongest growth in jobs since early 2012. The movement in the month was only 0.01%, from 6.25% to 6.26%, so it rounded down last month to 6.2%, and up to 6.3% this time. Given the ABS sample size, the 1% change in the result is potentially overstating the true picture.

TrendUnemploymenttoNov2014Overall, the number of people employed rose by 42,700, against analyst expectations of 15,000. In addition, the participation rate rose slightly from 64.6% to 64.7%.

LabourForceTrendsNov2014Of the 40,000 jobs created in the month. more than 36,400 were part-time positions for women, while total full-time employment rose by just 1,800 jobs. The aggregate monthly hours worked dropped 4.4 million hours, or 0.3%. As we showed in our earlier post, there are some significant state variations.  WA is helping to keep the all Australian averages lower. As mining continues to slow, will this continue?

UnemploymentStatesNov2014So mixed messages in the data, assuming the seasonality issues have been sorted out. But the longer terms trend data is quite clear. Participation rate has fallen from 2011, the unemployment rate is higher (especially for younger and older Australians) and those looking for part-time or full-time work are growing faster than the working population.

Unemployment To 6.3% – ABS

The ABS released the November data today. Australia’s seasonally adjusted unemployment rate increased by less than 0.1 percentage points to 6.3 per cent in November 2014, as announced by the Australian Bureau of Statistics (ABS) today.

The seasonally adjusted labour force participation rate increased 0.1 percentage points to 64.7 per cent in November 2014.

The ABS reported the number of people employed increased by 42,700 to 11,637,400 in November 2014 (seasonally adjusted). The increase in employment was driven by increased part-time employment for females (up 36,400) and full-time employment for males (up 23,300) offset by a fall in female full-time employment (down 21,400). Total full-time employment increased, up 1,800.

The ABS seasonally adjusted aggregate monthly hours worked series decreased in November 2014, down 4.4 million hours (0.3%) to 1,610.6 million hours.

The seasonally adjusted number of people unemployed increased by 4,700 to 777,700 in November 2014, the ABS reported.

The seasonally adjusted underemployment rate was 8.6 per cent in November 2014, an increase of 0.3 percentage points from August 2014. Combined with the unemployment rate of 6.3 per cent, the latest seasonally adjusted estimate of total labour force underutilisation was 15.0 per cent in November 2014, an increase of 0.6 percentage points from August 2014.

The original data by state highlights some interesting variations, with WA at the lower end, and VIC and SA at the higher end.

UnemploymentStatesNov2014

Is Housing Lending Growth Topped Out?

The latest ABS data, housing finance for October 2014, for ADI’s, shows that the trend estimate for the total value of dwelling finance commitments excluding alterations and additions rose 0.8%. Investment housing commitments rose 1.8% and owner occupied housing commitments rose 0.2%. In seasonally adjusted terms, the total value of dwelling finance commitments excluding alterations and additions rose 1.0%. In stock terms, the percentage of loans for investment purposes increased to 34.2% of all ADI housing loans.

HousingFinanceStockADIOct2014In percentage terms, banks still dominate compared with credit unions and building societies.

HousingFinanceADIPCTypeOct2014However, the number of dwelling committments for owner occupied housing finance fell 0.2% in October 2014.In trend terms, the number of commitments for the purchase of established dwellings fell 0.3% while the number of commitments for the construction of dwellings rose 0.8% and the number of commitments for the purchase of new dwellings rose 0.1%. In original terms, the number of first home buyer commitments as a percentage of total owner occupied housing finance commitments fell to 11.6% in October 2014 from 12.0% in September 2014. In state terms, the proportion of first time buyers fell in every main state, other than a small rise in VIC.

FTBByStateOcr2014Overall lending across the states fell slightly in NSW, QLD and SA, and rose in WA and VIC.

HousingFinancePCCHangeOct2014Are there signs the demand for housing finance is beginning to ease?  The latest DFA survey results suggest this could be the case.

GDP 0.3% In Sept Quarter

The ABS published their data to September 2014 in the National Accounts. GDP, in seasonally adjusted chain volume terms, grew 0.3 per cent in the September quarter 2014.  This number is significantly below analysts’ expectations which was in the order of 0.7 per cent in the quarter and also is a drop from the relatively weak 0.5% growth recorded in June.This translates to 2.7 per cent for the 12 months to September 2014.

Net exports contributed 0.8 percentage points to GDP growth. Household final consumption expenditure contributed 0.3 percentage points to GDP growth and Government final consumption expenditure contributed 0.1 percentage points to GDP growth. This was offset by a -0.7 percentage point contribution to GDP growth from total Gross fixed capital formation and a -0.1 percentage point contribution from Changes in inventories.

The Terms of trade decreased 3.5%, and Real gross domestic income decreased 0.4%. In seasonally adjusted terms, the main contributors to the increase in expenditure on GDP were Net exports (0.8 percentage points) and Final consumption expenditure (0.4 percentage points) The main detractors were Private gross fixed capital formation (-0.5 percentage points) and Public gross fixed capital formation (-0.2 percentage points).

GDPSep2014In seasonally adjusted terms, the main contributor to GDP growth was Financial and insurance services (0.2 percentage points), with Mining and Information media and telecommunications each contributing 0.1 percentage points to the increase in GDP. The main detractors to growth in GDP were Construction (-0.2 percentage points) and Professional, scientific and technical services (-0.2 percentage points).

The AU – US rate dropped below 84c on the news.

USAUDDec2014

Managed Funds Now Worth $2.44 Trillion

The ABS just released their Managed Funds data to September 2014. The managed funds industry had $2,439.5b funds under management, an increase of $26.6b (1%) on the June quarter 2014 figure of $2,412.8b. The main valuation effects that occurred during the September quarter 2014 were as follows: the S&P/ASX 200 decreased 1.9%; the price of foreign shares, as represented by the MSCI World Index excluding Australia, increased 2.4%; and the A$ depreciated 7.6% against the US$.

ManagedFundsSept2014The consolidated assets of managed funds institutions were $1,922.7b, an increase of $20.0b (1%) on the June quarter 2014 figure of $1,902.7b. The asset types that increased were overseas assets, $16.8b (5%); deposits, $4.4b (2%); short term securities, $2.5b (3%); units in trusts, $2.3b (1%); land, buildings and equipment, $0.6b (0%); and shares, $0.1b (0%). These were partially offset by decreases in other financial assets, $5.8b (16%); bonds, etc., $0.5b (0%); other non-financial assets, $0.2b (2%); and loans and placements, $0.2b (0%). Derivatives were flat. There were $484.7b of assets cross invested between managed funds institutions.

ManagedFundsAssetsSept2014Unconsolidated assets of superannuation (pension) funds increased $24.3b (1%), life insurance corporations increased $3.0b (1%), public offer (retail) unit trusts increased $1.9b (1%), cash management trusts increased $0.6b (2%), common funds increased $0.2b (2%), and friendly societies increased $0.1b (1%).

ManagedFundsUnALOCSept2014


Housing Construction Boom Wavers

The ABS published their preliminary construction work done data to September 2014. Overall the seasonally adjusted value of construction work done dropped 2.2 % to $51,146.4m in the September quarter and makes a 5.1% fall this year. Within the data, NT construction rose, helping to trim the damage, but the result was below market expectations.  Within the data. new private residential construction fell by 2.0 per cent in the September quarter but is still 9.7 per cent higher for the year. But the big question is, has construction begun to falter, or will growth continue – building approvals data could suggests it has some way to run, but it looks a little more shaky now. The RBA is banking on construction powering on of course to reach escape velocity as the mining investment boom fades.

The seasonally adjusted estimate of total building work done fell 1.0% to $22,435.8m in the September quarter. The trend estimate for engineering work done fell 3.0% in the September quarter.The seasonally adjusted estimate for engineering work done fell 3.2% to $28,710.6m in the September quarter.

The trend estimate for total construction work done fell 1.2% in the September quarter 2014 but the trend estimate for total building work done rose 1.5% in the September quarter. The trend estimate for non-residential building work done rose 0.9%, while residential building work rose 1.8%. The trend estimates are derived by applying a 7-term Henderson moving average to the seasonally adjusted series. The 7-term Henderson average (like all Henderson averages) is symmetric but, as the end of a time series is approached, asymmetric forms of the average are applied. Unlike weights of the standard 7-term Henderson moving average, the weights employed have been tailored to suit the particular characteristics of individual series. So looking at trend data we see new houses more static than other residential development, (units).

ConstSep2014tTrendFlowsByTypeThis is shown more starkly if we look at percentage distribution. Whilst conversions are relatively static, units and other non-house residential building is showing more momentum.

ConstSep2014tTrendFlowsByTypePCThe original state data shows that more new houses were built in VIC than NSW, with WA and QLD close together.

ConstSep2014HouseStatesPCTurning to other types of residential building, we see that around 70% are locate across NSW and VIC. We see a spike in ACT units in 2011, but this seems to be slowing now. In WA more houses than units are being built.

ConstSep2014OtherResiStatesPC

Securitisation Update

The ABS published their data on Assets and Liabilities of Securitisers in Australia. At 30 September 2014, total assets of Australian securitisers were $131.7b, up $0.1b (0.1%) on 30 June 2014. This continues the flat trend, despite growth in house prices and lending for property purchase.

SecuritersAssetsSept2014During the September quarter 2014, the rise in total assets was due to an increase in other loans (up $0.8b, 5.1%) and cash and deposits (up $0.2b, 4.1%). This was partially offset by decreases in residential mortgage assets (down $0.9b, 0.8%). Residential and non-residential mortgage assets, which accounted for 82.1% of total assets, were $108.1b at 30 September 2014, a decrease of $0.9b (0.8%) during the quarter.

At 30 September 2014, total liabilities of Australian securitisers were $131.7b, up $0.1b (0.1%) on 30 June 2014. The rise in total liabilities was due to the increase in long term asset backed securities issued in Australia (up $1.7b, 1.8%) and loans and placements (up $0.5b, 3.1%). This was partially offset by a decrease in asset backed securities issued overseas (down $1.5b, 12.0%).

SecuritersLiabilitiesSept2014At 30 September 2014, asset backed securities issued overseas as a proportion of total liabilities decreased to 8.3%, down 1.1% on the June quarter 2014 percentage of 9.4%. Asset backed securities issued in Australia as a proportion of total liabilities increased to 78.2%, up 1.4% on the June quarter 2014 percentage of 76.8%.

SecuritersLiabilitiesPCSept2014Finally, looking at loans to households and private non-financial corporations, we see the proportion which are residential mortgages falling to 85%.

SecuritersLoansSept2014

House Prices Rise Fast; Valued At $5.3 Trillion

The ABS released their latest Residential Property Prices series today. Prices continue to rise, and are high by any measure you care to look at. Preliminary estimates show that the price index for residential properties for the weighted average of the eight capital cities rose 1.5% in the September quarter 2014. The index rose 9.1% through the year to the September quarter 2014. The capital city residential property price indexes rose in Sydney (+2.7%), Melbourne (+1.0%), Brisbane (+1.0%), Adelaide (+1.0%), Hobart (+1.0%), Canberra (+0.3%) and Darwin (+0.3%) and fell in Perth (-0.1%). Annually, residential property prices rose in Sydney (+14.6%), Melbourne (+6.9%), Brisbane (+6.7%), Adelaide (+5.6%), Hobart (+4.3%), Perth (+3.7), Darwin (+3.4%), and Canberra (+2.4%).

PricesByStateSept2014EstablishedHousesByStateSept2014The total value of residential dwellings in Australia was $5,296,305.3m at the end of September quarter 2014, rising $99,578m over the quarter. The mean price of residential dwellings rose $8,300 and the number of residential dwellings rose by 37,700 in the September quarter 2014.

The average price in Sydney is above $700,000 (to March 2014), whereas in Tasmania its $250,000.

UnstratifiedPricesByRegionSept2014Also, we see that prices have risen faster in the Cities, compared with regional areas. Here is the data for Sydney and NSW. Actually, if you correct for inflation, prices beyond the main centres have gone sideways, or worse.

UnstratifiedPricesNSWSept2014

Over 50% Investment Loans In September

The latest ABS housing finance data to September 2014 has just been released. We broke more records, as more than half the loans written, excluding refinance, were for investment purposes.

LoanAnalysisSept2014

First time buyers continue to languish, especially in the hot Sydney market. Further evidence of the market being out of kilter, per the RBA’s recent comments. In seasonally adjusted terms, the total value of dwelling finance commitments excluding alterations and additions rose 2.3%.

HousingSept14-TypeSummaryIn original terms, the number of first home buyer commitments as a percentage of total owner occupied housing finance commitments rose to 12.0% in September 2014 from 11.8% in August 2014. Still near the lowest on record.

HousingSept14-FTBTrendNSW first time buyers continues at the lowest levels, though with a slight uplift this month. WA data flatters the Australia-wide averages for first time buyer finance. It is not just a Sydney thing.

HousingSept14-FTBStateTrendIn trend terms, the number of commitments for owner occupied housing finance fell 0.2% in September 2014. In trend terms, the number of commitments for the purchase of established dwellings fell 0.3%, while the number of commitments for the purchase of new dwellings rose 1.2% and the number of commitments for the construction of dwellings rose 0.2%.

HousingSept14-TypeTrendTrend