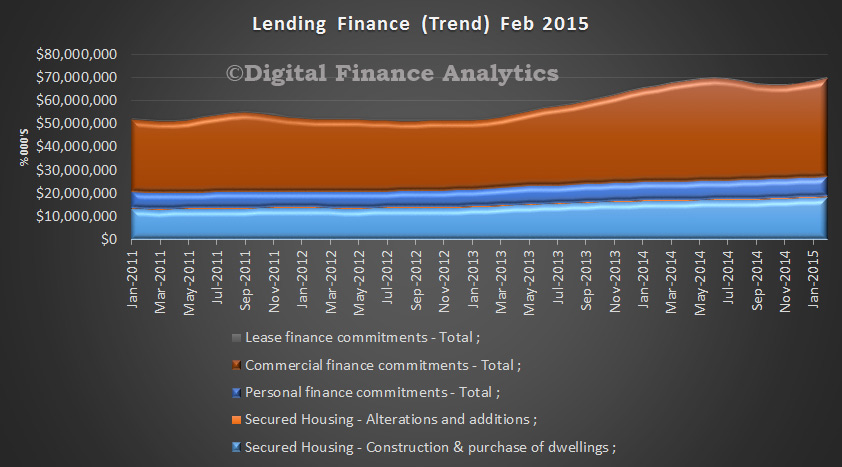
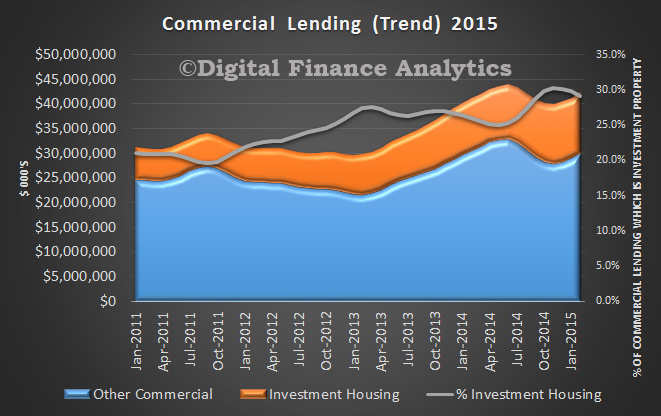
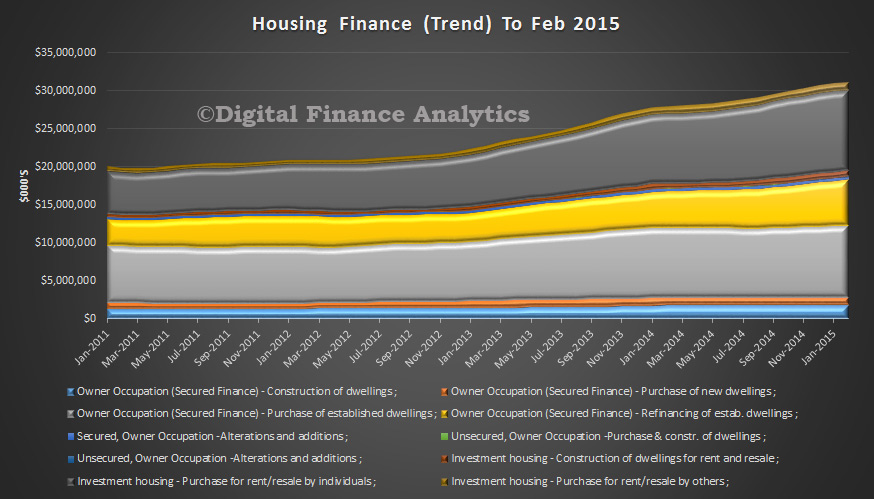
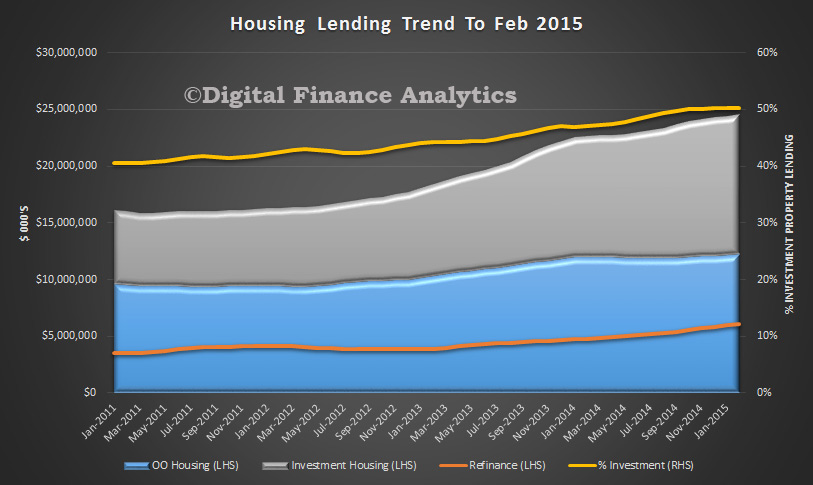
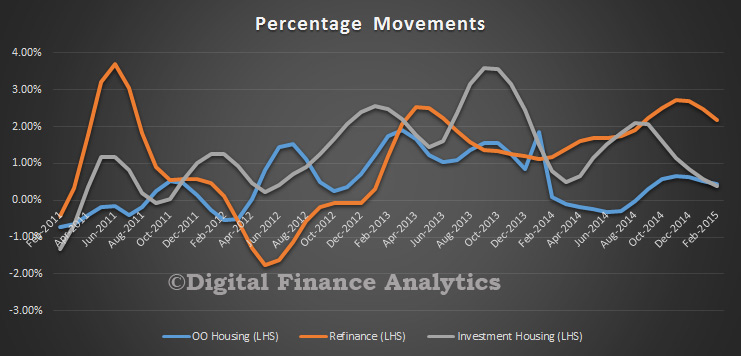
The ABS released their housing finance data to March 2015. Pretty common story, with the trend estimate for the total value of dwelling finance commitments excluding alterations and additions rising 0.8%. Owner occupied housing commitments rose 0.8% and investment housing commitments rose 0.8%. In trend terms, the number of commitments for owner occupied housing finance rose 0.4% in March 2015.
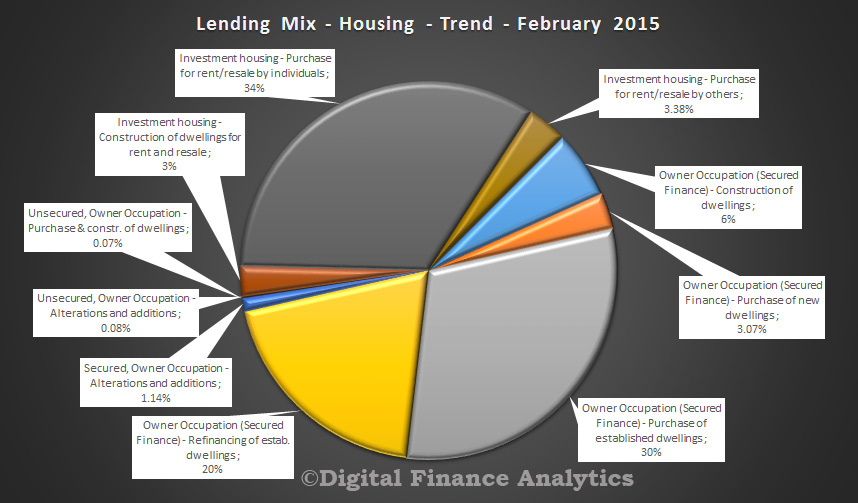
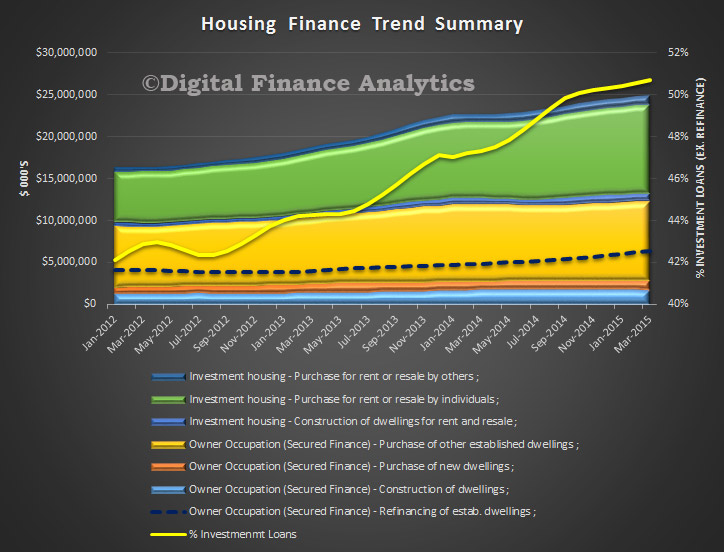
In trend terms, the number of commitments for the purchase of established dwellings rose 0.7%, while the number of commitments for the construction of dwellings fell 1.4% and the number of commitments for the purchase of new dwellings fell 0.1%. The growth in investor property loans continued, with more than half in March (excluding refinance). Refinancing also grew in value and in percentage terms, from 18% of all loans a year ago, to over 20%, stimulated by ultra low rates.
 Looking at the First Time Buyer data, in original terms, WA had the highest share of FTB, and NSW the lowest.
 The percentage of FTB compared with all dwellings is relatively static.
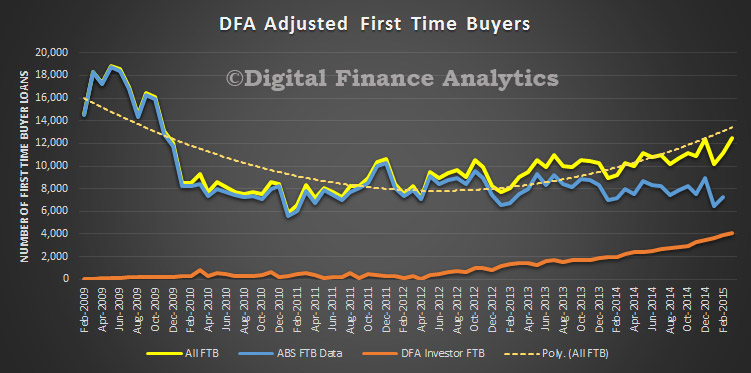
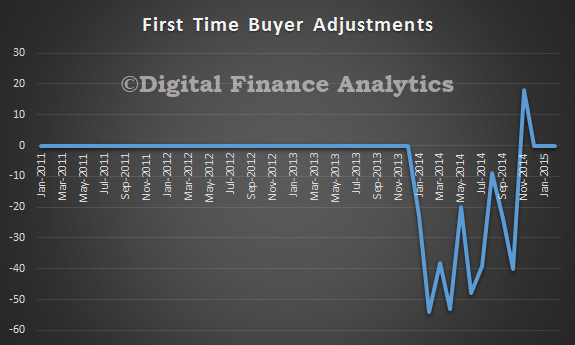
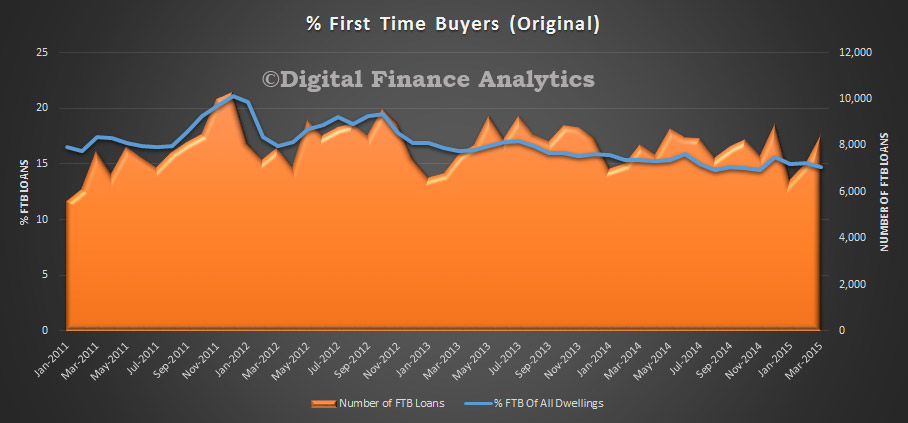 However, if we overlay the DFA survey data on first time buyers who are going straight to investment property, this continues to rise, and pushes the true number of FTB higher. We continue to see a rotation away from owner occupation to investor first time buyers.