We review the latest APRA Property Exposure stats.
https://www.apra.gov.au/publications/quarterly-authorised-deposit-taking-institution-statistics
Digital Finance Analytics (DFA) Blog
"Intelligent Insight"
We review the latest APRA Property Exposure stats.

https://www.apra.gov.au/publications/quarterly-authorised-deposit-taking-institution-statistics

We look at the latest APRA mortgage industry data

APRA released their Property Exposures Data to March 2018 today.
We will delve into the detail later, but three charts tell the story, looking across the market of ADI’s with more than $1 billion of loans.
;
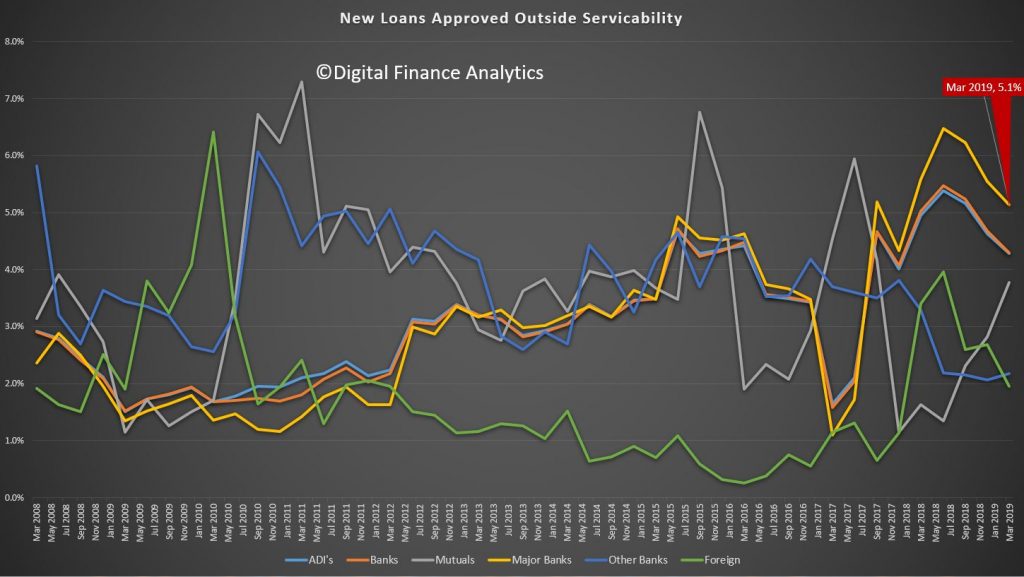
First, the number of loans being approved outside current serviceability standards has lifted to around 5% of all new loans. This reflects tighter controls in the banks, so they narrowed the serviceability aperture. But is also suggests that some loans are still getting funded under questionable parameters. Remember loan underwriting standards continue to tighten, so this will be an important measure to watch ahead.
 Second, the volume and share of loans via brokers, having reach a peak last year look to be falling, reflecting first lower absolute volumes of new loans, and second a preference by the banks to use their own channels. We will be watching the mix by channel in the months ahead, our thesis is mortgage brokers are going to have to work a lot harder down the track!
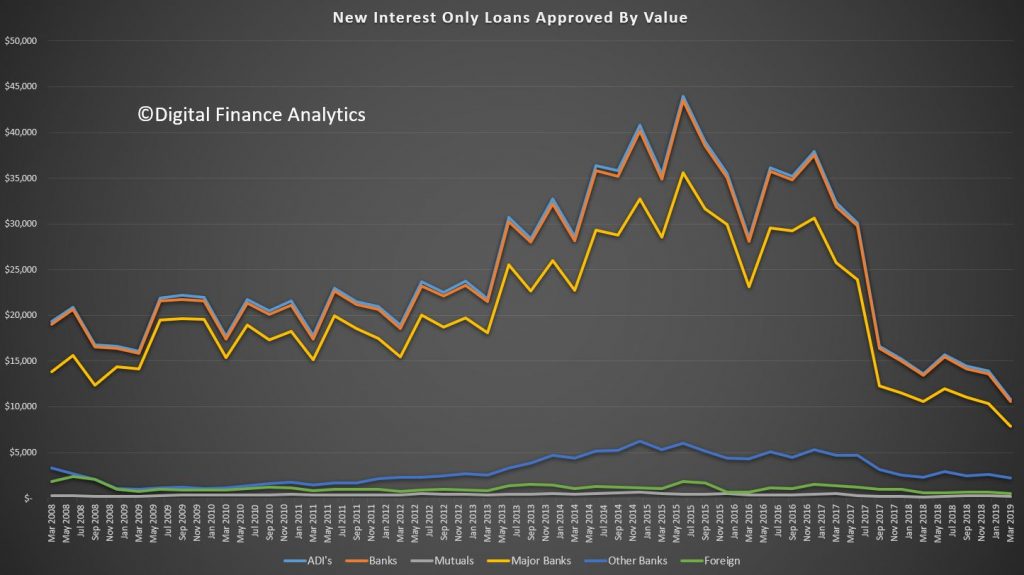
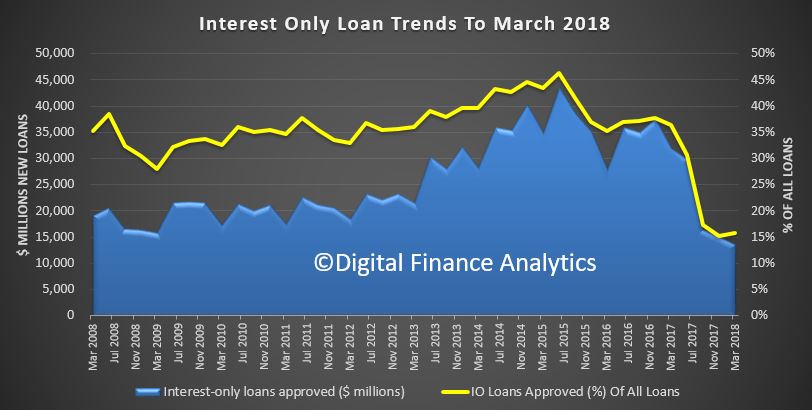
And third, the doozy, the share of interest only new loans have fallen to 15% of loans, and the value written in also down. So the APRA inspired intervention (better late then never) is hitting home. Again we need to watch whether there is a rebound as settings are tweaked to try and keep home prices falling further.
 OK, I lied, there is a fourth slide. Despite all the tightening, the total balances grew again in March to $1.6 trillion, despite investment loans falling to 33.8% of the portfolio. So lets be clear, household debt is still rising, with investment loans rising 0.4% in the quarter and owner occupied loans rising by 2%. Or over the past year, 2.6% and 8% respectively. Still too hot in the current climate, in my view. So more tightening is needed, and I suspect a harder Debt to Income hurdle of 6% is where it will bite.
Continuing our analysis of the APRA ADI data to September 2017, we will look across the various metrics for new loans, and by lender category.
APRA reports new flows by Major Banks, Other Banks, Foreign Banks and Mutuals (Credit Unions and Building Societies).
Looking first at third party origination, we see that origination from foreign banks is sitting at 70% of new loans, mutuals around 20% and other banks around the 50% mark. Overall, volume through brokers is climbing.
 New interest only loan approvals have fallen from, in the case of the major banks, around 40% to 20%, and we see the regulatory pressure has reduced the mix across the board.
 Investment loan volumes have fallen, though major banks still have the largest relative share, above 30%. Mutuals are sitting around 10%.
 There has been a spike in loans being approved outside serviceability, with major banks reporting 5% or so in September. This may well reflect a tightening of standard serviceability criteria and the wish to continue to grow their loan books.
 Finally, we look across the LVR bands for new loans. There has been a small rise in loans between 60% LVR, but around 30% of all new loans are in this range.
 We see a small fall in the relative proportion of loans in the 60-80% range, but close to half of all loans written are still in this range.
 Turning to the 80-90% LVR range, we see a rise in lending by foreign banks, with more than 20% of their loans falling in this range. Other lenders are averaging 10-15 %.
 Finally, there is a rise in loans above 90% being written by mutuals, (as they they to grow share), while the banks are around 7% and foreign banks lower still.
 So overall, we see the impact of regulatory intervention. The net impact is to slow lending momentum. As lenders tighten their lending standards, new borrowers will find their ability to access larger loans will diminish. But the loose standards we have had for several years will take up to a decade to work through, and with low income growth, high living costs and the risk of an interest rate rise, the risks in the system remain.
The latest APRA Property Exposure Data to September 2017 has been released. The most significant change is in the relative volume of interest only loans now held in the portfolio.
First, note that the average loan balance for interest only loans currently stands at $347,000 against the average balance of $264,000. So further confirmation that interest only loans are on average larger. No surprise of course, as these loans do not contain any capital repayments (hence the inherent risks involved, especially in a falling market).
Then look at the relative share of interest only loans in the portfolio, as households switch to more expensive principal and repayment loans (meaning their monthly repayment just went up!). In addition, see the mix of loan value versus volume. Interest only loans have fallen from around 40% in total value to 35%, but this represents a fall from around 30% of the loan count, to 27%. This again reflecting the higher average loan values for IO borrowers.
 We also see a fall in the volume of investment loans being held on book. As the lions share of interest only lending has been for investment purposes, this is of no surprise.
We will look at the data by individual type of lender in a separate post, together with the latest loan to value splits.
The latest APRA data showing ADI Property Exposures to June 2017 gives us a read on the mix of business by lender type. The new business data is the most relevant in monitoring current market changes. But we look at the loan stock data first. Home lending grew at 7.3% past 12 months, significantly above inflation and wage growth, underscoring continued household indebtedness. The debt monster continues to grow!
Overall, the ADIs’ residential term loans to households were $1.54 trillion as at 30 June 2017, an increase of $105.2 billion (7.3 per cent) on 30 June 2016. Owner-occupied loans were $1,006.2 billion (65.3 per cent), an increase of $75.8 billion (8.1 per cent) from 30 June 2016; and investor loans were $535.7 billion (34.7 per cent), an increase of $29.4 billion (5.8 per cent) from 30 June 2016.
Looking at new loans, ADIs with greater than $1 billion of residential term loans approved $384.0 billion of new loans in the year ending 30 June 2017. This is an increase of $12.0 billion (3.2 per cent) on the year ending 30 June 2016. Of these new loan approvals: Owner-occupied loan approvals were $249.9 billion (65.1 per cent), a decrease of $1.1 billion (0.5 per cent) from the year ending 30 June 2016 and Investment loan approvals were $134.1 billion (34.9 per cent), an increase of $13.2 billion (10.9 per cent) from the year ending 30 June 2016.
Now, APRA warns they are using different metrics to monitor IO loans:
The data used by APRA to monitor ADIs’ new interest-only lending is not the same as the source data for the statistics in this publication. First, APRA monitors ADIs’ new interest-only lending using data on loans funded; statistics in this publication show loans approved. Loans approved is a broader definition than loans funded; loans approved may not necessarily be funded. Second, APRA monitors new interest-only loans funded by all ADIs; interest-only mortgage statistics in this publication are based on data reported by 32 ADIs with over $1bn in residential term loans.
We think APRA should be transparent about their IO loans data, as we cannot see what is occurring. They have not explained WHY they are mixing the two measurement methods and why they do not reveal the true picture. Also of course IO loans for non-banks are not included in their statistics. So, again we get a partial view.
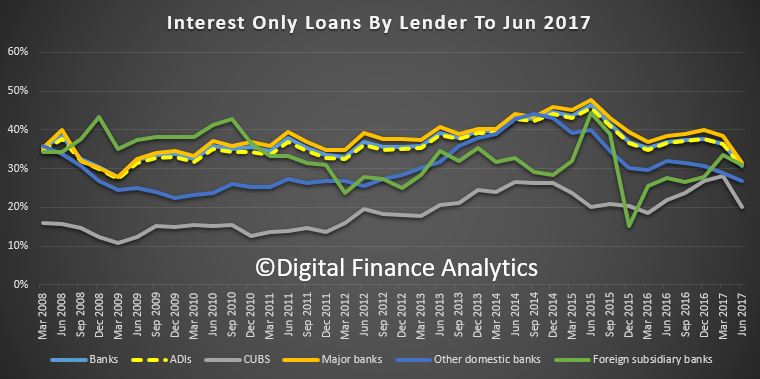
That said, we see a significant drop in the relative number of IO loans written since they intervened in the market. All lender categories show a fall. The average across ADI’s is still above 30%.
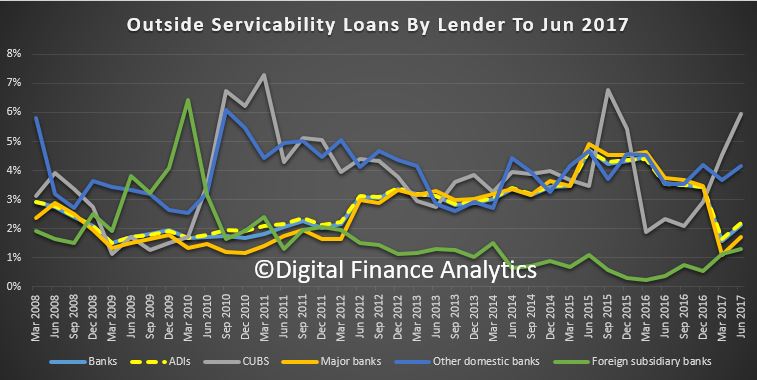
 Another indicator is the proportion of loans approved outside serviceability, the proportion of loans in the category has risen. 6% of CUBS (combined Credit Unions and Building Societies) were outside normal criteria. This may be an indicator of higher risks, when compared to the lower rates among other lenders.
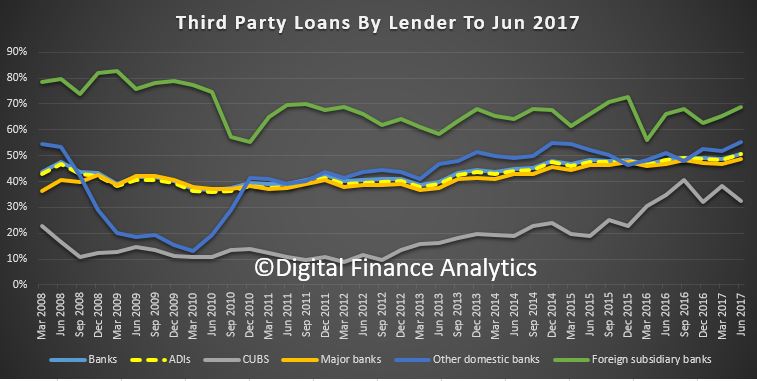
 The proportion of loans via brokers remains pretty strong, with foreign subsidiaries sitting at around 70%, compared with the major banks at 48%. Other domestic banks are a little higher, whilst CUBS are lower.
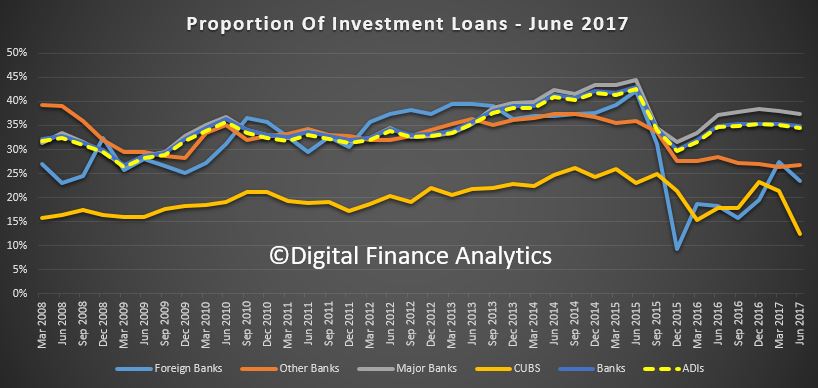
 Major Banks are lending more investor home loans (37.3%), compared with market at 34.5%.
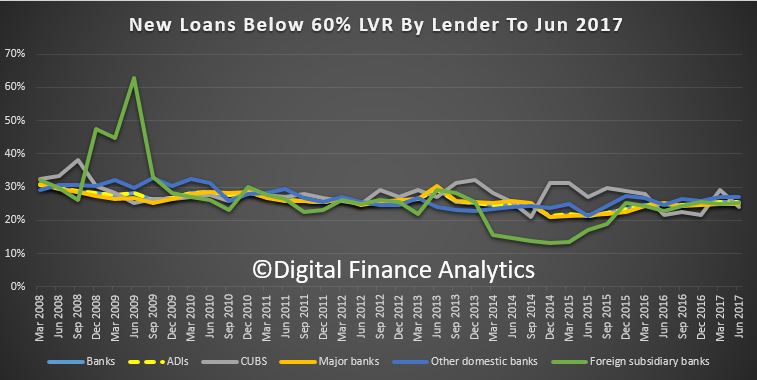
 Turning to the LVR bands for new borrowing, the proportion below LVR 60% remains relatively stable, but has risen a little.
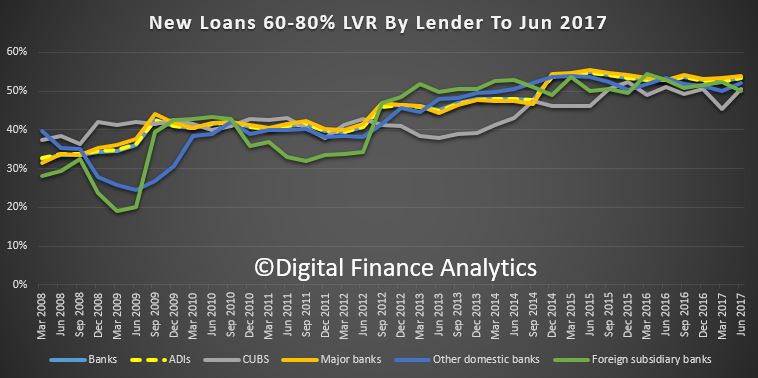
 Around half of all new loans, across most lenders are in the LVR 60-80% range, and has risen a little.
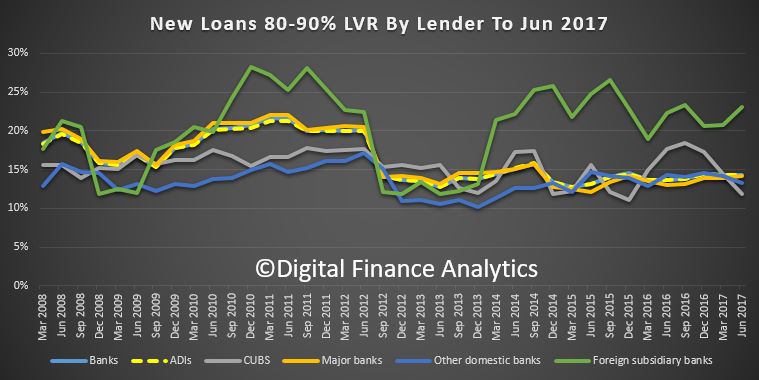
 We see a rise in 80-90% LVR loans from the foreign banks, a fall in CUBS and a relatively stable picture across the other lenders.
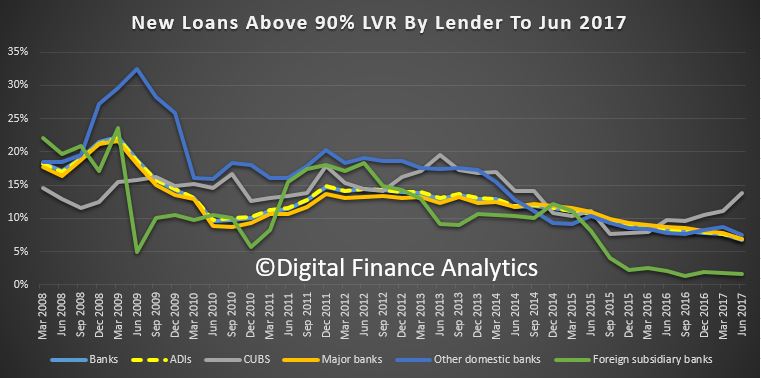
 Higher LVR loans, above 90% are down slightly, apart from CUBS (though small volumes).
 APRA also made a change this time by merging Credit Union and Building Society in a single set of tables.
As of the June 2017 edition of the Quarterly ADI Property Exposures publication, the standalone building societies tables (tables 3a, 3b, and 3c in previous editions) and the standalone credit unions tables (tables 4a, 4b, and 4c in previous editions) will be discontinued and replaced by the combined credit unions and building societies tables
APRA released their quarterly property exposure statistics today to end March 2017.
We see a fall in interest only loans, a fall in over 90% LVR loans and a fall in out of serviceability approvals. Third Party volumes from the majors fell, though offset by momentum from foreign banks.
Except they put a health warning on the data which says in essence, the numbers they are using to managed the banks interest only exposures are different from those reported. They caution that loans approved may not necessarily be funded, and they are measuring funded loans, which are not disclosed. In the public data on approved loans, we see a small fall, but offset by a rise in interest only loans offered by foreign banks.
The below-the-waterline conversations continue away from public gaze, despite the material implications of changes being made. Once again disclosure in Australia is shown as faulty and myopic. They also stopped reported credit unions and regional banks separately, last year as the number of entities fell, which is another issue.
APRA recommends that users of the publication exercise caution analysing and interpreting the statistics to monitor sound residential mortgage practices. APRA initiated additional supervisory measures to reinforce sound residential mortgage lending practices in an environment of heightened risks on 31 March 2017.
These measures included an expectation that ADIs limit the flow of new interest-only lending to 30 per cent of new residential mortgage lending.
The data used by APRA to monitor ADIs’ new interest-only lending is not the same as the source data for the statistics in this publication. First, APRA monitors ADIs’ new interest-only lending using data on loans funded; statistics is this publication show loans approved. Loans approved is a broader definition than loans funded; loans approved may not necessarily be funded. Second, APRA monitors new interest-only loans funded by all ADIs; interest-only mortgage statistics in this publication are based on data reported by 31 ADIs with over $1bn in residential term loans.
APRA currently collects data on ADIs’ new interest-only loans funded in an ad-hoc data collection. APRA has introduced a new reporting form, Reporting Form ARF 223.0 Residential Mortgage Lending (ARF 223.0) to better enable APRA’s supervisory monitoring and oversight of residential mortgage lending, and reduce the reliance on ad hoc information requests.
APRA will consider publishing statistics sourced from ARF 223.0 in the future.
Having got that out of the way, lets see what the public data does say.
Total ADIs’ residential term loans increased by $107.8 billion from march 2016, to $1.51 trillion as at 31 March 2017. This is an increase of 7.7 per cent on 31 March 201.
Of these, owner-occupied loans were $985.8 billion (65.1 per cent), an increase of $78.9 billion (8.7 per cent) from 31 March 2016; and investor loans were $528.7 billion (34.9 per cent), an increase of $28.8 billion (5.8 per cent) from 31 March 2016. Note: ‘Other ADIs’ are excluded from all figures.
ADIs with greater than $1 billion of residential term loans held 98.7 per cent of all such loans as at 31 March 2017. These ADIs reported 5.8 million loans totalling $1.49 trillion. Of these the average loan size was approximately $259,000, compared to $250,000 as at 31 March 2016 and $583.3 billion (39.0 per cent) were interest-only loans.
ADIs with greater than $1 billion of residential term loans approved $383.7 billion of new loans in the year ending 31 March 2017. This is an increase of $13.8 billion (3.7 per cent) on the year ending 31 March 2016.
Of these new loan approvals, owner-occupied loan approvals were $249.7 billion (65.1 per cent), an increase of $7.6 billion (3.1 per cent) from the year ending 31 March 2016 and investment loan approvals were $134.0 billion (34.9 per cent), an increase of $6.2 billion (4.8 per cent) from the year ending 31 March 2016.
$54.0 billion (14.1 per cent) had a loan-to-valuation ratio (LVR) greater than 80 per cent and less than or equal to 90 per cent, an increase of $2.7 billion (5.4 per cent) from the year ending 31 March 2016 (chart 8), $30.8 billion (8.0 per cent) had a LVR greater than 90 per cent, a decrease of $4.2 billion (12.0 per cent) from the year ending 31 March 2016 and $141.6 billion (36.9 per cent) were interest-only loans, a decrease of $5.3 billion (3.6 per cent) from the year ending 31 March 2016.
The number of over 80% under 90% LVR loans rose.
 Offset by a fall in over 90% loans.
 We see a fall in the over 90% LVR across the banks. So there is some lowering of risk from an LVR perspective, but affordability standards are still too lax in places (in our view).


 Third party loans from the majors fell from over 47% to 46%, reflecting a change in emphasis we have already discussed, as some lenders push business via their branch channels.
 Loans outside servicability fell as a proportion of loans, other than from foreign banks, where it is on the rise, though from a lower base.
 Finally, investment loans are highest via the major banks and we see a rise in investment lending from the foreign banks, as some local lenders dial back their loan availability to meet regulatory constraints.

The latest APRA data on ADI Property Exposures to December 2016 tells an interesting story. Essentially, whilst the proportion of higher LVR loans slides, in recent times lenders – especially the big four – appear to be more willing to make interest only loans (on the back of higher volumes of investment loans) alongside out of normal criteria loans. The APRA guidance has not it seems trimmed risk appetite so far.
ADIs residential term loans to households were $1.49 trillion as at 31 December 2016. This is an increase of $110.0 billion (8.0 per cent) on 31 December 2015. There are 5,728,000 housing loans (up 3.6% a year ago). The average balance is $257,300, up 3.5% from a year ago. $101.0 billion of loans were written in the December quarter.
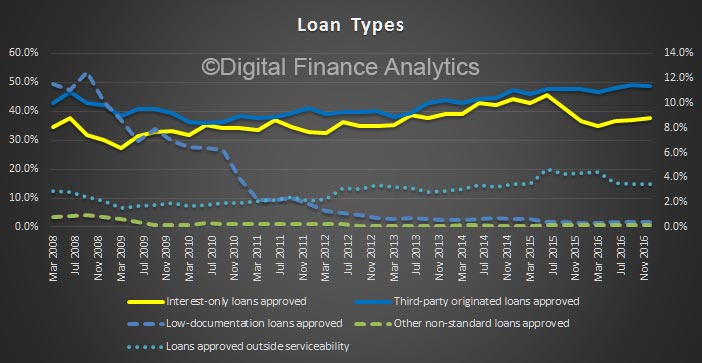
Looking in more detail, first at the aggregate data, we clearly see a rise in the proportion of new investment loans being written to December 2016.
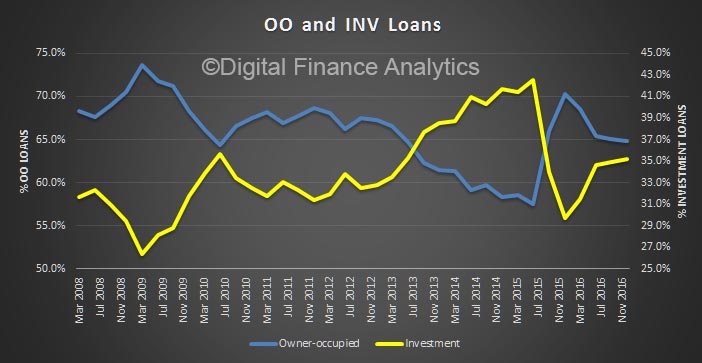 Interest only loans are rising, to 40% and the share via brokers also trended up to 48.8%. We know loans via brokers are higher risk. The proportion of loans approved outside serviceability is also higher.
 The proportion of higher LVR loans continues to trend down whilst the 60-80% LVR loans are higher, we also see a slight uptick in the 80-90% LVR bands.
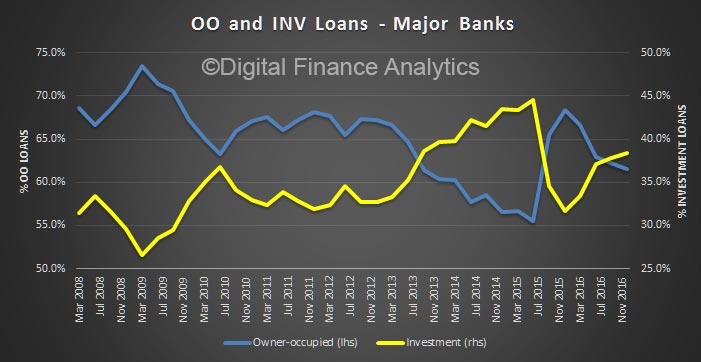
Turning to the aggregate data from the 4 majors, the rise in investment loans is more pronounced, to 38.4%.
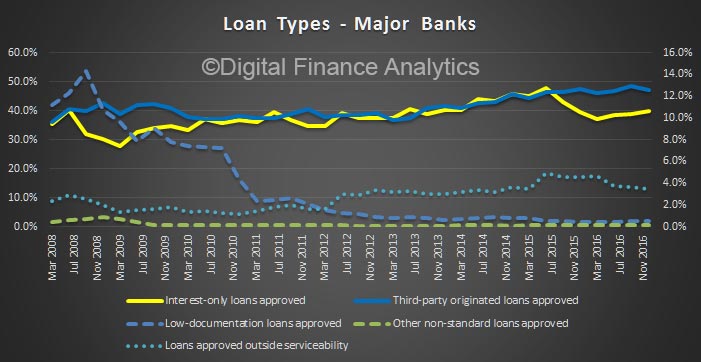
 The proportion of interest loan loans has risen, to 40%, from a recent low of 37%. Loans outside serviceability sits at 3.5%.
 The high LVR loans are lower, more than half of new loans are in the 60-80% LVR band.
Looking at the other banks (excluding the big 4), the share of investment loans are down to 27%.
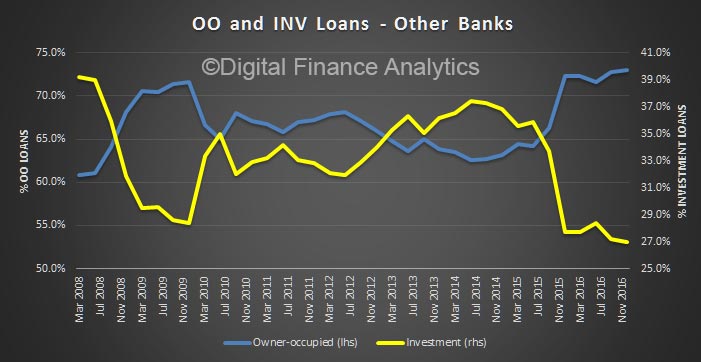 We see a fall in interest only loans, down to 30.7%, whilst the share of broker loans has risen to 52.2%, higher than the majors.
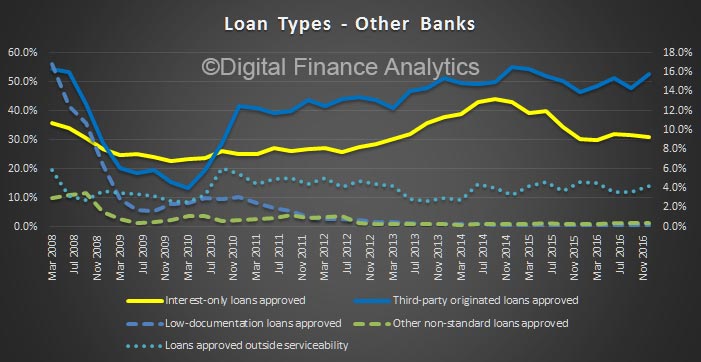 We see a similar trend in a fall in higher LVR loans.
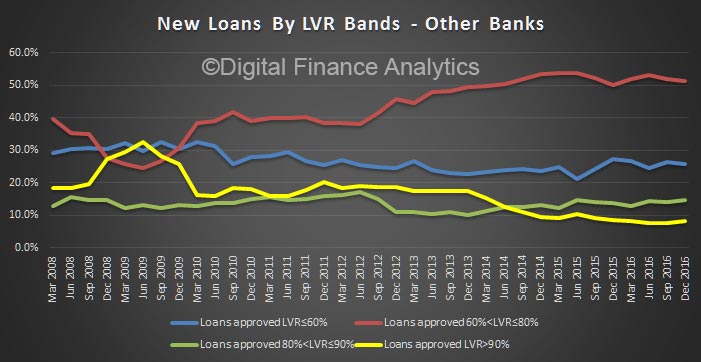 Worth also noting the volumes through credit unions and building societies are no longer being report, thanks to low volumes. So much for the “new force” in banking from the Customer Owned Institutions.
APRA released the latest ADI Property Exposure data to September 2016 today. ADIs residential term loans to households were $1.46 trillion as at 30 September 2016. This is an increase of $106.5 billion (7.9 per cent) on 30 September 2015. The number of loans rose from 5,469,000 to 5,665,000, a rise of 3.6% year on year.
Owner-occupied loans were $949.0 billion (64.9 per cent), an increase of $108.6 billion (12.9 per cent) from 30 September 2015; and investor loans were $512.3 billion (35.1 per cent), a decrease of $2.0 billion (0.4 per cent) from 30 September 2015.
ADIs with greater than $1 billion of residential term loans held 98.7 per cent of all such loans as at 30 September 2016. These ADIs reported 5.7 million loans totalling $1.44 trillion. Of these: the average loan size was approximately $255,000, compared to $244,000 as at 30 September 2015; and $564.8 billion (39.2 per cent) were interest-only loans.
Looking at new approvals, ADIs with greater than $1 billion of residential term loans approved $372.1 billion of new loans in the year ending
30 September 2016. This is an increase of $5.8 billion (1.6 per cent) on the year ending 30 September 2015. Of these new loan approvals: owner-occupied loan approvals were $250.3 billion (67.3 per cent), an increase of $29.9 billion (13.6 per cent) from the year ending 30 September 2015; investment loan approvals were $121.8 billion (32.7 per cent), a decrease of $24.2 billion (16.6 per cent) from the year ending 30 September 2015:
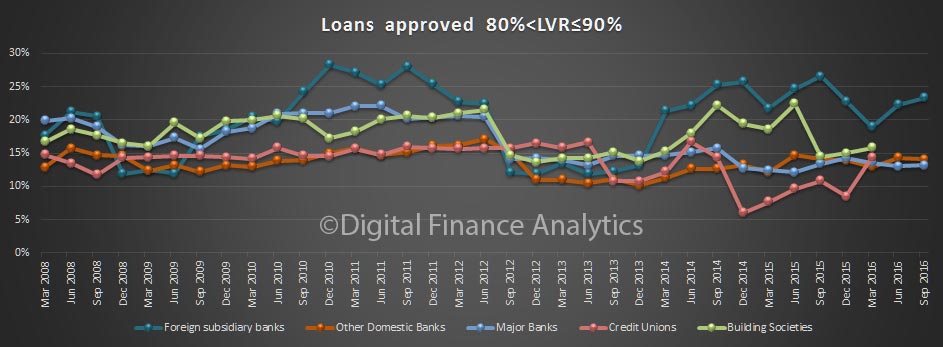
$51.8 billion (13.9 per cent) had a loan-to-valuation ratio (LVR) greater than 80 per cent and less than or equal to 90 per cent, an increase of $2.9 billion (5.9 per cent) from the year ending 30 September 2015
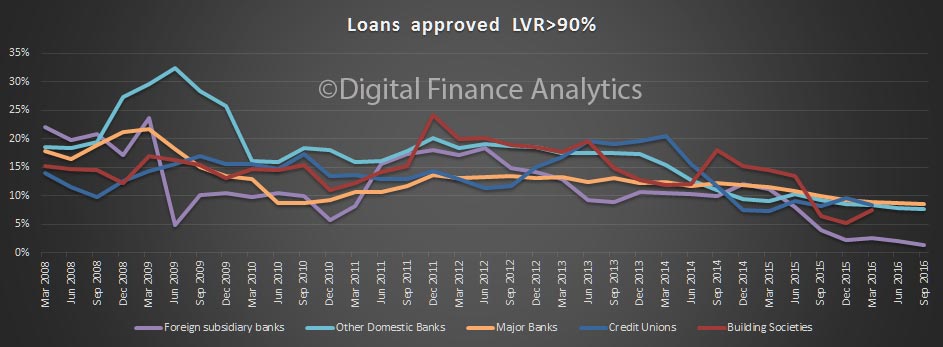
 $31.5 billion (8.5 per cent) had a LVR greater than 90 per cent, a decrease of $7.7 billion (19.5 per cent) from the year ending 30 September 2015; and
 $135.2 billion (36.3 per cent) were interest-only loans, a decrease of $23.9 billion (15.0 per cent) from the year ending 30 September 2015. Major banks are writing the largest proportion of interest only loans.
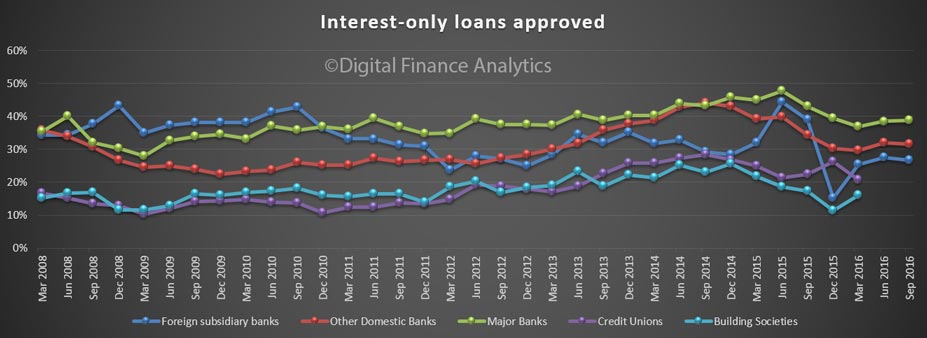 The proportion of new loans via brokers continues to grow, with foreign banks having the largest share, but domestic banks are now above 50%.
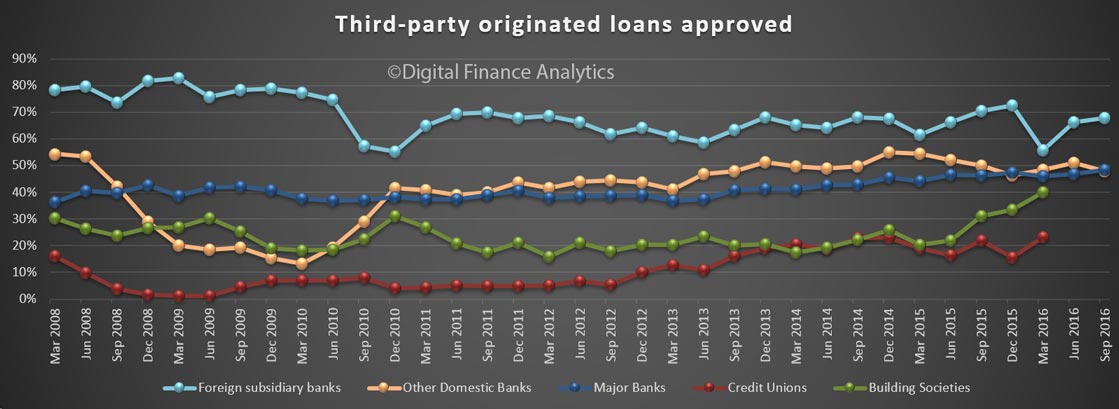 We note that the number of credit unions and building societies captured in the data has fallen to the point where their discrete data is no longer being reported.
The latest ADI Property Exposures data from APRA to Jun 2016 highlights that interest only loans, and investment property loans are on the rise, along with continued growth in the overall loan book and growth in broker originated loans. However, there are some interesting moving parts as we look across the various ADI’s.
Overall housing loans were up 8.1% compared with June 2015, to $1.44 trillion. The number of housing loans grew 3.7% to 5.62 million loans and the average loan balance rose 4.6% to $252,000. New loans approved in the quarter were $98.4 billion, up 2.1%.
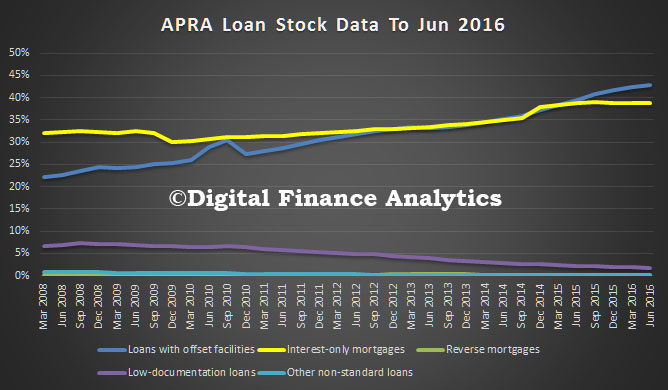
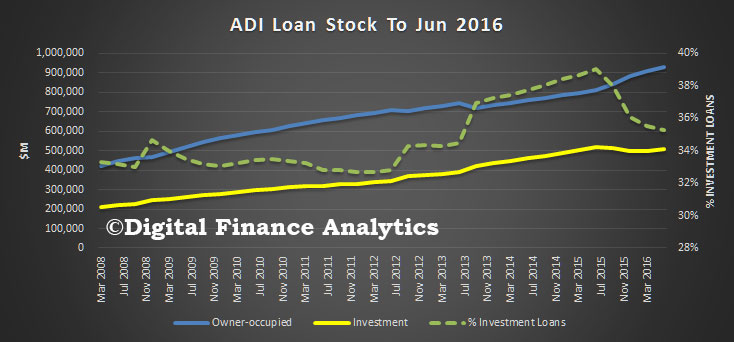 Looking first at loan stock, overall, the mix of investment loans is at around 35% of the total, down from 39% a year ago, reflecting loan reclassification and business mix. We see a slight rise in interest-only mortgages, and a stronger rise in loans with offset facilities.
 Looking at the flow of new mortgages, we see a rise in the proportion of new loans for investment purposes, and a rise also in overall loan flows by value.
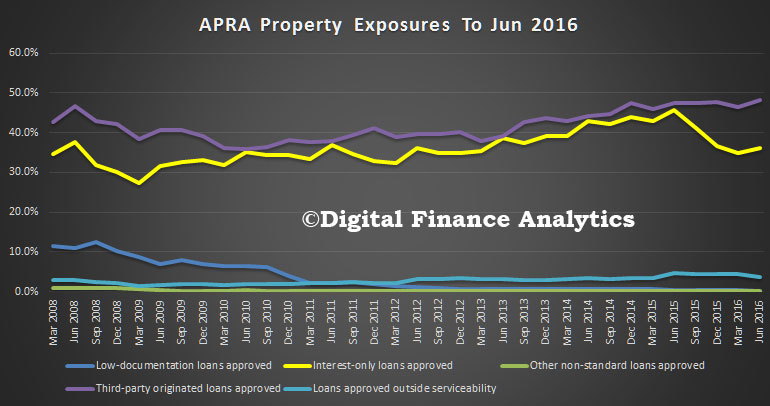
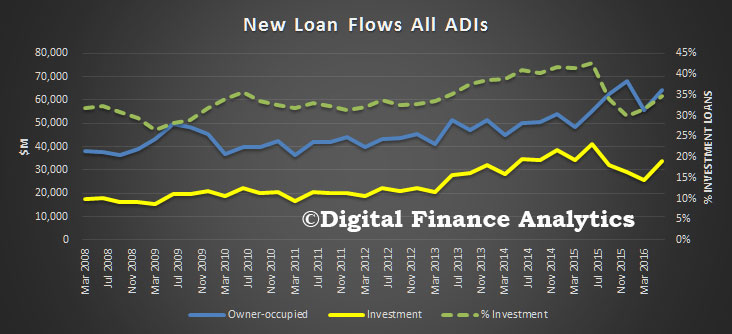 By value, a greater proportion of loans are being originated by third party (broker) channels, and again we see the rise in interest only loans. There remains a small proportion approved outside normal criteria, but low documentation loans are almost non-existent among ADI’s.
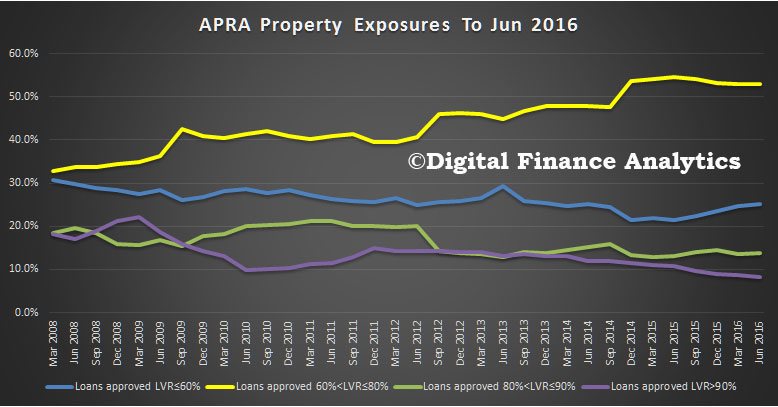
 The LVR mix also tells an important story. More loans are being written at lower LVR levels, with the number above 90% falling considerably. More than half are in the range 60-80%, reflecting the refinancing of existing loans as lenders battle for relative share.
 If we delve into the differences by lender type, we see that building societies are writing the largest proportion of below 60% LVR loans.
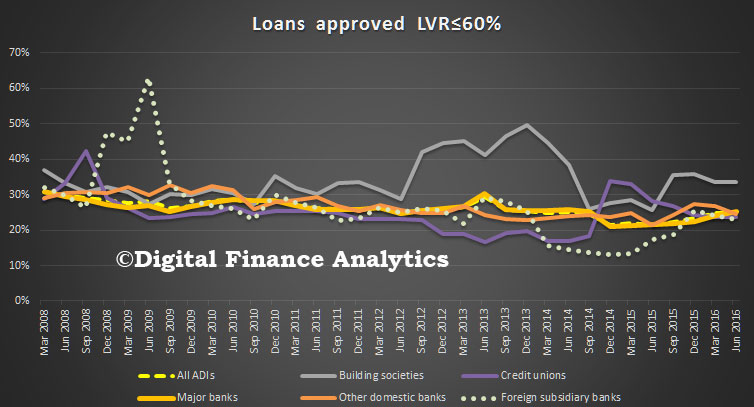 As a result, their loans in higher groups remain below the other lenders.
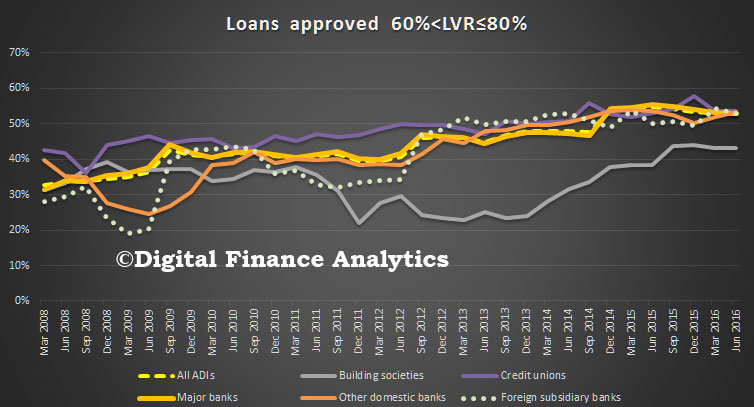 In the 80-90% LVR range, foreign banks are lending a larger proportion, relative to the other lenders.
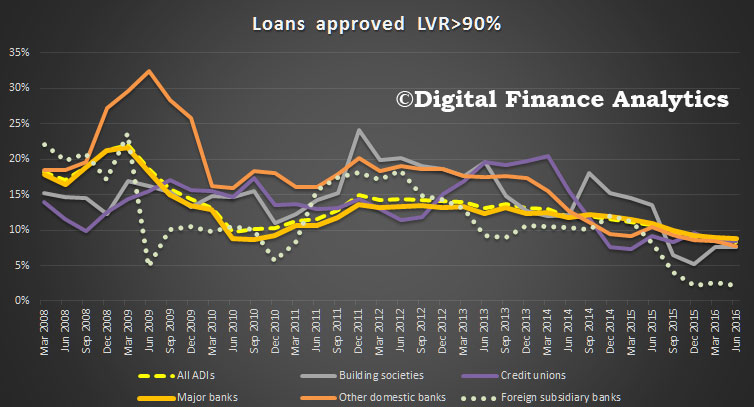
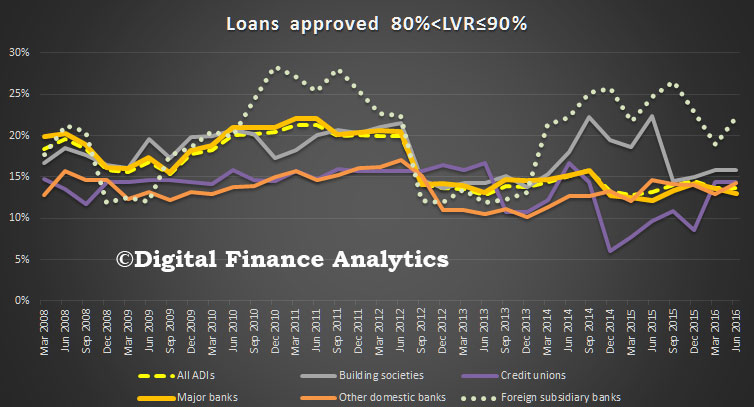 Over 90% LVR, and these would generally be the more risky loans, we see the volume falling, with foreign banks lending the least.
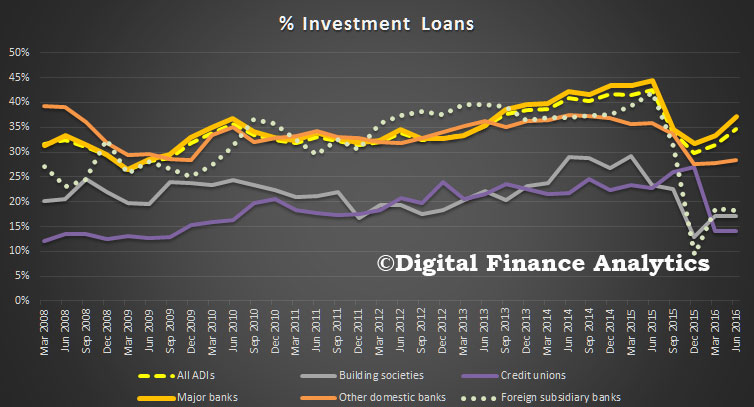
 Turning to investment loans by lender type, the major banks are lending more than other types of ADI, in percentage terms, well ahead of other domestic banks as well as credit unions and building societies. In the last quarter, major banks grew their books more than in the previous quarter.
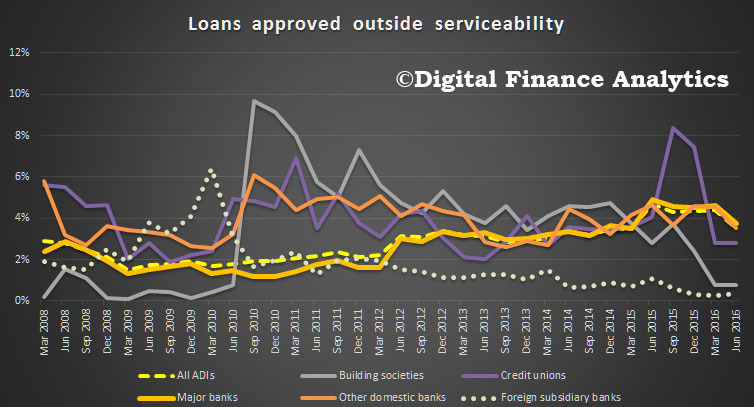
 Loans approved outside serviceability are down, but major banks are still lending more loans outside normal terms – reflecting competition in the sector and a need to write business. Credit unions have fallen back into line from their peak last year.
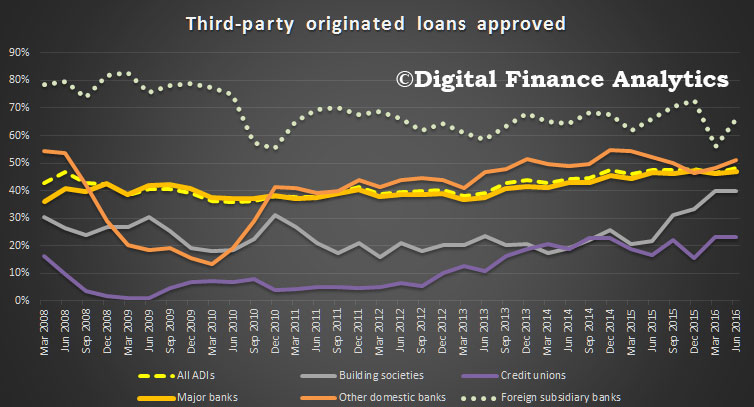
 Foreign banks have more of their loans originated by brokers, followed by the other non-major domestic banks. Credit unions are the least likely to use brokers.
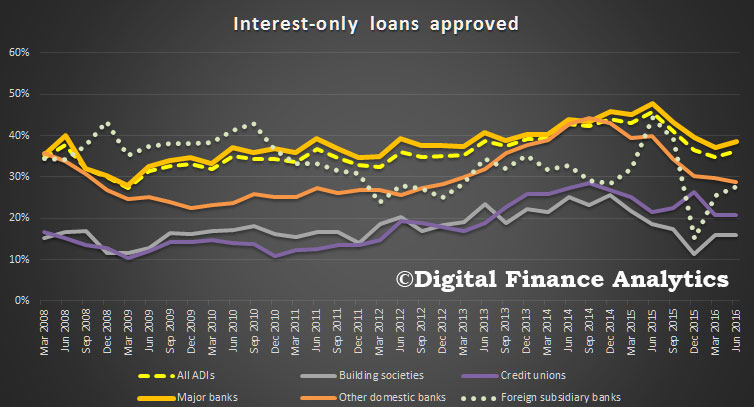
 Finally, we see that the major banks are writing a larger share of interest only loans. Non-major banks appear to have ratcheted down their interest only lending, though foreign banks are on the up.
 So, overall what can we conclude? First, loans are still being written, and there is strong competition across the sector. Major banks are growing their books the strongest. The volume of investment loans is rising, and more loans are being originated by brokers and third party channel. We are seeing the regulator in action, as the number of high-LVR loans are down. However, we think more intervention is still required to tame the home lending beast.
Also, bear in mind that some of the high LVR and non-conforming “slack” are being taken up by the non-bank sector. These loans do not form part of the APRA report, or supervision.