AMP Bank reduces variable rate home loans by 0.2%

AMP Bank has announced it will reduce interest rates  across all variable rate home loans by 20 basis points, effective Monday 23 May  2016.

The AMP Bank standard variable home  loan interest rate for owner occupied loans will reduce to 5.53 per cent per annum (comparison rate 5.70 per cent per annum) and to 5.82 per cent per annum (comparison rate 5.99 per  cent per annum) for investment property loans.

For new owner occupied home loans the  AMP Essential Home Loan variable rate will reduce to 3.88 per cent per annum  (comparison rate 3.90 per cent per annum).

The Professional Package variable  rate for new owner occupied term loans $750,000 and above will drop to 3.95 per  cent per annum (comparison rate 4.31 per cent per annum).

The Basic Package variable rate for  new investor property loans will reduce to 4.37 per cent per annum (comparison rate 4.41 per cent per annum).

The AMP SuperEdge variable rate for  new SMSF residential property loans will reduce to 5.67 per cent per annum (comparison rate 5.93 per cent per annum).


AMP reports A$972 million net profit for FY 15

AMP has reported a net  profit of A$972 million for the full year to 31 December 2015 , up 10 per cent on A$884 million for FY 14. Underlying profit  was A$1,120 million compared  with A$1,045 million for FY 14, up 7 per cent year on year, with good earnings growth particularly in Australian wealth management, AMP Capital, AMP Bank and New Zealand.

Underlying  return on equity: increased 0.5 percentage  points to 13.2 per cent in FY 15 from FY 14, largely reflecting the increase in  underlying profit.

The 7% increase in FY 15 underlying profit was largely the result of good operating earnings growth in Australian wealth management (+10%), AMP Capital (+20%), AMP Bank (+14%) and New Zealand financial services (+9%). FY 15 Australian wealth protection operating earnings fell 2%, impacted by experience losses of A$11m over the year, while Australian mature operating earnings declined 9%, largely due to the expected portfolio run-off. Underlying investment income fell A$7m on FY 14 to A$125m, reflecting lower average shareholder funds in FY 15.

Total controllable costs rose A$14 million to A$1,329  million as increased investment in growth initiatives and currency movements  were largely offset by the benefits of the business efficiency program.The group cost to income ratio improved 1 percentage point from FY 14 to 43.8  per cent in FY 15.

Momentum continued across Australian wealth management and AMP Capital, which delivered a particularly strong result as their international investment management profile expands, both in China and more  broadly.

Retail and corporate super net  cashflows on AMP platforms increased 5 per cent to A$3,784 million.

AMP Capital external net cashflows were A$4,434  million, up 19 per cent from A$3,723 million in FY 14,  driven by   stronger inflows generated through the   China Life AMP Asset Management  joint venture, institutional and retail domestic clients.

Australian wealth management operating earnings for FY 15 were A$410 million, up 10 per cent compared with FY 14, driven by strong net cashflows leading to a 10 per  cent growth in AUM.

Australian wealth protection operating earnings were A$185 million in FY 15 compared with A$188 million in FY 14.  Claims experience reflected the continued roll out of the new claims approach, reversion to long term assumptions and volatility in the second half of the  year.

  • AMP  Capital: The delivery of key priorities for the year, coupled with strong investment performance, drove 20 per cent growth in  operating earnings and improvement in total net cashflows of A$1.4 billion compared to FY 14.
  • Expanding  global footprint: AMP Capital increased FUM managed on behalf of international institutional clients by more than A$2.0 billion  to A$6.8 billion during the year, which included growth in the global  infrastructure platform. AMP’s relationship with China Life and MUTB remains strong.  The financial performance of the joint ventures with China Life are  ahead of expectations.
  • AMP Bank: The bank’s  growth momentum continues with operating earnings increasing by 14 per cent to A$104 million in FY 15 from an improved net interest margin and growth in the loan book.  Net interest margin was 1.59% for FY 15, up 18 basis points from FY 14 and up 6 basis points from 1H 15. AMP Bank’s return on capital was 16.5%, up 1.3 percentage points from FY 14 (15.2%). Customer deposit to loan ratio was 63% for FY 15, compared with 64% for FY 14. The Capital Adequacy Ratio (CAR) was 12.8% as at FY 15 (12.2% at FY 14). The Common Equity Tier 1 Capital Ratio for FY 15 was 7.9% (9.3% at FY 14). This reduction is the result of a capital return to the group of A$100m of common equity, following the on-lend of Additional Tier 1 capital from the AMP Wholesale Capital Notes issued in March 2015. Both ratios remain well above APRA and internal thresholds. The Bank is compliant with the Basel III capital requirements, which took effect from 1 January 2016.
  • New  Zealand: Operating earnings in New Zealand increased 9 per cent, reflecting strong growth in profit margins and experience. Learnings from Australian claims management were used to help drive good experience outcomes.  KiwiSaver is a key growth engine for the wealth management business. NZFS was the third largest KiwiSaver provider with 13% of the total KiwiSaver market as at June 2015 and had approximately 245,000 KiwiSaver customers. In FY 15, KiwiSaver had NZ$3.9b in AUM, an increase of 13% from FY 14.
  • Business  efficiency program: During FY 15, AMP continued to deliver on the three year business efficiency program, which is targeting recurring cost savings of A$200m (pre-tax) per annum (80% controllable costs and 20% variable costs). The estimated one-off cost of implementation is A$320m (pre-tax) or A$224m on a post-tax basis. During FY 15, costs incurred were A$66m post-tax. The expected pattern of post‑tax
    expenditure over FY 16, the final year of the program, is A$19m.
  • Face-to-face  advice of the future: The development of a new goals based face-to-face advice experience continued, with positive results in FY 15 from five pilot sites. The trial is being expanded in FY 16 as part of AMP’s ambition to set a benchmark for high quality, professional advice.

AMP maintained its strong capital position with a surplus of A$2.5 billion at 31 December 2015, above minimum regulatory requirements. The increase was driven by retained profits,  the successful issuances of AMP Wholesale Capital Notes and AMP Capital Notes.

AMP-FY15AMP intends to redeem the AXA Notes on 29 March 2016 when they  cease to be eligible capital under the subordinated transitional arrangements  provided by APRA.  This will reduce  capital resources above minimum regulatory requirements by A$600 million.

AMP maintains a strong balance sheet, with little change to  gearing and access to significant liquidity.

The Board has declared a 4 per cent increase to the final  dividend to 14 cents per share, compared with 13.5 cents per share for the 2014  final dividend. This represents a payout  ratio of 75 per cent of underlying profit.

The 2015 final dividend will be franked at 90 per cent, up from  80 per cent in 2014 with the unfranked amount being  declared as conduit foreign income. AMP has revised its future dividend policy to a target range of 70 to 90 per cent of underlying profit reflecting confidence  in the financial strength of the group.

AMP Bank reduces variable and fixed rate loans

AMP Bank has announced will reduce interest rates across a number of variable and fixed rate loans for new customers, effective Monday 18 January 2016.

The AMP Essential variable rate loan will be reduced by 30 basis points to 4.08 per cent
per annum (comparison rate 4.10 per cent per annum).

The Basic 3 year fixed rate will drop by 27 basis points to 4.28 per cent per annum (comparison rate 4.32 per cent per annum).

The variable rate on new investor property loans for the Basic loan will reduce by 40 basis points to 4.57 per cent per annum (comparison rate 4.61 per cent per annum).

The Basic 3 year fixed rate for new investor property loans is reducing by 45 basis points to 4.57 per cent per annum (comparison rate 4.61 per cent per annum).

Australian Household Debt Reaches Record Highs at $245,000

Average Australian household debt is four times what it was in 1988, rising from $60,000 to $245,000 after inflation, according to the latest AMP.NATSEM Income and Wealth report – Buy now, pay later: Household debt in Australia.

AMP-DebtThe ratio of household debt to disposable income has almost tripled, from 64 per cent to 185 per cent during the same time. Declining interest rates, low unemployment and a strong economy have driven Australians to take on more debt and at the same time cushioned the impact of repayments.

But if interest rates were to rise by 2.5 percentage points, interest payments for Australia’s most indebted households with mortgages would rise to at least 58 per cent of household income, up from the current 42 per cent. These households would need to find an extra $16,615 a year just to cover interest payments, which would increase from $43,926 to $60,541 a year. For households with mortgages and typical levels of debt, a 2.5 percentage point increase would mean debt repayments would rise from 16 per cent to 23 per cent of income, taking annual interest payments from $15,464 to $21,687, or an extra $6,223 per year.AMP-Debt-2

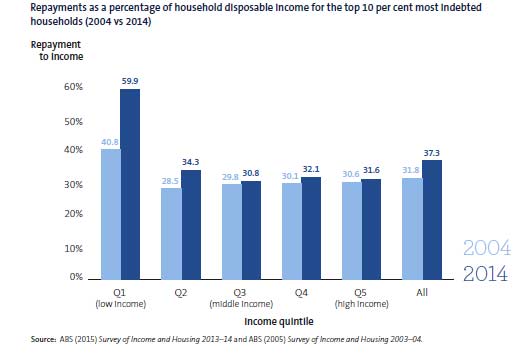
Other findings from the report include:
• Typical households headed by 30 to 50 year olds have been hit the hardest with their debt to income increasing from 149 per cent to 209 per cent during the past 10 years.
• For people aged over 65, mortgages make up almost a third of their household debt – up significantly from 20 per cent 10 years ago.
• For low-income households, debt is 43 per cent of their disposable income, almost doubling since 2004.
• The top 10 per cent most leveraged Australian households now have an average debt to disposable income ratio of 600 per cent.

Household debt in Australia has increased considerably
• In 1988, the average household could have paid off all its debt with the after-tax income it earned in eight months – it would now take almost two years.
• Australian household debt has grown at 5.3 per cent above inflation each year, outstripping income growth of 1.3 per cent.
• Australia’s most leveraged households have six times as much debt as their annual disposable income.

Australians are taking more debt into retirement
• Of the top 10 per cent most indebted households, it’s the over 65 year old households that have increased their level of debt the most – their repayments to income have almost doubled from 9 to 17 per cent.

First home buyers are taking on considerably more debt
• Rising house prices have seen first home buyers doing it tough with their debt levels at 3.6 times their annual disposable income, up from 3.1 since 2004.
• Typical first homebuyers would feel the greatest impact from rising interest rates – a 2.5 percentage point rise in rates would increase interest repayments as a percentage of disposable income from 21.2 per cent to 30.2 per cent or an extra $8,047 a year.

Lower income families have also taken on a lot more debt
• Among the top 10 per cent of indebted households, low-income households are in the most vulnerable position with their interest payments increasing from 40.8 per cent to 59.9 per cent of disposable income during the past 10 years.

The debt picture is precarious for the most leveraged households
• Australia’s debt boom has impacted all households, but it is the most indebted who have ramped up their leverage the most – for households with the top 10 per cent of debt levels, debt to income has increased from 4.4 to six times income, compared to the typical household which increased from 0.7 to 0.88 times income.

Australian households are among the most indebted in the world
• Australian households have the fifth highest debt levels in the world, with more average household debt than comparable economies like Canada.

Mortgage debt is highest for households headed by a 30-50 year old and over 65s have the most investor debt
• Home mortgages make up almost 63 per cent of debt for households headed by a person aged 30 to 50.
• Investor debt is highest for over 65 year old households at almost 60 per cent of their total debt.

Ninety per cent of Australian household debt is being used to buy a home or to build wealth through investing
• 56 per cent on mortgage and 36 per cent on investing (e.g. rental properties or shares).

Many Australian households experience financial stress
• A quarter of Australians currently experience financial stress from things like paying bills, raising emergency money or having to ask friends for financial assistance.
• Low income families experience six times the rate of financial stress than higher income families.

Single parents face significant financial stress
• Nearly two in three single parents are facing at least one financial stress, compared to just 13 per cent of couples who have children.
• Single parents are 10 times more likely to be experiencing at least three forms of financial stress compared to couples with children.

Regions with the highest typical repayment to income are in the outer suburbs of Sydney, Perth and Melbourne
• For households with the top 10 per cent of debt, it’s the inner city suburbs of Sydney, Perth and Melbourne with the highest repayment to income.

Tasmania and NSW households have the greatest share of mortgage debt
• As a share of debt, mortgage debt is highest in Tasmania, with almost 66 per cent of household debt tied to mortgages and New South Wales has the second highest level of mortgages at just over 58 per cent of total debt.
• The combined territories (Australian Capital Territory and Northern Territory) have the lowest share of mortgage debt at almost 50 per cent.
• Investor debt is highest in Australia’s territories, at 44 per cent, followed by Queensland and Western Australia at around 38 per cent each.

Of the most leveraged households (those with the top 10 per cent of debt) debt is 5.4 times household income in New South Wales, but Western Australia leads the way with debt levels at 6.1 times household income
• Highly leveraged households in the combined territories carry debt levels 5.7 times annual income and for Queensland households debt comes in at 5.5 times income.

Regions with the highest typical debt repayment burden are found in the outer ring suburbs of major capital cities
• Looking at households with typical repayments in each region, households in northern Perth are the most burdened with interest repayments at $15,100 per year or 14 per cent of disposable income. A 2.5 percentage point increase would push up repayments by $6,400 a year.

AMP publishes these reports to help the community make informed financial and lifestyle decisions and to contribute to important social and economic policy debate.

AMP Bank Returns to the Investment Mortgage Market

AMP Bank has announced it will accept investor property loan applications effective 16 November following a temporary withdrawal from the market in response to regulatory growth guidelines.

The return to investor property  lending is in line with AMP Bank’s commitment to return to the market in 2015.

Investor property lending to SMSFs  remains on hold in order to meet AMP Bank’s regulatory commitment for the SMSF  portfolio. The bank is expected to return to SMSF lending later this year.

AMP Cuts Home Loan Rate

Continuing the theme of heightened competition in the owner occupied lending space, AMP Bank has announced it will reduce the variable rate for new owner occupied loans on the AMP Essential Home loan to 3.99 per cent, making it one of the most competitive in the market.

The variable Professional Pack Home loan will also be reduced to 3.99 per cent for loans over $750,000 and with a Loan to Value Ratio (LVR) of less than 80 per cent.

The changes are effective Monday 12 October and will apply until 30 November 2015.

AMP Bank reduces owner occupied home loan rates

Another non-major lender, AMP Bank has reduced interest rates  across variable and fixed home loans for new customers making them some of the most competitive in the market.

The AMP Essential Home Loan will be  reduced to 4.09 per cent per annum, down from 4.20 per cent.

The Basic variable will be reduced to  4.19 per cent per annum, down from 4.50 per cent.

In addition, the Basic two year fixed  rate loan will be reduced to 4.18 per cent, down from 4.55 per cent.

The changes to the Basic variable and  fixed loans provide an attractive option for customers who may wish to split their loan and pay a portion fixed and a portion variable.

The rate changes are in line with AMP  Bank’s commitment to help more Australians own their own homes.

The changes are effective Sunday 30 August for fixed and Monday 31 August for variable rates and are available for new loan applications.

AMP reports A$507 million net profit for 1H 15

AMP Limited has reported strong growth and a net profit of A$507 million for the half year to 30 June 2015, up 33 per cent on A$382 million reported for 1H 14. Underlying profit was A$570 million compared with A$510 million for 1H 14, up 12 per cent half on half.

AMP Australian wealth management net cash-flows were  A$1.2 billion in 1H 15, up A$36 million on net cash flows  of A$1.1 billion in 1H 14.  Total cash flows on AMP platforms continue to perform strongly, growing 11 per cent to  A$1.9 billion in 1H 15.  These flows were  partially offset by higher net cash outflows on external platforms of A$774  million.

AMP Capital external net cash-flows were A$3.0 billion, an increase of A$1.4 billion from net cashflows of A$1.6 billion for 1H 14.  This was driven by stronger inflows generated by the China Life AMP Asset Management joint venture as well as institutional and retail domestic client flows.

The cost to income ratio was 43.1 per cent for 1H 15, an improvement of 1.9 percentage points on 1H 14. Controllable costs increased 1.1 per cent.

Underlying  return on equity increased 1 percentage point  to 13.5 per cent in 1H 15, largely reflecting the increase in underlying  profit.

AMP has A$2.3 billion capital above minimum regulatory requirements at 30 June 2015, up from A$2.0 billion at 31 December 2014. The increase is due to retained profits and  the AMP Wholesale Capital Notes issuance, but partially offset by  AMP’s investment in China Life Pension Company in Q1 2015.

The Board has declared a 12 per cent increase to the interim dividend to 14 cents per share compared with 12.5 cents per share for the 2014 interim dividend. This represents a payout ratio of 73 per cent of underlying profit and is within AMP’s target range of paying 70-80 per cent.

Segmentals:

  1.  AMP Capital: Operating  earnings increased 26 per cent reflecting stronger performance fees and  supportive market conditions for much of the half.  There was a A$1.4 billion improvement in  external net cashflows  to A$3.0  billion, strong investment performance led by flagship funds and the continued  success of the internationalisation of the business.  The cost to income ratio of 58.7 per cent is  below the target range of 60-65 per cent largely because of strong performance  fees in 1H 15.
  2. North AUM grew 16 per cent to A$18.6 billion: Customer  numbers increased 14 per cent on the North platform to  over 87,000 and North AUM increased A$2.6 billion to     A$18.6 billion since December 2014.  However net cashflows fell 4 per cent to A$2.3  billion for 1H 15 largely as a result of more pension customers drawing down an  income stream.
  3. AMP Bank delivered A$50 million operating earnings, up 19  per cent compared with 1H 14, reflecting an increase in residential mortgages  and improved net interest margin. AMP  aligned advisers contributed almost a quarter of new business in a period of  intense competition.
  4. New Zealand operating earnings of A$61  million, up 11 per cent compared with 1H 14, reflecting a turnaround in  experience, favourable currency movements and costs being tightly managed.  Cashflows continue to reflect the success of KiwiSaver, with KiwiSaver AUM up 20 per cent to NZ$3.7 billion.
  5. In wealth management, operating earnings for 1H 15 were up 13 per cent compared with 1H 14, reflecting stronger net cashflows and investment returns alongside a continued focus on managing costs.
  6. In wealth protection, operating earnings were A$99 million, up 9 per cent half on half, reflecting the impact of management actions. The environment continues to be volatile however claims and lapse outcomes remain in line with best estimate assumptions.

Future of  advice strategy: A package of measures to lift the quality of  advice is underway alongside a new approach to advice being piloted with  encouraging results from consumer testing in five locations. AMP continues to invest in service, platforms  and digital capability to improve adviser quality and productivity.  Australian adviser numbers are stable at 3,762 in a period of considerable change.

AMP Lifts Profit 32%

AMP Limited has reported a net profit of A$884 million for the full year to 31 December 2014,, up 32 per cent on A$672 million reported for FY 13. In response AMP’s share price rose to a five year high. Their banking division has grown on the back of a 9% rise in mortgage lending.

Underlying profit was A$1,045 million compared with A$849 million for FY 13, up 23 per cent year on year, driven by double digit growth in operating earnings across all contemporary businesses.

AMP-ProfitThe Board has declared a 17 per cent increase to the final dividend to 13.5 cents per share compared with 11.5 cents per share for the 2013 final dividend. This represents a FY 14 payout ratio of 74 per cent of underlying profit and is within AMP’s target range of paying 70 to 80 per cent of underlying profit.

The group cost to income ratio was managed tightly to 44.8 per cent for FY 14, down from 49.4 per cent in FY 13. Controllable costs increased 1.1 per cent and are tracking in line with guidance having been impacted positively by the business efficiency program.

Australian wealth management net cashflows were A$2.3 billion in FY 14, up A$115 million on net cashflows of A$2.2 billion in FY 13. AUM rose 9 per cent over the year to $109.5 billion, against a relatively flat Australian market. Total net cashflows on AMP platforms continue to perform strongly, growing 35 per cent to A$3.6 billion in FY 14.  AMP Capital external net cashflows were A$3.7 billion, a A$4.8 billion improvement from net cash outflows of A$1,039 million in FY 13.

Underlying return on equity: Increased to 12.7 per cent in FY 14 from 10.7 per cent in FY 13, reflecting the 23 per cent increase in underlying profit.

In Australian wealth management, operating earnings for FY 14 were up 13 per cent compared with FY 13, reflecting higher net cashflows supporting good growth in AUM and disciplined cost control in a growing business.

Australian wealth protection has recovered well with operating earnings of A$188 million compared with A$64 million in 2013.

AMP Capital’s improved performance: Operating earnings increased 16 per cent reflecting strong fee growth and investment returns. The internationalisation of the business drove this with global investors attracted by leading infrastructure and property capabilities alongside new inflows generated by the China Life AMP Asset Management joint venture and improved flows from the MUTB alliance. The cost to income ratio of 63 per cent was within AMP Capital’s target range of 60 to 65 per cent.

Seventh quarter of more than A$1 billion net cashflows on North platform: Net cashflows improved 34 per cent to A$5.5 billion for FY 14 and North AUM grew 66 per cent to A$16 billion since December 2013. North also had 50 per cent growth in customers with a total of over 76,000 customers on the platform in 2014.

AMP Bank: The bank delivered A$91 million in operating earnings, up 10 per cent compared with FY 13, reflecting an increase in residential mortgages with AMP growing above system in an intensely competitive environment and AMP aligned advisers contributing a quarter of new business. Total revenue increased 12% in FY 14 on FY 13, driven mainly by growth in the loan portfolio and improved net interest margin.

AMP Bank maintained a competitive lending position, with the total loan book growing by A$1,169m to A$14.5b in FY 14, an increase of 8.8% on FY 13. Residential mortgage competition remained intense in the period, with continued market-wide discounting. AMP Bank’s focus on pricing enhancements and productivity from key channels, contributed to deliver above system residential mortgage book growth of A$1,117m (9%) in FY 14 to A$14.0b. Strong growth was delivered through both the broker and AMP aligned adviser channels. The AMP aligned adviser channel now contributes 25% of AMP Bank’s mortgage new business, up from 19% in FY 13.Owner occupied loans made up 62% of the mortgage portfolio at 31 December 2014, while investment property loans were 38%

Customer deposits increased over FY 14 by A$0.5b (6%) to A$9.2b. The deposit growth was primarily driven by AMP Bank’s Notice Saver Account and the North Platform, offset by a reduction in both term deposits and deposits sourced from financial institutions. Customer deposit to loan ratio was 64% for FY 14, compared with 66% for FY 13

Net interest margin was 1.41% for FY 14, up 2 bps from FY 13 and up 6 bps from 1H 14, aided by improved cost of wholesale funding during the period, targeted use of discounting and enhanced liquidity managemen. AMP Bank’s credit policy remains conservative and has not been relaxed to achieve growth. Asset quality remains strong, with mortgages in arrears (90+ days) at 0.42% as at December 2014 (0.37% as at December 2013). Loan impairment expense to gross loans and advances was 0.01% in FY 14.

AMP Bank’s variable costs increased by A$9m (18%) in FY 14, largely attributable to higher commission payments, mortgage acquisition and securitisation financing costs. AMP Bank’s controllable costs increased A$6m (12%) to A$56m in FY 14, from A$50m in FY 13, due to investments in technology, product development and operating capability to support the growth in lending and improvements to customer service levels. AMP Bank’s cost base will continue to rise as it invests to support growth. The cost to income ratio increased by 0.7 percentage points to 30.3% in FY 14 from 29.6% in FY 13.

The Capital Adequacy Ratio (CAR) was 12.2% at FY 14, (11.8% at FY 13). The Common Equity Tier 1 Capital Ratio at FY 14 was 9.3% (8.7% at FY 13). Both ratios remain well above APRA and internal thresholds. AMP Bank is building its capital holdings to ensure compliance with Basel III capital requirements upon implementation in 2016

New Zealand achieved improved cashflows: Operating earnings of A$110 million, up 13 per cent compared with FY 13, reflecting growth in profit margins, experience profits and favourable currency movements.

Future of advice strategy: A package of measures to lift the quality of advice is being introduced along with a new approach to advice being piloted in five locations. AMP is also investing in services, platforms and digital capabilities to improve adviser quality and productivity. Australian adviser numbers are up slightly at 3,844 in a period of regulatory uncertainty.

AMP continues to hold an appropriate capital surplus, with A$2.0 billion capital above minimum regulatory requirements at 31 December 2014, down from A$2.1 billion at 31 December 2013. The decrease was driven by the redemption of AMP Notes and the impact of falling bond yields, partially offset by retained profits and other capital impacts.