
AMP has reported a net profit of A$972 million for the full year to 31 December 2015 , up 10 per cent on A$884 million for FY 14. Underlying profit was A$1,120 million compared with A$1,045 million for FY 14, up 7 per cent year on year, with good earnings growth particularly in Australian wealth management, AMP Capital, AMP Bank and New Zealand.
Underlying return on equity: increased 0.5 percentage points to 13.2 per cent in FY 15 from FY 14, largely reflecting the increase in underlying profit.
The 7% increase in FY 15 underlying profit was largely the result of good operating earnings growth in Australian wealth management (+10%), AMP Capital (+20%), AMP Bank (+14%) and New Zealand financial services (+9%). FY 15 Australian wealth protection operating earnings fell 2%, impacted by experience losses of A$11m over the year, while Australian mature operating earnings declined 9%, largely due to the expected portfolio run-off. Underlying investment income fell A$7m on FY 14 to A$125m, reflecting lower average shareholder funds in FY 15.
Total controllable costs rose A$14 million to A$1,329 million as increased investment in growth initiatives and currency movements were largely offset by the benefits of the business efficiency program.The group cost to income ratio improved 1 percentage point from FY 14 to 43.8 per cent in FY 15.
Momentum continued across Australian wealth management and AMP Capital, which delivered a particularly strong result as their international investment management profile expands, both in China and more broadly.
Retail and corporate super net cashflows on AMP platforms increased 5 per cent to A$3,784 million.
AMP Capital external net cashflows were A$4,434 million, up 19 per cent from A$3,723 million in FY 14, driven by stronger inflows generated through the China Life AMP Asset Management joint venture, institutional and retail domestic clients.
Australian wealth management operating earnings for FY 15 were A$410 million, up 10 per cent compared with FY 14, driven by strong net cashflows leading to a 10 per cent growth in AUM.
Australian wealth protection operating earnings were A$185 million in FY 15 compared with A$188 million in FY 14. Claims experience reflected the continued roll out of the new claims approach, reversion to long term assumptions and volatility in the second half of the year.
- AMP Capital: The delivery of key priorities for the year, coupled with strong investment performance, drove 20 per cent growth in operating earnings and improvement in total net cashflows of A$1.4 billion compared to FY 14.
- Expanding global footprint: AMP Capital increased FUM managed on behalf of international institutional clients by more than A$2.0 billion to A$6.8 billion during the year, which included growth in the global infrastructure platform. AMP’s relationship with China Life and MUTB remains strong. The financial performance of the joint ventures with China Life are ahead of expectations.
- AMP Bank: The bank’s growth momentum continues with operating earnings increasing by 14 per cent to A$104 million in FY 15 from an improved net interest margin and growth in the loan book. Net interest margin was 1.59% for FY 15, up 18 basis points from FY 14 and up 6 basis points from 1H 15. AMP Bank’s return on capital was 16.5%, up 1.3 percentage points from FY 14 (15.2%). Customer deposit to loan ratio was 63% for FY 15, compared with 64% for FY 14. The Capital Adequacy Ratio (CAR) was 12.8% as at FY 15 (12.2% at FY 14). The Common Equity Tier 1 Capital Ratio for FY 15 was 7.9% (9.3% at FY 14). This reduction is the result of a capital return to the group of A$100m of common equity, following the on-lend of Additional Tier 1 capital from the AMP Wholesale Capital Notes issued in March 2015. Both ratios remain well above APRA and internal thresholds. The Bank is compliant with the Basel III capital requirements, which took effect from 1 January 2016.
- New Zealand: Operating earnings in New Zealand increased 9 per cent, reflecting strong growth in profit margins and experience. Learnings from Australian claims management were used to help drive good experience outcomes. KiwiSaver is a key growth engine for the wealth management business. NZFS was the third largest KiwiSaver provider with 13% of the total KiwiSaver market as at June 2015 and had approximately 245,000 KiwiSaver customers. In FY 15, KiwiSaver had NZ$3.9b in AUM, an increase of 13% from FY 14.
- Business efficiency program: During FY 15, AMP continued to deliver on the three year business efficiency program, which is targeting recurring cost savings of A$200m (pre-tax) per annum (80% controllable costs and 20% variable costs). The estimated one-off cost of implementation is A$320m (pre-tax) or A$224m on a post-tax basis. During FY 15, costs incurred were A$66m post-tax. The expected pattern of post‑tax
expenditure over FY 16, the final year of the program, is A$19m.
- Face-to-face advice of the future: The development of a new goals based face-to-face advice experience continued, with positive results in FY 15 from five pilot sites. The trial is being expanded in FY 16 as part of AMP’s ambition to set a benchmark for high quality, professional advice.
AMP maintained its strong capital position with a surplus of A$2.5 billion at 31 December 2015, above minimum regulatory requirements. The increase was driven by retained profits, the successful issuances of AMP Wholesale Capital Notes and AMP Capital Notes.
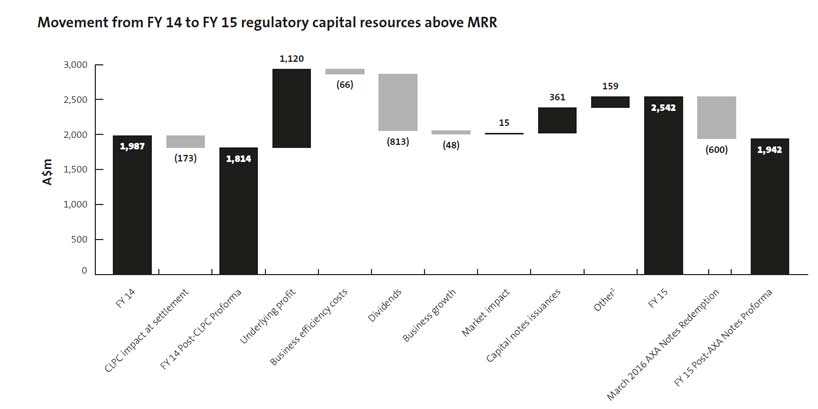 AMP intends to redeem the AXA Notes on 29 March 2016 when they cease to be eligible capital under the subordinated transitional arrangements provided by APRA. This will reduce capital resources above minimum regulatory requirements by A$600 million.
AMP maintains a strong balance sheet, with little change to gearing and access to significant liquidity.
The Board has declared a 4 per cent increase to the final dividend to 14 cents per share, compared with 13.5 cents per share for the 2014 final dividend. This represents a payout ratio of 75 per cent of underlying profit.
The 2015 final dividend will be franked at 90 per cent, up from 80 per cent in 2014 with the unfranked amount being declared as conduit foreign income. AMP has revised its future dividend policy to a target range of 70 to 90 per cent of underlying profit reflecting confidence in the financial strength of the group.