ANZ Trading Update to 30 June 2015

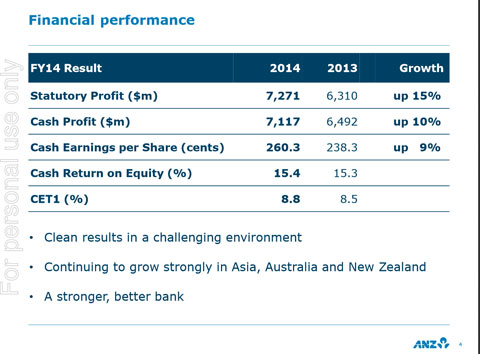
ANZ’s unaudited cash profit for the 9 months to 30 June 2015 was $5.4 billion up 4% and unaudited statutory net profit was $5.58 billion up 11%. Profit before Provisions over the same period grew 5.1% (+3.4% on a constant Foreign Exchange (FX adjusted) basis).

Revenue expense jaws were tracking broadly neutral on a constant FX basis. Revenue and expense growth trends compared to PCP were broadly similar to the first half 2015 experience, though revenue growth was a little stronger and expense trends improved slightly.

Customer deposits grew 9.5% (+5% FX adjusted) with net loans and advances up 7.7% (+5.4% FX adjusted).

The Group Net Interest Margin at the end of the third quarter was broadly stable on the end of the first half assisted somewhat by slower growth in lower margin liquid asset holdings and positive trends in funding costs which offset asset price competition.

Gross Impaired Assets have decreased 3% over the nine months to 30 June 2015. The total provision charge of $877 million or 21 bps increased 13%. While loss rates are expected to remain well under the long term average, ANZ estimates that the total impairment charge for FY15 will be ~$1.2bn, or 21 bps compared to 19 bps in FY14.

The Individual Provision Charge declined 12.5% to $750m and while the Collective Provision Charge increased it remained at a relatively low level in absolute terms at $127m. The Financial Year to date has seen a normalisation of the risk profile component of the Collective Provision Charge with a moderate number of credit downgrades being recorded whereas the prior corresponding period in 2014 saw a higher level of upgrades.

The movement in the risk profile component of the Collective Provision Charge in 2015 reflects ongoing macro-economic stress including in the resources and agriculture sectors. The contribution to the collective provision from portfolio growth was broadly steady period on period.

At 30 June 2015 ANZ’s reported APRA Common Equity Tier-1 (CET1) ratio was 8.6%. Following the completion of the $2.5bn Institutional placement, the June 2015 pro-forma APRA CET 1 ratio was 9.2%.

On the basis that $500 million is raised under the Share Purchase Plan, on the same pro-forma basis this would add a further 13 bps increasing the CET1 Ratio to 9.3%. ANZ has no plans to underwrite the FY15 Dividend Re-investment Plan.

ANZ has one tranche of ~$400m of ANZ Wealth Australia Limited debt remaining which matures in March 2016. This tranche will not be refinanced. The 10 bps impact is expected to be offset through capital management efficiencies.

The recent capital raising has allowed ANZ to deal with the known regulatory changes and position ANZ’s capital position within the top quartile of international peers. ANZ is liaising with APRA in regards to detailing its internationally comparable capital position, on the basis of current information, we expect our internationally comparable CET1 ratio to be around 13%. ANZ’s Liquidity Coverage Ratio improved from 119% to 121% during the third quarter ending 30 June 2015.

Looking at the segmentals:

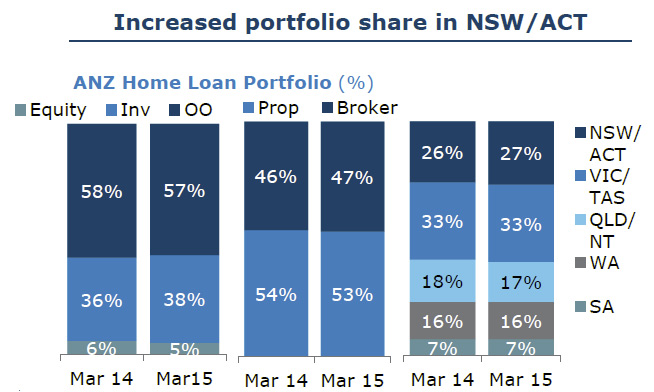
The Australia Division’s strong performance from the first half has continued with ongoing momentum in lending and deposit flows, margins well managed and customer numbers increasing by circa 5% in both the Retail and Commercial businesses. The Retail business has delivered strong growth in both home lending and credit cards and the Commercial business is also seeing good lending growth, especially in Small Business Banking, with improved trends in the Corporate and Business Banking segments.

The New Zealand Division is delivering strong balance sheet growth with above market performance in Mortgages, Business Lending and Deposits. Revenue growth was underpinned by continued high levels of customer acquisition and brand consideration and an improved digital offering.

Positive underlying performance continued across the key businesses in the Global Wealth Division with strong in-force premiums growth, stable claims and lapse experience plus growth in Funds Under Management. Global Wealth innovations – in physical, digital and personal – continue to deliver simple accessible wealth solutions improving how customers think about their financial wellbeing.

International and Institutional Banking continues to perform well in difficult operating conditions arising from macro-economic factors such as the ongoing global liquidity surplus and weak commodity prices. Income in the Global Markets Business was up 6% to $1.8 billion. Customer sales grew 9% led by strong results in Asia and customer facing revenue remains at over 75% of the total Global Markets income. The Trade and Supply Chain business margin stabilised in the third quarter having been impacted by falling commodity prices. Cash Management


ANZ Announces Capital Raising, and Glimpse Of Trading Update

ANZ today announced a fully underwritten institutional share placement to raise $2.5 billion.

The Placement will be followed by an offer to ANZ’s eligible Australian and New Zealand shareholders who will have the opportunity to participate in a Share Purchase Plan (SPP) to raise around $500 million. The SPP is not underwritten.

The Institutional Placement and SPP will allow ANZ to more quickly and efficiently accommodate additional capital requirements recently announced by the Australian Prudential Regulation Authority (APRA), in particular the increase in average credit risk weights for major bank Australian mortgage portfolios to 25% taking effect from 1 July 2016.

ANZ’s shares have been placed in a trading halt with trading expected to resume at 10.00am on 7 August 2015.

On a 30 June 2015 pro-forma basis, the placement would add approximately 65 basis points (bps) to ANZ’s CET1 Capital Ratio increasing it to 9.2%. If $500 million is raised under the SPP, on the same pro-forma basis this would add a further 13 bps increasing the CET1 Capital Ratio to 9.3%. This capital raising should position ANZ Capital Ratio in the top quartile of international banks on an internationally harmonised basis, the bank said.

ANZ will release a scheduled Trading Update on 18 August. Ahead of that and to accompany today’s capital raising announcement ANZ advises the following financial results on an unaudited basis:

  • For the nine month period to 30 June 2015, Cash Profit was $5.4 billion, an increase of 4.3% on the same period in 2014 ($5.18 billion). Profit before Provisions over the same period grew 5.1% (+3.4% on a constant Foreign Exchange (FX) basis).
  • On a constant FX basis for the nine month period to 30 June 2015, revenue expense jaws were broadly neutral. Revenue for the three months to 30 June 2015 grew at a slightly faster rate than in the first half, while expense growth for the three month period slowed.
  • The total provision charge for the nine month period to 30 June 2015 was 13% higher at $877 million. While the Individual Provision charge reduced 12.5%, the Collective Provision charge increased due to balance sheet growth coupled with some risk grade migration related to the resources and agriculture sectors. For the Full Year 2015, while loss rates are expected to remain well under the long term average, ANZ estimates that the total loss rate will be around 21 bps equating to a total provision charge of circa $1.2 billion given increased collective provisioning.
  • Customer Deposits for the nine month period to 30 June 2015 grew 9.5% (+5% FX adjusted) with net loans and advances increasing 7.7% (+5.4% FX adjusted).
  • During the third quarter (period 1 April to 30 June 2015) the Group Net Interest margin remained broadly stable assisted somewhat by slower growth in lower margin liquid asset holdings.
  • The CET1 Capital Ratio was 8.6% at 30 June 2015.

[Revised] APRA Data Shows Investment Growth Still Strong

Now we have the data from ANZ, we have revised the APRA data sets for the last year, to see the true position with regards to movements in the home loans portfolios. This post revises that made Friday, (though the data is correct based on the released APRA figures.

We have adjusted the ANZ and market total lines by the changes ANZ announced late Friday.  As a result, ADI market growth for investment loans is 10.95% (based on the total movements over the 12 months to June 2015). A number of players remain well above the 10% speed limit.

APRA-MBS-June2015-INVGrowthANZTweakThe next charts show the portfolio movements for both owner occupied and investment loans.

APRA-MBS-June2015-MonMovementANZTweakedFinally, here is the revised owner occupied loans data. Annual growth 6.17%. There is no 10% speed limit from the regulator, but we put the line in for comparison purposes.

APRA-MBS-June2015-OOGrowthANZTweak A final observation, the investment loan growth depends how you calculate it, and where you draw the numbers from. Our preferred approach is to take the growth each month, and add 12 months data together to make the 10.95%. The other approach is to take the data from June 2015, and compare it with July 2014. In that case the market growth is 10.6%. Some analysts gross up the last three months to give annualised rate of over 13%. The RBA data (which includes the non-banks) shows a 12 month growth rate of 10.4% (both original and seasonally adjusted) by summing the monthly changes, or 12.4% if you take the last 3 months data and annualise that. The conclusion is that investment loan growth rates were showing no signs of slowing to June. Lets see what happens in future months.  Also, consider this. APRA imposed the speed limit at 10%, but with no explanation why 10% was a good number. DFA is of the view that the hurdle rate should be significantly lower to have any meaningful impact.

ANZ Confirms Loan Reclassification

In a media release (via ASX), ANZ confirmed that they had reclassified data it provides to the regulators. It follows a review of data collection to align more closely management reporting and regulatory reporting.

This review included a reclassification of loan purposes across “owner occupied” and “investment housing”. ANZ says these changes do not impact ANZ’s investor lending growth targets. Their investment loan book was $83.5bn at 30 June 2015.

They say that the changes do not impact ANZ’s overall lending and deposit balances, risk weighted assets, regulatory capital or prior financial reporting disclosures and have no impact on customer facilities. We think this is because there are no differences in the current risk weightings between investment and owner occupied loans.

We identified the change in the APRA monthly banking statistics on Friday.


ANZ Re-balances Mortgage Pricing

As we foreshadowed, the banks are beginning to tweak their mortgage strategies in response to the 10% cap in investment loans, and in a drive to re-balance towards owner-occupied borrowers.

ANZ today announced interest rates for residential investment property loans will increase to manage investor lending growth targets and in response to changing market conditions. There is no change to other variable lending rates including the Standard Variable Rate for owner-occupied home loans or for business lending. Fixed rates for new owner-occupied home lending will be reduced by up to 0.40%.

Effective Monday, 10 August 2015, ANZ’s variable Residential Investment Property Loan (RIPL) Index Rate will rise by 0.27% to 5.65%pa (5.76%pa comparison rate). Fixed rates for new Residential Investment Lending will also increase by up to 0.30%.

ANZ CEO Australia Mark Whelan said: “Although interest rates for residential property investors are at very low levels historically, the decision to raise interest rates for residential investment lending has been difficult but necessary in the current environment. “It allows us to balance the mix of our lending between owner-occupied and investment lending as well as the impact of changing market conditions. This includes a decision to cut fixed rates for new owner-occupied home lending. “This is a considered decision that takes into account our customers’ position and the criteria we look at when setting rates including our competitive position, our regulatory obligations and the state of the residential property market,” Mr Whelan said. ANZ has also introduced a series of other measures recently to improve the mix between investor and owner occupied lending. For residential investment lending, these include reducing interest rate discounts, increasing the deposit required to at least 10% and increasing interest rate sensitivity buffers.

Those who are above APRA’s 10% guidance will be dialing investment loans down and turning to owner occupied loans to bolster their mortgage portfolio growth. On the other hand, those below the 10% threshold seem to be seeing an opportunity to grow their investment portfolio as others pull back. Non-banks are also joining in. Banks who are well above the 10% annual target will of course have to write smaller numbers of loans in the second half to balance out the full year.

MBS-May-2015--Loans-YOY-InvThe other factor in play are the capital changes APRA announced this week, from 16% to 25% for IRB banks by July 2016. ANZ’s approach of applying the lift in investment loan rates to its entire variable portfolio indicates their strategy is designed to take account of the capital allocation changes ahead. It will be interesting to see if other banks follow suit and we see investment loans repriced across the market. We think this is a likely outcome.

ANZ 1H 2015 Results 3% Higher

ANZ released their results for 1H 2015 today. They reported a statutory profit of $3,506m up 3% from 1H14, and a cash profit of $3,676m, up 5% from 1H14. This was slightly better than expected. The result was driven by significant growth in customer deposits (up 12%) and advances (up 10%) and a provision charge of $510 million down 3%. The Group total loss rate saw a modest decline over the year, from 21bps to 19bps and ANZ’s expectation is that the loss rate will stabilise in 2H15. It expects to be operating in a lower growth operating environment going forwards.

A 4% increase in the Interim Dividend to 86 cents per share will see ANZ shareholders receive $2.4 billion, of which around 73% will be delivered to Australian based Retail and Institutional investors. ANZ expects to maintain a payout ratio for the Financial Year 2015 towards the upper end of the 65 to 70% of Cash Profit range.

ANZ’s Capital Ratio at the end of the first half was 8.7%, up 40 basis points (bps) on the same half in 20144. This half the Dividend Reinvestment Plan will operate with a 1.5% discount which is expected to result in a participation ratio of around 20% on a full year basis.

Looking across the divisions, in Australia, profit grew 8%, driven by a 6% uplift in both income and profit before provisions. Customer numbers, business volumes and market share all grew driven by investment in products, sales and service capacity and capability. Additional staff and training, new and improved digital tools including online applications, expanded customer coverage and improved service levels delivered increased Retail loan volumes, up 8% and C&CB loan volumes, up 4%. Deposits increased 3% and 6% respectively. Home lending has now grown above system for five consecutive years. Retail net interest margin fell 5 basis points from 2.01% in 2H2014 to 1.97%. The C&CB Business delivered ongoing growth despite subdued business sector confidence. ANZ’s historic strength in the Small Business Banking (SBB) segment continued with lending up 15% having grown at double digit rates for the past 3 years. Deposits in SBB have also grown strongly and at $31 billion, are more than double the level of loans.

International and Institutional Banking increased profit by 7% with strong contributions from Global Markets customer sales and the Cash Management business along with ongoing benign credit outcomes. PBP increased by 1%. Geographically, Asia Pacific Europe and America (APEA) was the standout, with profit up 18%. In Asia, customer revenues increased 13%, largely through increased focus on lower capital intensity, higher return products like Foreign Exchange, Cash Management and Debt Capital Markets. ANZ is also growing strongly in the region’s key trade and investment flow corridors including those between Australia and Hong Kong, China and Hong Kong and Australia and Singapore.

In the Trade business while volumes were broadly maintained, deteriorating commodity prices reduced the value of shipments, lowering income slightly. Lending growth across the network partially offset ongoing loan margin compression which is being felt most acutely in Australia. The quality of the loan book remains high, at 79% investment grade. Deposits increased 17%, including a 27% increase in deposits in APEA. The percentage uplift in both deposits and lending in part reflects the depreciation of the Australian Dollar during the period. A record Global Markets revenue result was in large part delivered via a record customer sales outcome, most notably in Asia. Increased activity particularly in rates, commodities and FX, assisted sales in the second quarter of the year.

In New Zealand (all figures in NZD), the business has increased momentum, with income growth of 6% and profit before provisions up 8%. Economic momentum has lifted lending volumes.  Profit growth after provisions was up 1% reflected a lower level of provision write-backs than in the prior comparable period. Home lending lifted 6% with market share increasing in key regions like Auckland and Christchurch. Streamlined products and processes along with digital tools helped lift Commercial and Agri business with lending up 6%.

Focussing on the Australian mortgage performance, which made up 69% of the Australian division credit exposure, there was more growth in NSW (1x3x system) than other states. Investment lending share increased, growing at system, and more loans were originated via the broker channels at 1.3x system. ANZ has been growing is mobile lender base, with a 50% increase in NSW.

ANZ-Home-Loans-Portfolio-May-2015Total home lending was $218 bn, up 8% net, with 934k loan accounts. The average balance at origination was $376k, (much higher than Westpac at $235k), the average LVR was 71% at origination (same as Westpac).

ANZ-Dynamic-LVR-May-201543% of the portfolio was ahead on repayments (Westpac was 73%) and 35% of the portfolio is interest only. 90+ day delinquencies were 5.7 basis points with highest rates in Queensland. Note this excludes non-performing loans.

ANZ-Mortgage-Delinqu-May-2015

Overseas Money Powering New Residential Development – ANZ

In a report released by ANZ today they say that while the Australian economy looks to the non-mining sector to drive economic growth in the shadows of rapidly slowing mining construction, strong residential building has provided a flicker of hope. Lower interest rates have eased housing affordability constraints and provided some stimulus to the cyclical upturn in housing construction. However, the boom in residential development especially high-rise apartments in the major centres can be traced to funding from overseas, rather than it being related to low interest rates in Australia.

ANZ Will Pay $30m To Prime Access Clients

ANZ today confirmed it will be reimbursing some Prime Access clients after it identified the documented annual review, part of a package of services, had not been provided. Prime Access is a fee-for-service package introduced in 2003 and includes priority access to financial planners, investment monitoring alerts and a documented annual review.

In accordance with its obligations under the Corporations Act, ANZ reported the issue to the Australian Securities and Investments Commission (ASIC) and commenced a remediation program supported by external consultants PwC and law firm Clayton Utz.

ANZ estimates the cost of reimbursing around 8,500 clients who did not receive a documented annual review to be approximately $30 million.

ANZ is working with ASIC to finalise the refund methodology and payments will commence as soon as the methodology is agreed. ANZ CEO Global Wealth Joyce Phillips said: “We sincerely apologise to our clients for not delivering all of the Prime Access services we promised and we will reimburse affected clients as soon as possible”.

Another example of issues in the troubled financial planning and advice sector in Australia, and demonstrating the need for more reform to rebuild trust.  Today ASIC announced that it was investigating new instances of licensees charging clients for financial advice, including annual advice reviews, where the advice was not provided. Most of the fees have been charged as part of a client’s service agreement with their financial adviser.


ANZ Trading Update – Solid In Tough Environment

ANZ today announced an unaudited cash profit of $1.79 billion and an unaudited statutory net profit of $1.65 billion for the 3 months to 31 December 2014, declaring it was a “solid result in a tough environment”. We say, “below expectations, in an increasingly complex and competitive market!”  Profit before Provisions grew 5.2% versus the prior comparable period and rose 3.6% on a constant Foreign Exchange (FX) basis. This result was below consensus estimates, with margins squeezed, institutional banking revenue down, and provisions lower than expected. The share price fell on the day.

Revenue was above the quarterly average for FY14 with benefits from the decline in the Australian dollar exchange rate partially offset by lower Global Markets trading income. Expenses were also higher than the FY14 quarterly average reflecting exchange rate impacts along with several key business enhancement projects becoming operational. This included a new digital platform for the Australian business which provides better product speed to market and customer interface. ANZ continues to invest in growth opportunities and enablement capability.

Customer deposits grew 9% with net loans and advances up 8%. Deposit growth was strong across all geographies with lending demand varied across the Group and customer pay-down levels remaining elevated.

Group Net Interest Margin declined 6bps compared with the end of the second half FY14, 2bps of which related to foreign exchange translation impacts. The remainder was largely attributable to Global Markets and the impact of higher liquidity requirements.

Portfolio quality improvement, with further reductions in impaired assets. The provision charge of $232m was slightly lower than the FY14 quarterly average with no reduction in the management overlay balance during the period.

Excluding the impact of the FY14 final dividend payment, CET1 capital improved by around 20 bps. At 31 December the capital ratio on an APRA CET1 basis was 8.4% (11.9% Basel 3 Internationally Comparable basis). Risk Weighted Assets in creased $17.4 billion of which $8.2 billion was attributable to FX translation which has a negligible impact on Group CET1.

Looking at the segmentals,

The Australia Division is performing strongly, with all core segments contributing. Home lending has continued to grow at above system rates, with the fastest growth occurring in New South Wales. Targeted campaigns, leveraging our digital sales capabilities, have seen the Credit Cards business rebound, posting the highest market share gains of the major banks in the past 6 months. Commercial lending momentum has been maintained following the trend in the second half of FY14, particularly in Small Business Banking. Deposit growth trends were also positive, especially in Commercial, and ANZ has  maintained market share in Household Deposits.

The New Zealand Division is also performing strongly delivering balance sheet growth with market share steady in the competitive mortgages market and deposit growth also strong. Ongoing benefits from the brand and systems merge continue to contribute to positive income expense jaws and the credit environment remains benign.

Global Wealth continues to build momentum, delivering strong in-force premiums growth, stable claims and lapse experience together with further growth in Funds under Management. Innovations including ANZ Smart Choice Super, the GROW by ANZ digital platform and the ANZ Grow Centre are driving greater adoption of Wealth products by both new to bank and existing ANZ customers.

International and Institutional Banking had a mixed start to the year. Trade volumes have been consistent; however significant reductions in commodity prices are impacting the value of shipments and providing a revenue headwind. Cash Management saw significant growth in volumes, particularly in Asia, with margins slightly improved. The Global Markets business delivered its strongest quarterly customer sales result in two years; however total Markets revenues (1Q15 $555 million) were down on the quarterly average for last year reflecting lower trading income. The business settings remain cons ervative with the value at risk (VaR) tracking below 2014 levels.

ANZ Lifts Profit 10%

In a contrast to Nab yesterday, ANZ’s full year results today are striking. In the year to September 30, ANZ delivered a cash profit of $7.12 billion which is a 10 per cent increase on last year’s result. This is in line with forecasts. Full-year net profit increased 15 per cent to $7.27bn, while operating income rose 8 per cent to $20.054bn. The net interest margin fell slightly, to 2.13 per cent, from 2.22 per cent, reflecting strong competition for loans.

Cash profit from Asia increased 25 per cent and revenue by 10 per cent in the full-year. The bank’s international business in Asia Pacific, Europe and America now accounts for 24 per cent of group revenues. Cash profits in those areas increased 20 per cent to $1.2bn. In contrast, the Australian region’s cash profit was up one per cent at $4.4bn.ANZ-Results2014