ADI Housing OO Loans Grew 0.9% In January

The APRA Monthly banking statistics for January 2016 came out today. Whilst overall ADI lending for housing grew 0.6%, lending for owner occupation grew 0.9%, from $898 bn in December to $906 billion in January. Much of this will be refinancing of existing loans, and some first time buyer activity. Investment lending grew very slightly. However, there was a $1.4 bn adjustment between OO and investment loans, so the splits are not that reliable. So, whilst lending may be slowing a little, there was significant momentum in the market in January.  Total lending reached $1,424 bn, up by $8.1 bn.

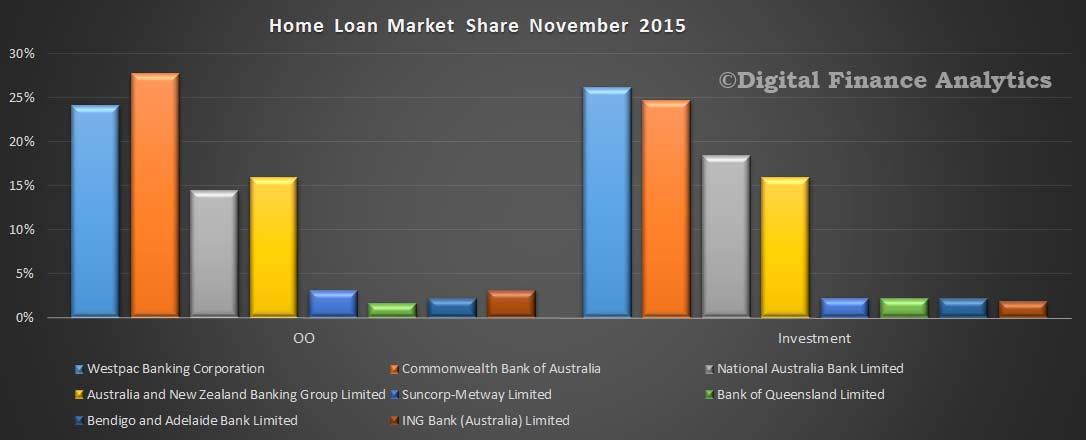
Looking at the individual banks, the market shares did not change that much, with CBA holding 27.6% of owner occupied loans, whilst Westpac holds 26.13% of investment loans.
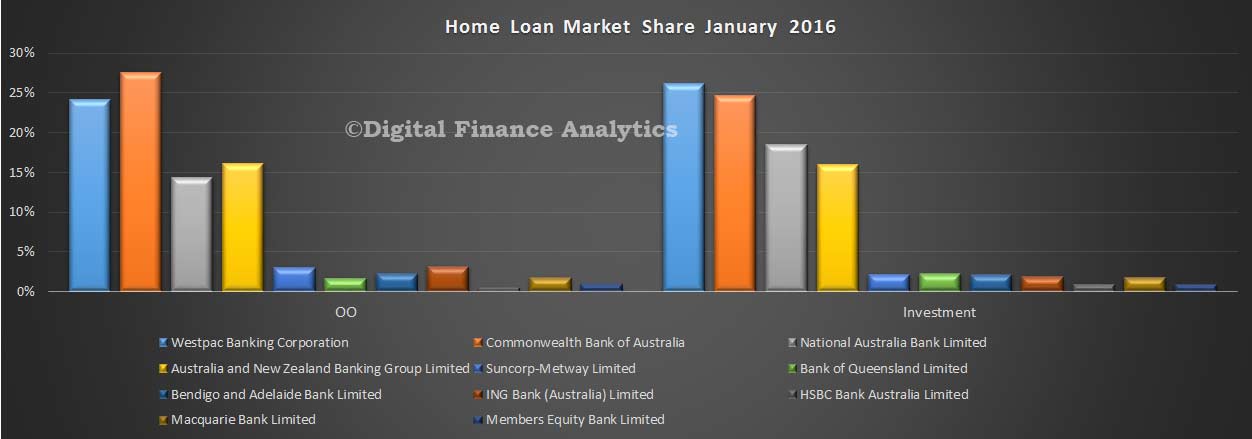
APRA-Market-Shares-Home-Loans-Jan-2016The portfolio movements (which are not adjusted for reclassifications between OO and investment loans) highlights growth in OO loans across the board. Movements in investment loans is more patchy.

APRA-Home-Lending-Portfolio-Moves-Jan-2016For what it is worth (and we have consistently used the monthly data, adjusted where we can), we see that market growth in investment loans is now sitting at 2.14%, for the 12 months to January 2016. The big four are all below the APRA 10% speed limit. Others, for various reasons are still speeding.

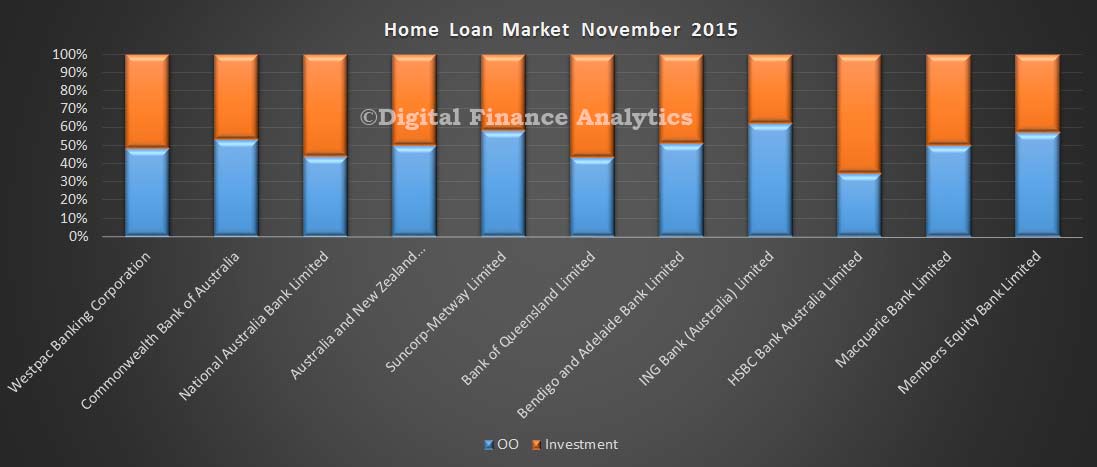
12M-Growth-Derived-Jan-2016The splits between OO and investment lending varies by lender, with HSBC, Bank of Queensland and NAB holding the larger proportion of investment loans, expressed as relative market shares.
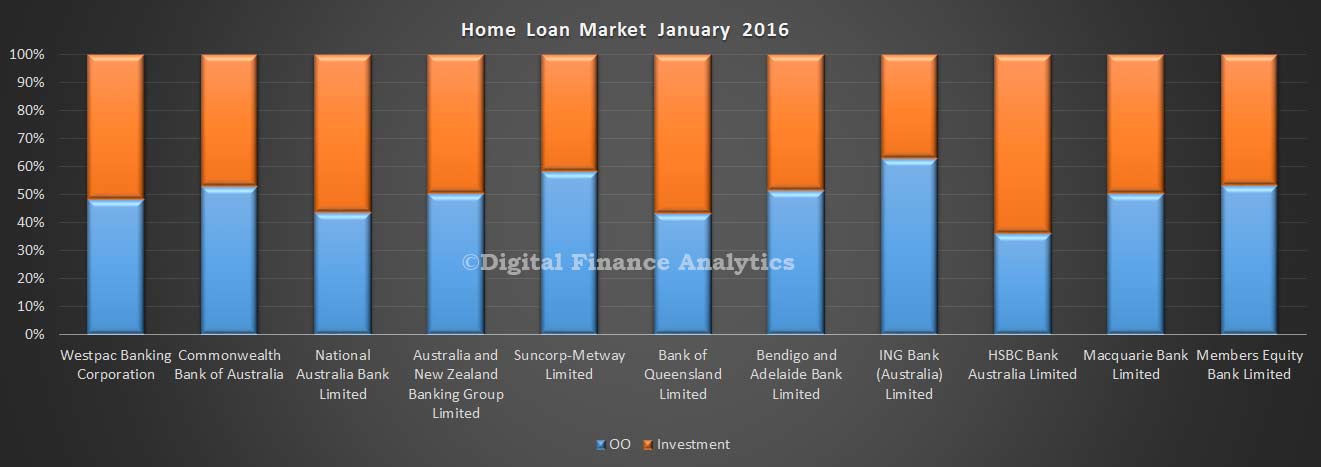
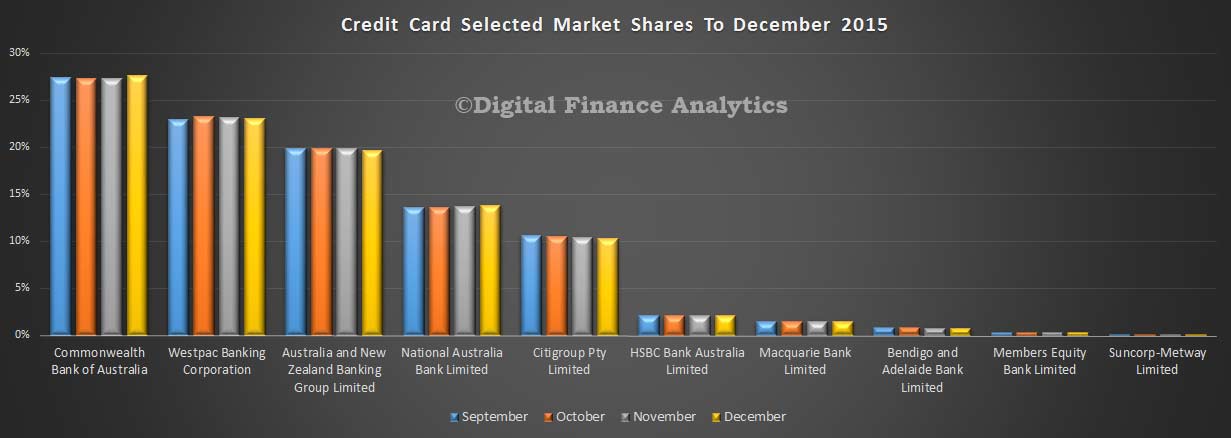
APRA-Home-Loan-SharesTuning to credit cards, total balances fell $747m in the month, to $41 billion. CBA is growing its relative share of cards, with 27.8% of the market.  NAB also grew slightly in relative terms, whilst ANZ and WBC fell a little.
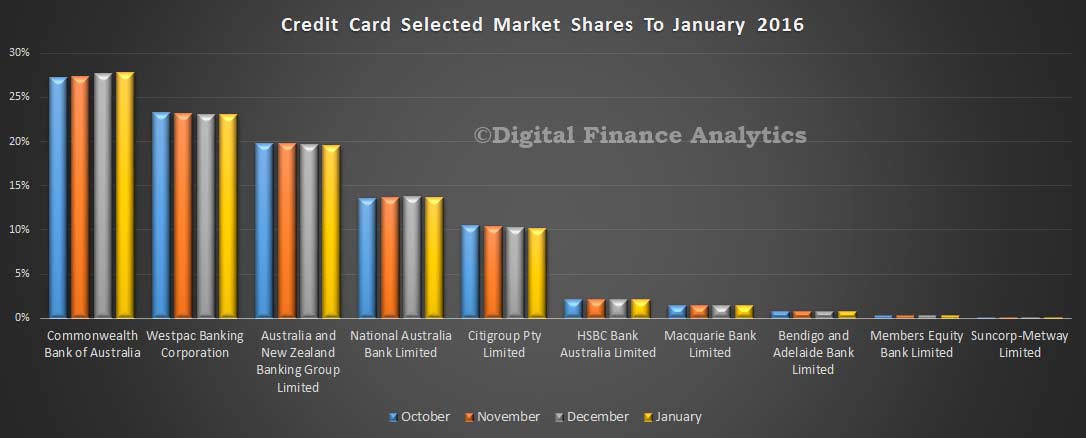
APRA-Cards-Shares-Jan-2016Looking at the monthly movements, we see that households are paying down loans they took over the Christmas.
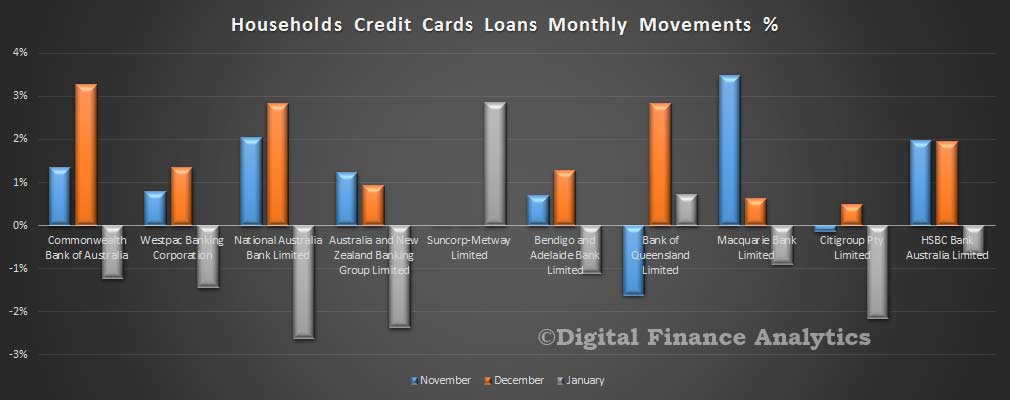
APRA-Cards-Monthly-Movements-Jan-2016Turning to deposits, total deposits grew 0.8% to $1.92 trillion. CBA grew its share a little, from 24.6% to 24.8% and remains the largest holder of deposits in Australia.
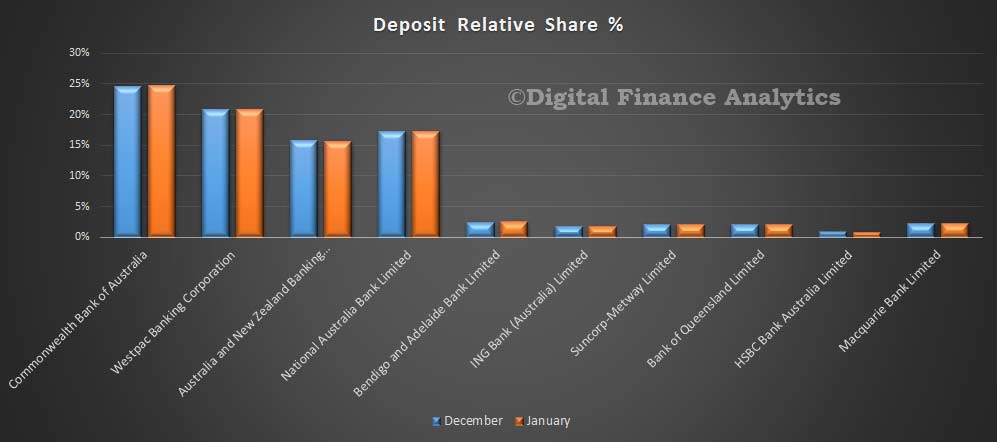
APRA-Deposits-Jan-2016-Share ANZ lost a little share in the month as it attracted less money in than the other three majors. CBA lifted net balances by $7.3 bn, compared with WBC’s $3.9 bn and NAB’s 3.6 bn.
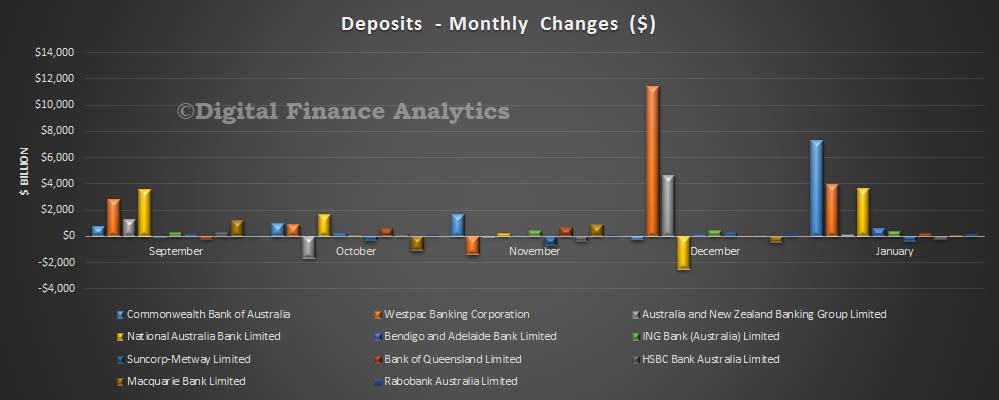
 

APRA-Deposits-Monthly-Change-Jan-2016   Given the higher margins on overseas funding at the moment, with speads elevated thanks to a range of global uncertainties, local deposits are more valuable, and we expect to see some strong competition for balances in the months ahead.

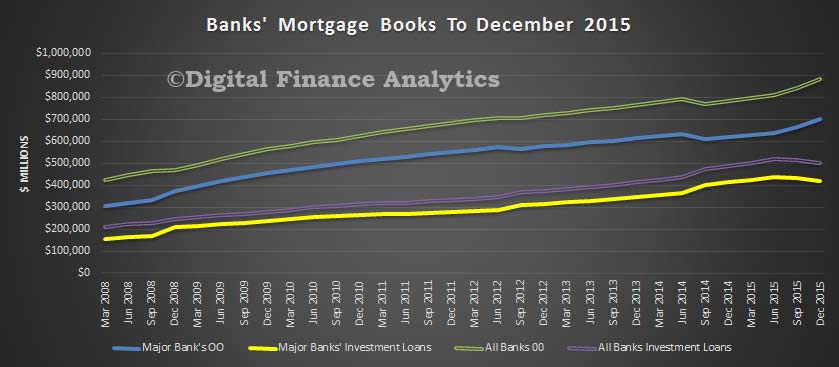
Banks’ Mortgage Books React To Regulator’s Push

APRA has released the quarterly real estate data for the banks in Australia to December 2015. There are some strong signs that the regulatory intervention has changed the profile of loans being written, despite overall significant growth in loan balances on book.

Total loans on book to December were a record $1.38 trillion, of which $1.12 trillion – or 80% are with the big four.  Within that, 36% of loans were for investment purposes, the remainder owner occupied loans. The trend shows the significant rise in owner occupied loans being written (explained by a rise in refinances), whilst investment loans have fallen. This is a direct response to the regulators intervention. But note, total loans on book are still rising.

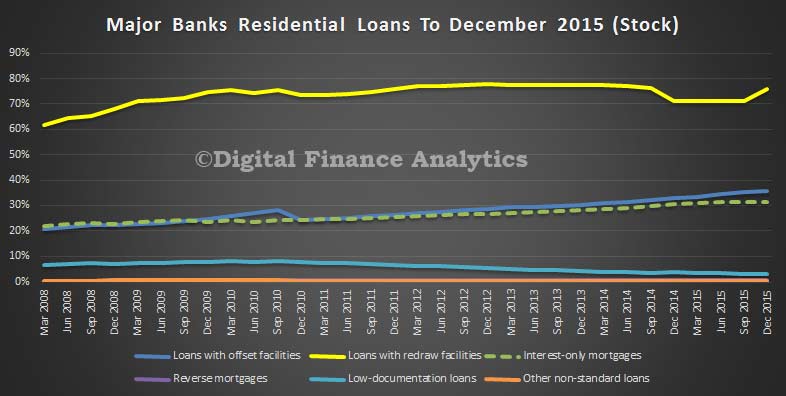
APRA-RE-2015-5Because the big four have the lions share of the market, the rest of the analysis will look at their portfolio in more detail. For example, looking at loan stock, we see a rise in the proportion of loans with a re-draw facility (75.7%), Loan with offsets continue to rise, reaching 35.8% and interest only loans have slipped slightly to 31.4%, another demonstration of regulator intervention (they have asked banks to tighten their lending criteria and ensure consideration of repayment options for interest only loans). Reverse mortgages remain static as a percentage of book (0.6%), and low-doc loans continue to fall (2.9%).

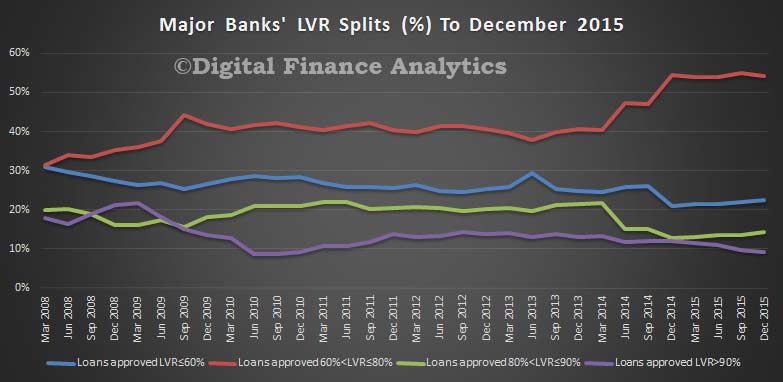
APRA-RE-Dec-2015-4The loan to value mix has changed, again thanks to regulatory guidance, with the proportion of new loans above 90% LVR falling to 9.1%, from a high of 21.6% in 2009.  Loans with an LVR of between 80% and 90% have fallen to 14.2%, from a high of 22% in 2011. Once again, we see a change in the mix thanks to regulatory guidance, and also thanks to a lift in refinance of existing loans, which tend to have a lower LVR. The portfolios are being de-risked.

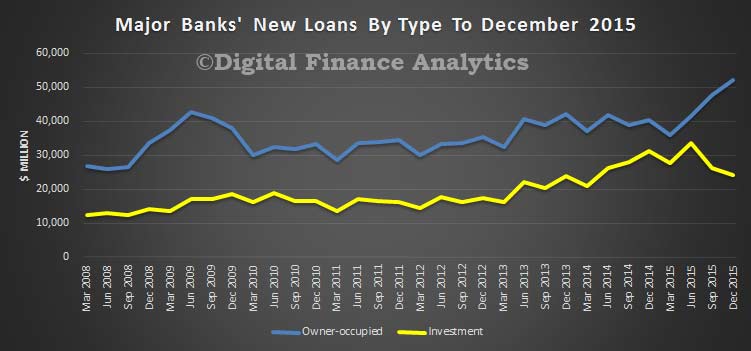
APRA-Dec-2015-RE-3Another demonstration of de-risking is the lift in new owner occupied loans, and a fall in investment loans to 31.7% of new loans written.

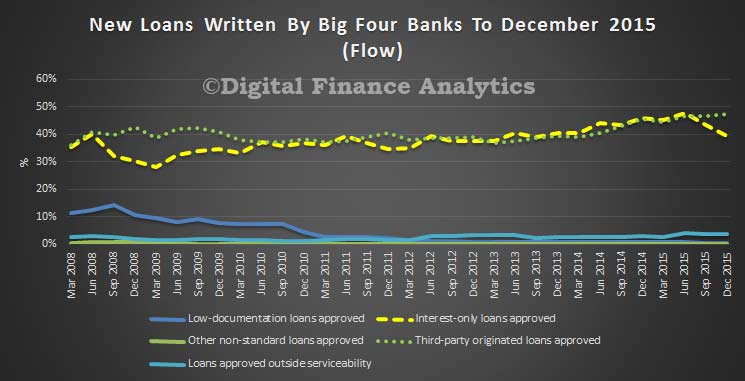
APRA-RE-Dec-2015-2If we look at interest only loans, we see a fall to 39.5% of new loans written (the high was 47.8% just 6 months before), so we see the hand of the regulator in play.  However 3.7% of loans were outside normal serviceability guidelines, just off its peak in June 2015. Finally, 47.4% of new loans have been originated from the broker channel, another record. This is also true for all banks, and it shows that brokers are doing well in the new owner-occupied and refinance ridden environment.

APRA-RE-Dec-2015-1So, overall, make no mistake home lending is still growing, despite regulatory guidance, thanks to the rise in owner occupied loans. This means that the banks will be able to continue to grow their books, and maintain their profitability. No surprise then that  the big four are all fighting hard for new OO loans, and are discounting heavily to write business.  It is too soon to judge whether the portfolios have really been de-risked, given the sky high household debt this represents, and a potential funding crunch the banks are facing.

Owner Occupied Home Lending Drives ADI’s

The latest data from APRA, the monthly banking stats to December, provide data on the stock of loans and deposits held by the banks. Total housing loans on book were $1.42 trillion, up 0.7% from last month. Within the mix, owner occupied loans grew 1% ($898 bn) and investment loans by 0.17% ($518 bn). There were no declared adjustments between owner occupied and investment loans this month (first clear result for several months).  Investment loans were 36.6% of book, still a big number.

The balance between $1.42 trillion and $1.52 trillion as reported today by the RBA relates to the non-bank sector.

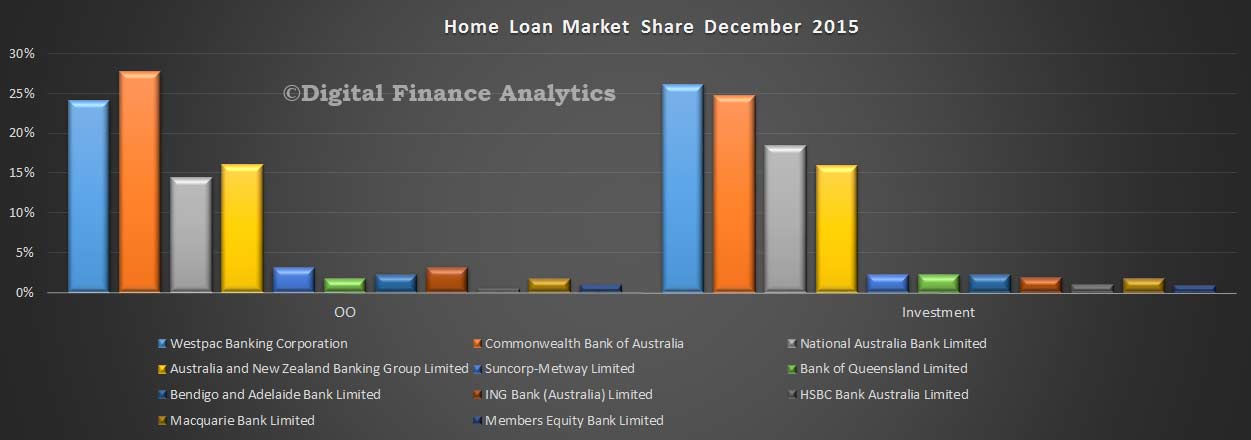
Looking at the individual lenders portfolios, CBA still has the largest owner occupied share, and Westpac the biggest share of investment loans.

Home-Loans-Dec-2015

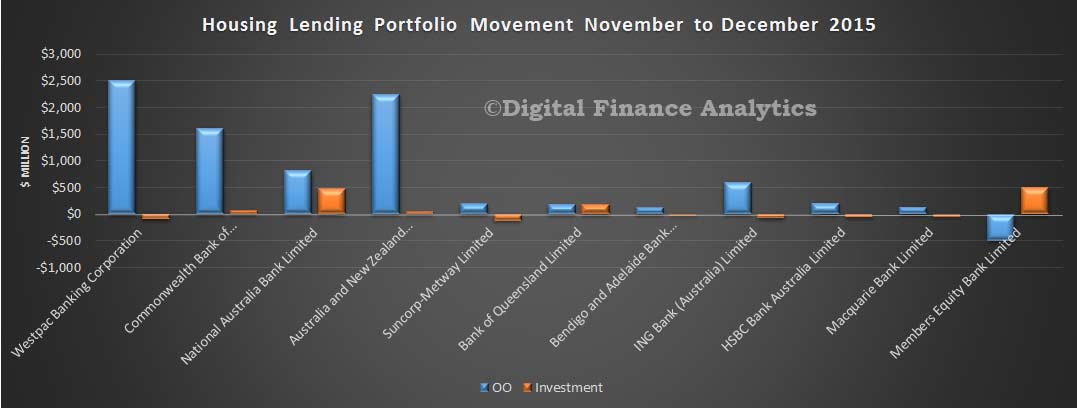
The main movements were in the owner occupied stream, with all the main lenders growing their footprint, other than Members Equity Bank who grew their investment loans.  Among the majors, NAB made (net) most investment loans.

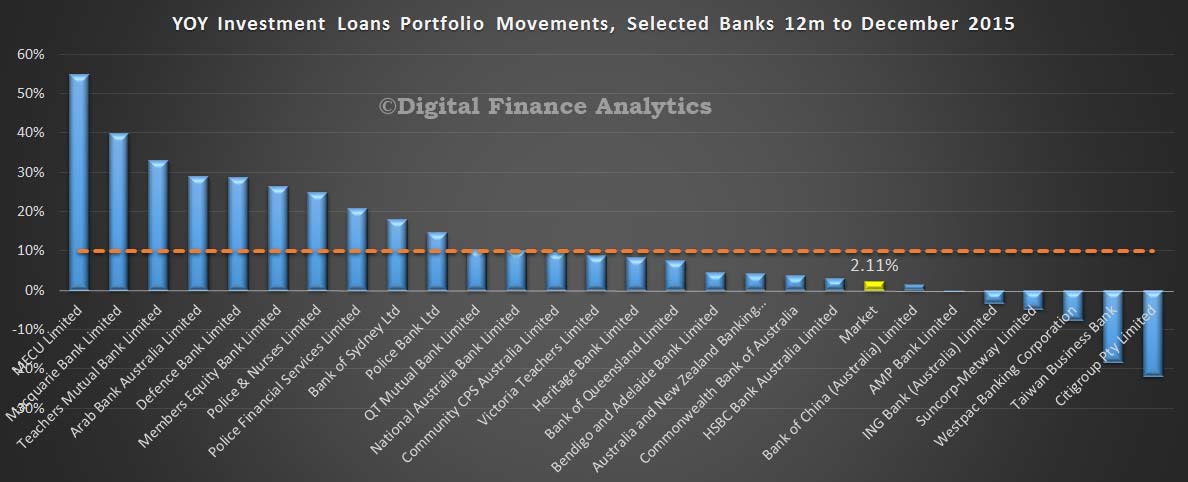
Home-Loan-Movements-Dec-2015If we look at the 12 month portfolio movements by bank, we see that the investment loans market since January has now settled at 2.1% (after all the various tweaks and adjustments). This is below the APRA 10% speed limit. Now most of the major lenders are at or below the 10% hurdle, through a number of other players are still well above. Some, like Macquarie are explained by acquisitions, others by relative lending growth alone.

Home-Loan-12M-Inv-Movements-Dec-2015

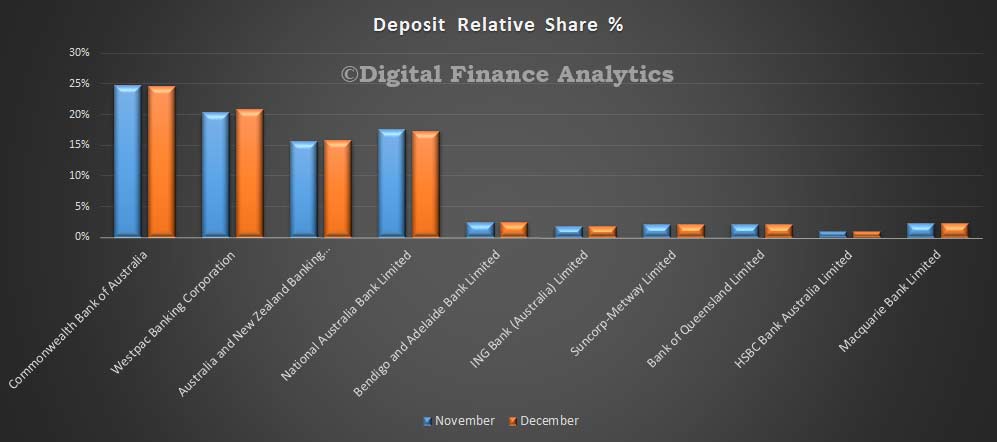
Turning to deposits, we see CBA still is the largest savings bank in Australia, though Westpac has been growing share, at the expense of NAB. Total deposits were $1.9 trillion, up $11 bn in the month – or 0.62%.  This is a larger rise than the previous two months.

Deposits-Dec-2015

Looking at the cards portfolio, total balances were up slightly (thanks to Christmas) by $832 m to $42.2 bn. CBA lifted their share of cards balances, and they remain the largest cards player, followed by Westpac and ANZ Bank. We expect balances to fall in January as households repay their festive bloat.

Cards-Dec-2015

APRA Proposes to Report ADIs Liquidity Data

The Australian Prudential Regulation Authority (APRA) today released a consultation package on the proposed publication of liquidity statistics for authorised deposit-taking institutions (ADIs).

APRA proposes to expand the current statistics published in the Quarterly Authorised Deposit-taking Institutions (ADI) Performance publication to include relevant information on the liquidity of ADIs. APRA proposes to introduce liquidity statistics for banks, and expand the existing liquidity statistics published for credit unions and building societies.

APRA invites submissions on the proposal by 30 March 2016. The consultation package can be found on the APRA website at: www.apra.gov.au/adi/PrudentialFramework/Pages/Consultation-on-the-publication-of-ADI-liquidity-statistics.aspx

Of most interest, and welcome, is the Liquidity Coverage Ratio (LCR).

APRA does not currently publish any statistics on LCR ADIs in QADIP. Under the LCR requirements that came into effect on 1 January 2015, LCR ADIs are required to maintain a sufficient level of unencumbered high quality liquid assets (HQLA) to meet their liquidity needs for a 30 calendar day period under a severe stress scenario. Absent a situation of financial stress for locally-incorporated LCR ADIs, the value of the LCR must not be less than 100 per cent5.

The LCR is calculated as the percentage ratio:  Stock of high-quality liquid assets / Total net cash outflows over the next 30 calendar days

APRA proposes to publish aggregate LCR statistics each quarter in QADIP. The statistics would include the components of the LCR: HQLA and other qualifying LCR liquid assets. Expected cash outflows and cash inflows under the LCR stress scenario would also be published.

APRA also proposes to publish statistics at the ADI segment-level for: banks (as well as major banks, other domestic banks and foreign subsidiary banks sub-segments). There are currently no credit unions or building societies subject to the LCR regime, but should this change APRA would include LCR statistics for these segments subject to meeting confidentiality obligations.

APRA proposes to publish statistics on a Level 2 consolidation basis from December 2014 reference period onwards, commencing in the March 2016 edition of QADIP. APRA does not propose to publish statistics for the 30 June 2014 and 30 September 2014 quarters, as the underlying data were submitted on a ‘best endeavours’ basis.

APRA Data Shows Investment Loans Slowing

The APRA monthly banking statistics to end November show that housing loans by ADI’s (a.k.a banks) rose by 0.8% to $1.41 trillion. This was driven by a 1.19% rise in owner occupied loans ($889 billion) and 0.14% rise in investment loans ($517 billion). As we reported, the RBA said that total loans were worth $1.51 trillion, the difference being the non-bank sector. There is still noise in the data (the RBA said that there was a switch of $1.9bn loans between investment and owner occupied loans in the month). Overall, investment lending is below the 10% speed limit.

Looking at individual banks data, Westpac still holds the highest value of investment loans, whilst CBA is the largest lender of owner occupied loans.

SharesByBanknov2015Looking at the relative splits between owner occupied and investment loans, HSBC, Bank of Queensland and Westpac have the highest proportion of investment loans.

BankSharesNov2015The monthly movements highlight that within the numbers there are still some funnies going on, including reclassification of loans.

MovementsNov2015

The Capital Schmozzle

“schmozzle (plural schmozzles). (informal) A disorganized mess; (informal) A melee”.

When the FSI inquiry was handed down last year, with recommendations mostly later accepted by Government, a cornerstone was to avoid the risk of a failing bank needing to be bailed out by tax payers, as happened in a number of countries during the GFC.

A year later, we can look back to see significant changes to the current capital rules for “Advanced” banks (those that use their own approved internal models) and significant capital raisings of more than $30bn by the industry. This has translated into higher interest rates on mortgages, especially investment property loans.

Currently underway are discussions about the next iteration of the capital rules, with the expectations that “Advanced” banks’ rules will be tightened, and the rules for other banks will get more complex, with capital ratios being determined for example by the loan-to-value (LVR) of loans, as well as differentiation between loans serviced by income, and those materially serviced by rental income flows.

APRA last week said they would look to encourage more banks to move towards the “Advanced” methods, with a series of potential interim steps, at the time when the rules are under review. They also said that the current counter cyclical buffer would be set to zero.

Five Australian Banks have “Advanced” capital management, and a number of other banks are already on the journey to “Advanced” capital methods; but it is a complex and twisted path, and the destination is not yet clear. Better data, models and systems are required to meet the necessary hurdles.

What is likely though is that the journey to hold more capital is far from over, whether “Advanced” or “Standard”, and that the light between the two systems is closing, as the “Standard” system gets more complex, and the “Advanced” ratios are lifted higher.

We think that there will be only limited upside to be gained from moving to “Advanced”, as the gap closes, and complexity increases in the standard approach. We also think significant further capital will be required – some are suggesting an additional $30-40bn in the next couple of years, enough to force mortgage prices across the board significantly higher again. As these adjustments are essentially across the board, to a greater or lesser extent, we doubt that smaller players will actually get much differential benefit. Indeed, if investment mortgages require higher capital still. (that depends on the definition of what is “material” – yet to be made clear; and the LVR), some banks could need much more capital than is currently assumed.

It is also worth noting that spreads on overseas bank capital raisings are rising, indeed, spreads are wider now across the market, as we noted last week.

So what is the potential impact of lifting capital ratios? We already mentioned the uplift in mortgage rates, as banks seek to cover the additional costs involved. Households should expect to pay more. Shareholders may also have to take a haircut in future returns, as the economics of banks change. The super profits banks have enjoyed may be trimmed a little.

But a recent paper from the Bank of England has also highlighted that lifting capital may not reduce systemic risks much. The study, a working paper “Capital requirements, risk shifting and the mortgage market” looked at what happened when capital ratios were lifted. They found that whilst the average value of a loan made fell a little, there was no reduction in higher risk lending, despite the requirements for higher capital, because the lender was looking to protect overall margins and still chose to take more risks. If this is true, higher capital requirements does not necessarily reduced systemic risks. Banks may still need Government support in a crisis.

But wait, was that not the whole reason for lifting capital ratios in the first place? Looks like a schmozzle to me!


SME Deposits and Basel

APRA has today written to ADIs about best practices in assessing SME deposits accounts. Essentially, in a recent review of 14 institutions, they found significant inconsistencies, based on how individual ADI’s were choosing to flag balances as a “stable deposit”, whether the customer was in a “stable relationship” with the ADI, and which types of account – especially internet based account should be considered “less stable deposits”. In addition “heavily rate driven deposits” need to be correctly classified.

This complexity is a result of the Basel Committee who  introduced a globally harmonised liquidity framework by developing two minimum standards with the objective of promoting short-term and long-term resilience. The Liquidity Coverage Ratio (LCR) and the Net Stable Funding Ratio (NSFR) were developed to fulfil these objectives and to also enable regulators and investors to make meaningful comparisons between banks. APRA’s expectation is that ADIs with similar business models, balance sheets and customer groups would generate similar cash outflows under the LCR.

The net effect may well be to change the relative attractiveness of rates offered by banks, especially for call deposits offered on line, as they will cost the banks more. On the other hand, deposits, held as part of a longer relationship, with notice periods attached could become more attractive.

Finally, APRA noted that few ADIs benchmarked their offered rates against rates offered by peer competitors for the purposes of this classification and suggests that such benchmarking would constitute good practice.

DFA looked at SME savings balances in our recent report. SME’s have deposits in total worth more than $107bn. The distribution of deposits varies with size. Nearly half is held by the largest firms, and holdings decrease as we look across the smaller-sized firms. The average savings balance varies also between firms which are credit avoiders, and those who are not.


Major Banks’ Shareholders Highly Leveraged; Profits $37bn, Up 10%

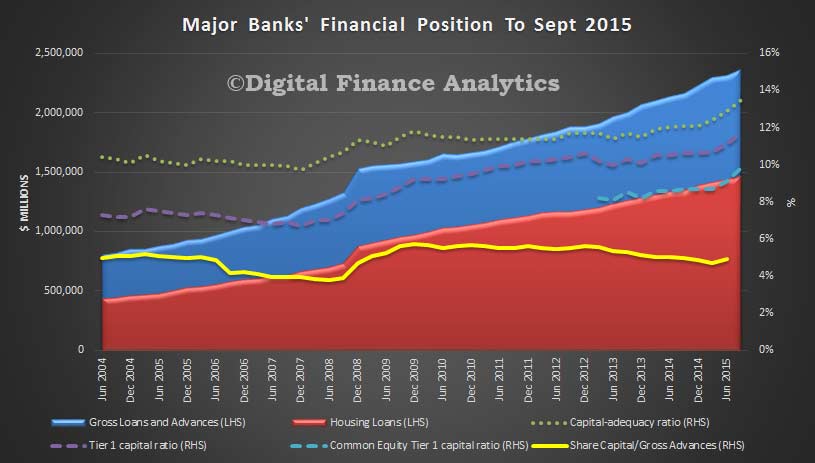
The recently released APRA quarterly banking performance statistics to September 2015 tells an interesting story. We have charted data for the major Australian banks which shows continued housing loan growth, and considerable lifts in the capital ratios in 2015.

However, looking directly at the ratio of gross advances to share capital (ignoring reserves and other factors), we still see the shareholders are highly leveraged, at 4.9% (up from a recent all-time low of 4.7% in June). This is a function of having an ever greater share of home loans in the portfolio, (with lower risk weights). It shows how reliant the banks are on expanding their mortgage books (so directly linked to rising house prices etc.).

Major-Banks-Financals-Sept-2015More broadly, looking at all the ADI’s, on a consolidated group basis, there were 159 firms operating in Australia. The net profit after tax for all ADIs was $37.0 billion for the year ending 30 September 2015. This is an increase of $3.5 billion (10.3 per cent) on the year ending 30 September 2014.

The return on equity for all ADIs was 14.1 per cent for the year ending 30 September 2015, compared to 14.2 per cent for the year ending 30 September 201.

The total assets for all ADIs was $4.58 trillion at 30 September 2015. This is an increase of $420.9 billion (10.1 per cent) on 30 September 2014.

The total gross loans and advances for all ADIs was $2.91 trillion as at 30 September 2015. This is an increase of $237.7 billion (8.9 per cent) on 30 September 2014.

The total capital ratio for all ADIs was 13.7 per cent at 30 September 2015, an increase from 12.4 per cent on 30 September 2014.

The common equity tier 1 ratio for all ADIs was 10.1 per cent at 30 September 2015, an increase from 9.2 per cent on 30 September 2014.

The risk-weighted assets (RWA) for all ADIs was $1.86 trillion at 30 September 2015, an increase of $157.0 billion (9.2 per cent) on 30 September 2014.

Impaired facilities and past due items as a proportion of gross loans and advances was 0.87 per cent at 30 September 2015, a decrease from 1.09 per cent at 30 September 2014. Specific provisions as a proportion of gross loans and advances was 0.22 per cent at 30 September 2015, a decrease from 0.28 per cent at 30 September 2014.

APRA Declares Countercyclical Buffer Rate Is Zero

APRA has today announced that the countercyclical capital buffer applying to the Australian exposures of authorised deposit-taking institutions (ADIs) from 1 January 2016 will be set at zero per cent.

The countercyclical buffer was included within the ADI capital framework as part of the Basel III reforms that were introduced by APRA in 2013. Although the minimum Basel III requirements were implemented from 1 January 2013, the buffer component of the framework will take effect from 1 January 2016.

The capital framework requires ADIs to hold a buffer of Common Equity Tier 1 (CET1) capital, over and above each ADI’s minimum requirement, comprised of three components:

  • a capital conservation buffer, applicable at all times and equal to 2.5 per cent of risk-weighted assets (unless determined otherwise by APRA);
  • an additional capital buffer applicable to any ADI designated by APRA as a domestic systemically important bank (D-SIB), currently set to 1.0 per cent of risk-weighted assets; and
  • a countercyclical buffer which may vary over time in response to market conditions. This buffer may range between zero and 2.5 per cent of risk-weighted assets.

The role of the countercyclical buffer within the Basel III reforms is to ensure that banking sector capital requirements take account of the macro-financial environment in which ADIs operate. It can be deployed by national jurisdictions when excess aggregate credit growth is judged to be associated with a build-up of system-wide risk to ensure the banking system has a buffer of capital to protect it against future potential losses. The buffer can be reduced or removed when system-wide risk crystallises or dissipates. For an ADI with international exposures, the countercyclical buffer applicable to its business will be the weighted average of the countercyclical buffers applied by the jurisdictions in which it operates.

APRA Chairman Wayne Byres noted the decision to set the countercyclical buffer for Australian exposures at zero per cent of risk-weighted assets was made following consultation with the Council of Financial Regulators.

‘Based on APRA’s assessment of current levels of systemic risk, including credit growth, asset prices and lending standards, APRA did not see a case for imposing a countercyclical buffer for Australian exposures at this point in time,’ Mr Byres said. ‘APRA will continue to monitor developments in a range of financial risk indicators, and will revise the determination if conditions warrant it in future.’

The consequence of this decision is that ADIs will generally be required, from 1 January 2016, to maintain a minimum CET1 ratio of 4.5 per cent, plus a 2.5 per cent capital conservation buffer (3.5 per cent for D-SIBs) and a buffer for international exposures in jurisdictions that have set a non-zero countercyclical capital buffer rate. For some ADIs, additional capital requirements are also applied via Pillar 2 (i.e. in response to institution-specific risks and issues). All Australian ADIs currently report CET1 ratios above these requirements: the aggregate CET1 ratio for the banking system as at end September 2015 was 10.1 per cent.

Where an individual ADI does not hold sufficient capital to meet its aggregate buffer requirement, the ADI would be subject to constraints on its ability to make capital and bonus distributions. The distribution constraints imposed on an ADI when its capital levels fall into the buffer range increase as the ADI’s capital level approaches the minimum requirements. This encourages ADIs to maintain a sound capital buffer and provides a mechanism to ensure ADIs conserve capital, and have a strong incentive to restore their capital strength, after a period of loss.

In addition to today’s announcement on the size of the buffer, APRA has also released today:

  • an information paper, The countercyclical capital buffer in Australia, setting out APRA’s approach to assessing the appropriate settings for the countercyclical buffer;
  • a revised and final version of Prudential Standard APS 110 Capital Adequacy (APS 110) that clarifies operational aspects of the countercyclical capital buffer, following consultation earlier this year; and
  • a draft version of Prudential Practice Guide APG 110 Capital Buffers (APG 110) for consultation. The draft APG110 provides additional guidance on the operation of the capital buffers, including some worked examples.

APRA has also informed the Basel Committee on Banking Supervision of the Australian countercyclical capital buffer rate so it can be added to the list of jurisdictions’ buffers that are maintained on the Bank for International Settlements’ website.

The countercyclical buffer information paper, the draft prudential practice guide on capital buffers, and the revised prudential standard APS 110 can be viewed on APRA’s website.

IMF Updates Global and National Housing Outlook, Australian Property Overvalued

In the latest release, the IMF have provided data to October 2015, and also some specific analysis of the Australian housing market. We think they are overoptimistic about the local scene, and we explain why.

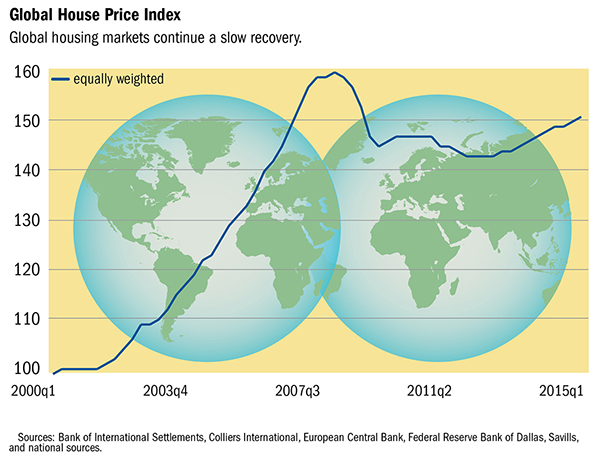
But first, according to the IMF, globally, house prices continue a slow recovery. The Global House Price Index, an equally weighted average of real house prices in nearly 60 countries, inched up slowly during the past two years but has not yet returned to pre-crisis levels.

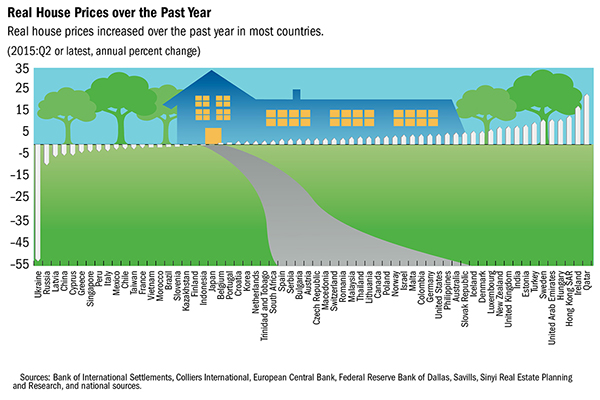
chart1_As noted in previous quarterly reports, the overall index conceals divergent patterns: over the past year, house prices rose in two-thirds of the countries included in the index and fell in the other one-third.

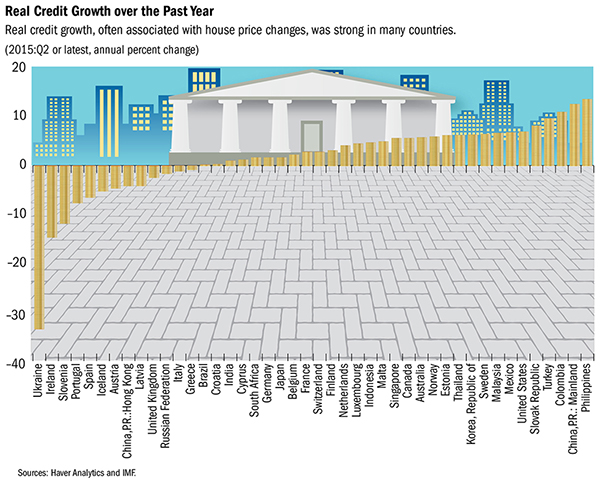
house prices around the world_071814Credit growth has been strong in many countries. As noted in July’s quarterly report, house prices and credit growth have gone hand-in-hand over the past five years. However, credit growth is not the only predictor for the extent of house price growth; several other factors appear to be at play.

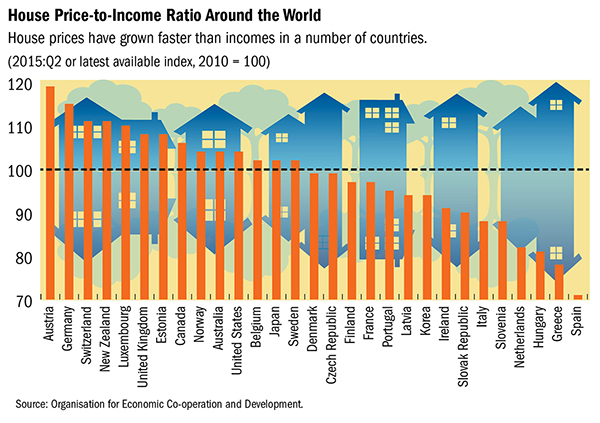
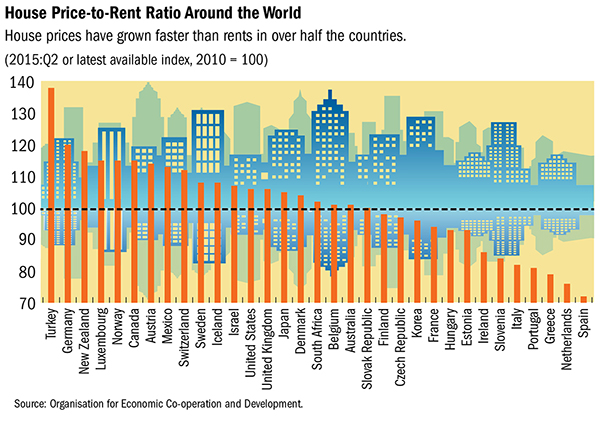
house prices around the world_071814For OECD countries, house prices have grown faster than incomes and rents in almost half of the countries.

chart2_House price-to income and house price-to-rent ratios are highly correlated, as documented in the previous quarterly report.

chart2_ Turning to the Australia specific analysis, Adil Mohommad, Dan Nyberg, and Alex Pitt (all at the IMF) argue that house prices are moderately stronger than consistent with current economic fundamentals, but less than a comparison to historical or international averages would suggest. Here is just a summary of their arguments, the full report is available.

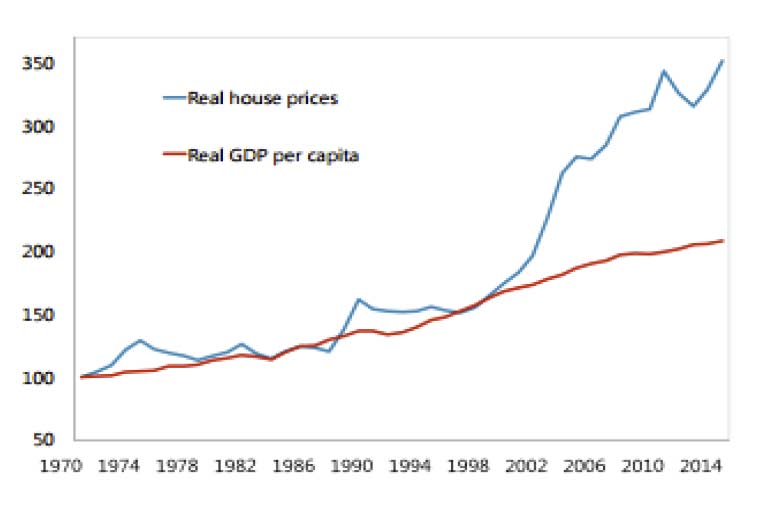
Argument: House prices have risen faster in Australia than in most other countries, suggesting, ceteris paribus, overvaluation.

OZ-House-Prices-to-GDPCounter argument 1: House prices are in line on an absolute basis – Price-to-income ratios have risen in Australia and now near historic highs. However, international comparisons suggest that Australia is broadly in line with comparator countries, although significant data comparability issues make inference difficult.
Counter argument 2: The equilibrium level of house prices has also risen sharply – Lower nominal and real interest rates and financial liberalization are key contributors to the strong increases in house prices over the past two decades. The various house price modeling approaches indicate that house prices are moderately stronger (in the range of 4-19 percent) than economic fundamentals would suggest.
Counter argument 3: High prices reflect low supply – Housing supply does indeed seem to have grown significantly slower than demand, reducing (but not eliminating) concerns about overvaluation.
Counter argument 4: It is just a Sydney problem, not a national one – The two most populous cities, Sydney and Melbourne, have seen strong house price increases, including in the investor segment. A sharp downturn in the housing market in these cities could be expected to have real sector spillovers, pointing to the need for targeted measures—including investor lending—to reduce risks from a housing downturn.
Counter argument 5: There are no signs of weakening lending standards or speculation – While lending standards overall seem not to have loosened, the growing share of investor and interest-only loans in the highly-buoyant Sydney market, is a pocket of concern.
Counter argument 6: Even if they are overvalued, it doesn’t matter as banks can withstand a big fall – While bank capital levels are likely sufficient to keep them solvent in the event of a major fall in house prices, they are not enough to prevent banks making an already extremely difficult macroeconomic situation worse.

Let us think about each in turn.

Thus, DFA concludes the IMF initial statement is correct, and despite their detailed analysis, their counterarguments are not convincing. We do have a problem.