Improving Culture and Conduct in the Financial Services Industry II

Wayne Byres, Chairman ARPA, spoke at Hong Kong and discussed financial services culture.  Internal failings within firms were at the heart of the financial crisis. But you cannot regulate good culture into existence he says. Standards of behaviour are far more difficult to define than standards of capital adequacy.

The FSB, Basel Committee, IAIS and IOSCO still have important pieces of work on their agenda. As each new proposal emerges, the questions are asked ‘are we almost there yet?’ and ‘how much longer?’ The answers are usually ‘not quite’ and ‘next year’. Yet work agendas do not seem to shorten, and another year rolls on ….

We are at that stage of the reform program where a great deal of time and effort is being spent on technical issues of regulatory detail: the right parameter for this, the appropriate transition timetable for that. But I sometimes think we are deciding these without enough clarity on the operating model we are ultimately working towards. My experience in Basel certainly highlighted that, when we had the greatest difficulty reaching agreement on the way ahead, it was usually because there were some underlying disagreements on the destination we were aiming for. It is like debating whether it is best to travel by car or plane on your next holiday, without first agreeing where exactly it is you plan to go.

I would suggest our task in dealing with the specifics would be easier – and we would get the work done faster – if we had a more strategic perspective on a few key issues. Those issues are the extent to which we want to design a regulatory framework founded on a degree of reliance on:

  • internal models;
  • supervision;
  • market discipline; and
  • internal governance and culture?

The reason that I highlight these issues is that all four could be said to be areas where reality has not always lived up to expectations. Yet all have the potential to act as a means of limiting the sorts of prescriptive, one-size-fits-all regulation that industry – with some justification – rails against. To put it another way, think what the regulatory framework might look like if we removed all reliance on internal models; undertook very limited supervision activities; and could not assume any form of market discipline externally, or good governance and culture internally, to act as a constraint on imprudent behaviour. The result would inevitably be a highly constraining regulatory rulebook, which assumed the lowest common denominator in all firms. Being able to relax those constraints, because there are other, better and less costly tools to help generate sound financial firms and systems, is important for ensuring regulation does not just produce financially-sound firms, but innovative and competitive ones too…..

Culture – the final frontier

The final question we need to ask is: how the regulatory framework should be shaped by the industry’s culture? To be blunt, how can we avoid just assuming the worst?

For all the weaknesses in regulation, supervision and market discipline, we know there were internal failings within firms that were at the heart of the financial crisis. Standards of collective governance, and individual behaviour, fell a long way short of expectations. Initial attempts to correct this came in the form of executive compensation standards established by the FSB, followed up by efforts to strengthen standards of governance by both the standard-setters and groups like the G30. But increasingly these are recognised as helpful adjuncts to the main game: that is, tackling the underlying culture within financial firms. It is, to a large degree, the final frontier in the post-crisis response.

I don’t think anyone on the regulatory side of the fence would be naïve enough to think they can regulate a good culture into existence. Ultimately, the financial sector will collectively determine the values it wants to uphold, and the behaviours it wants to display. Regulators and supervisors can only do so much.

I recently met with the CEO of one of the larger G-SIBs, and we spent some time talking about the efforts underway in his institution to strengthen the bank’s culture. There was certainly a major program of activity underway but, to be frank, none of it was particularly innovative or unusual. That prompted me to ask two questions:

  • why was it not done before?
  • what is to stop it being forgotten again once the current program has been rolled out?

I have had similar discussions and asked similar questions of a range of banks I have met with, and I am yet to get a really convincing answer. But I think it boils done to the fact that ‘doing the right thing’ has not, at least until more recently, been seen as strategically important. And, coming back to the role of market discipline, managers were not being rewarded for putting long-standing principles ahead of short-term profit.

The challenge for the industry is therefore to show genuine leadership and commitment on this issue, and not put it in the too hard basket. I do not pretend this is an easy task, and fully acknowledge that standards of behaviour are far more difficult to define than standards of capital adequacy. However, it is critical to establishing confidence – amongst regulators, let alone the wider community – that the current focus on establishing a strong, ethical culture across the industry is not just a passing fad. That will be the case when, amongst other things, developing and maintaining the right culture is seen as a core part of the organisation’s strategy, and critical for its long-term success. If that occurs, then it is more likely reality will match expectations.

September ADI Data Highlights Mortgage Shift

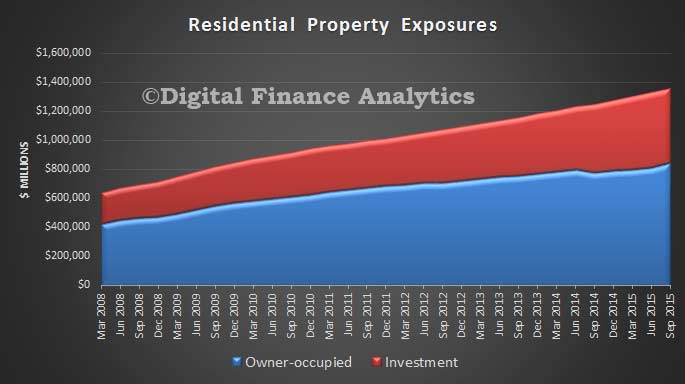
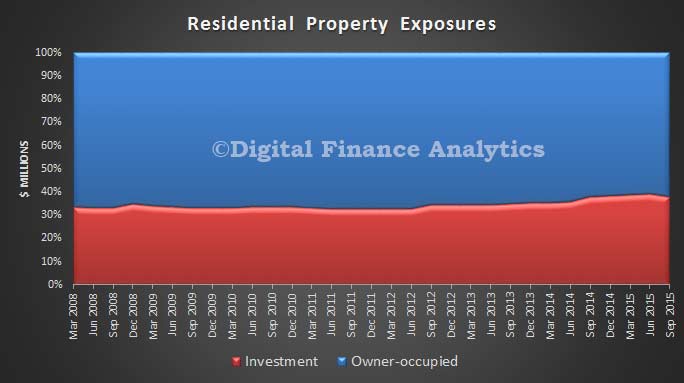
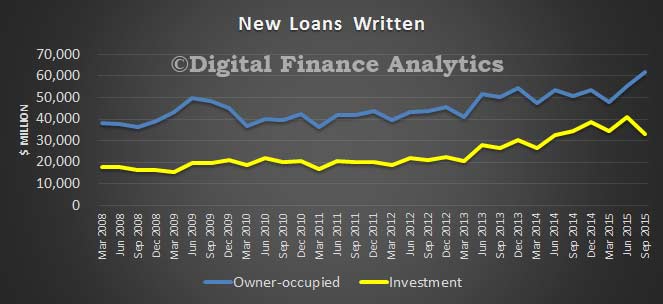
The monthly data from APRA on the banks for September makes interesting reading. This month we will focus on the home loan story (cards and deposits being pretty much as normal). First the total value of home loans in the bank’s books rose by 0.84% to $1.388 bn (compared with a total market of $1,495 bn as reported by the RBA – the gap is the non bank sector).  Among the ADI’s, owner occupied loans rose 1.48% to $856 bn, whilst investment lending FELL by 0.57% to $532 bn, and is 38.3% of all home lending. We saw a fall the previous month in investment loans of 0.75%, so investment lending continues to drift lower as the pressure from the regulators finally flows through.

Of course, the banks still need the mortgage lending drug, so they have switched to grabbing owner occupied refinance loans, and are discounting heavily now (thanks to the back book repricing they have shots in the locker).

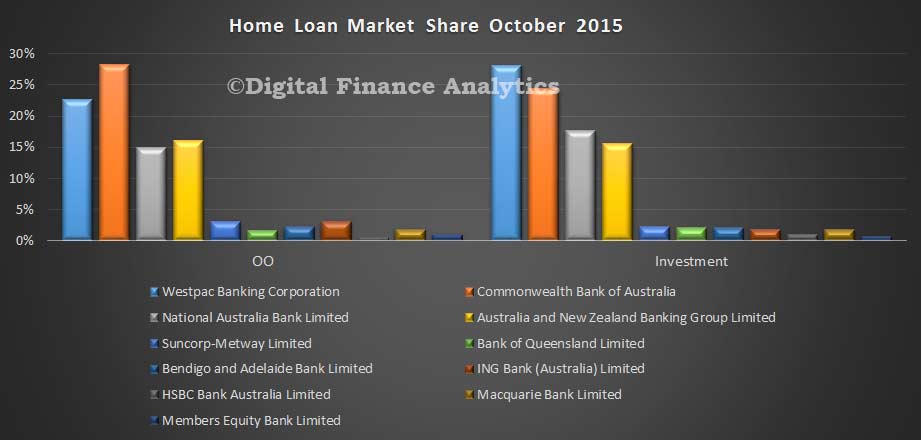
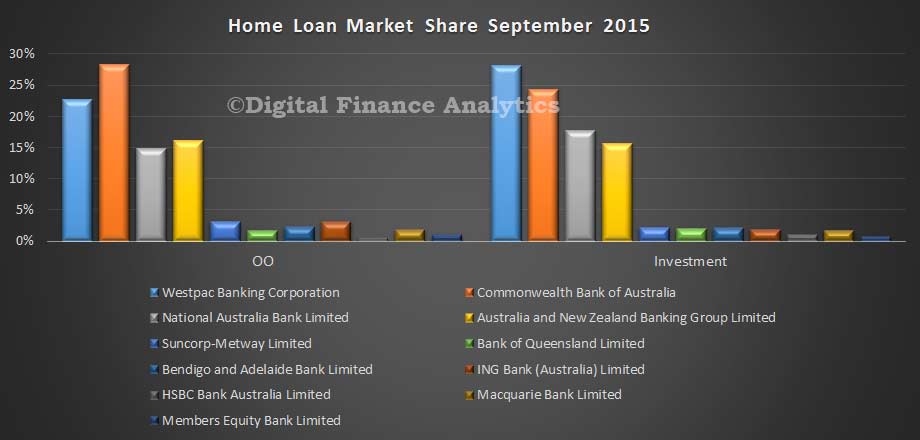
Looking at the bank specific data (and yes, we think the data is still noisy), the market shares in September look pretty similar, with Westpac still the king pin for investment lending, and CBA the champion of owner occupied loans.

MBS-Sept-2015---Home-Loan-Shares

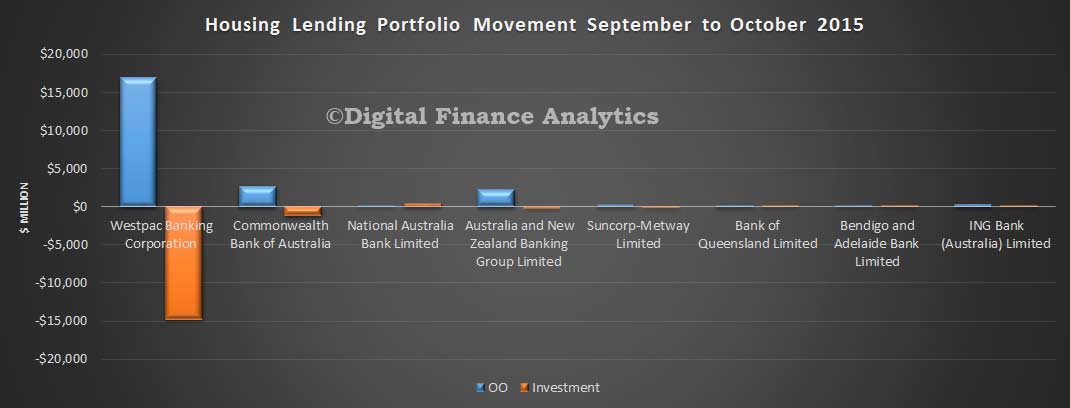
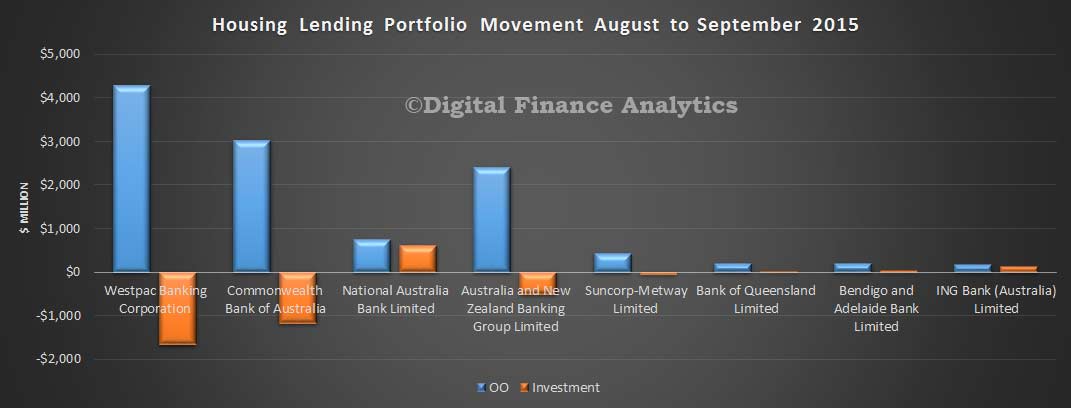
Looking at the portfolio movements though, from August to September, we see a significant swing at three of the big four, with Westpac, CBA and ANZ all dropping their investment loan portfolio a little, whilst driving owner occupied loans really hard. Suncorp also went backwards on investment lending. The focus is clearly owner occupied loans.

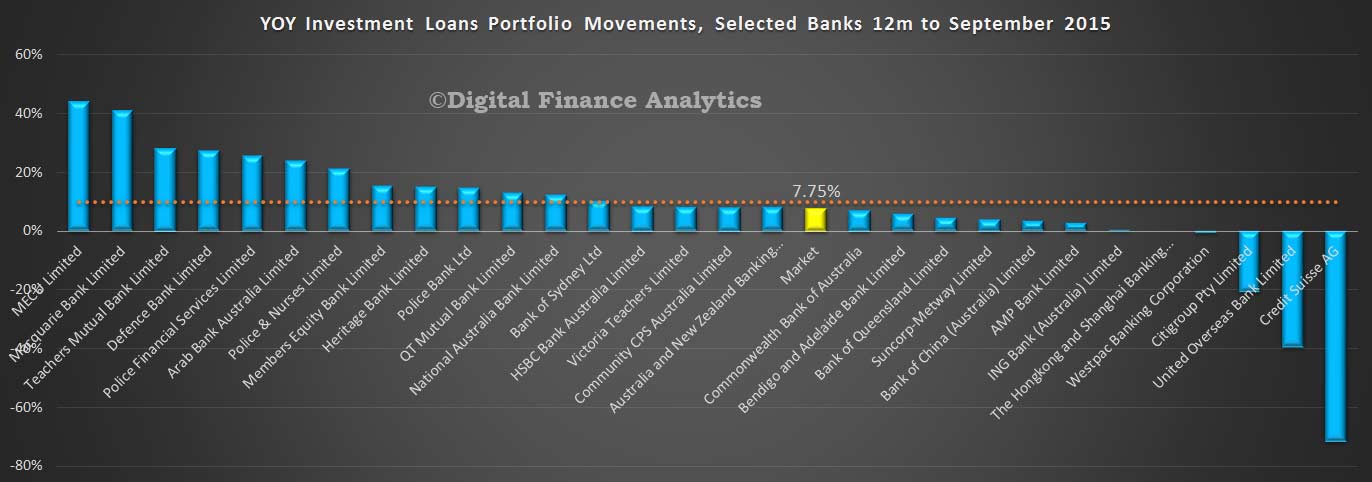
MBS-Sept-2015---Home-Loan-Portfolio-MovementsLooking at the 12 month moving data on investment loan portfolio growth, we see that some are still above the 10% speed limit, but several of the majors are now below the hurdle. The industry average is now at 7.75%. We expect it to fall further, because more banks will need to throttle back to keep their annual rates below 10%.

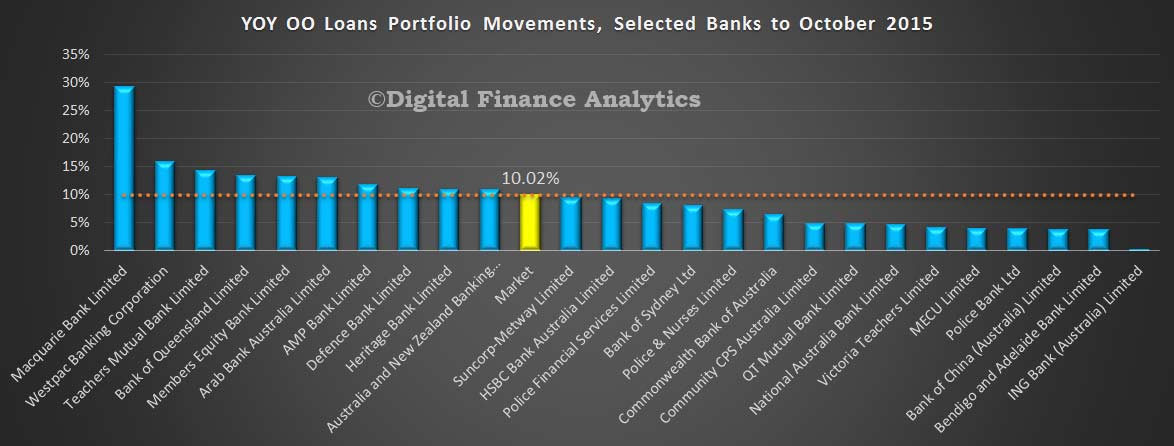
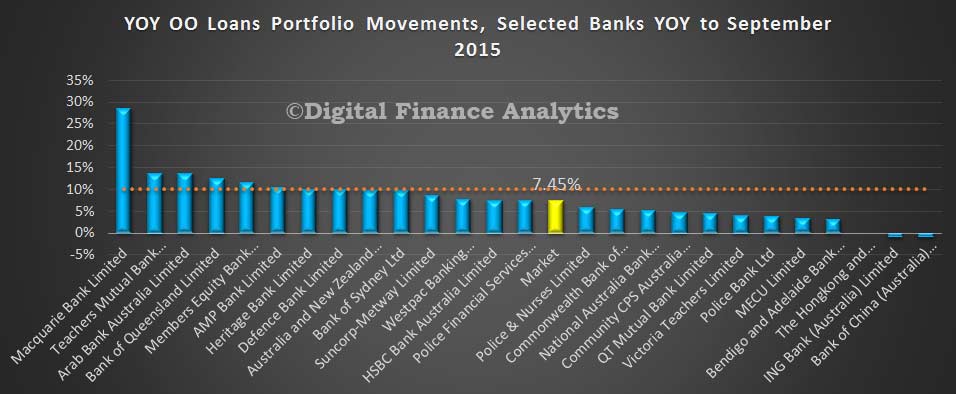
MBS-Sept-2015---INV-MovementsGrowth in owner occupied loans is stronger now than it has been for some time. The market annual average is 7.45%, and we expect the rate of growth to continue to rise. This begs the question, at what point will the regulators decide to erect a speed trap on the owner occupied side of the ledger?

MBS-Sept-2015---OO-Movements  The deep discounting of new owner occupied loans more than offsets any price increases on the headline rates for existing borrowers. We do not think the RBA should cut rates, as this will just stoke owner occupied demand further.

Housing Credit Growth Accelerating – APRA

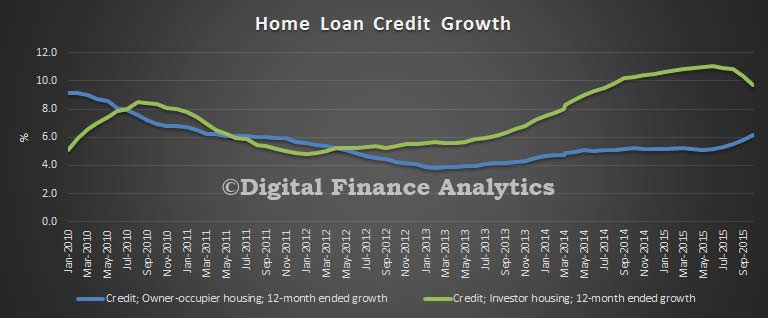
APRA head Wayne Byres made an interesting comment in his opening statement to the Senate Standing Committee on Economics Canberra today. “Based on the latest available data, the rate of growth in credit for housing is, in aggregate, still accelerating. However, within this there is a compositional switch underway, as a moderation in the growth in lending to investors has been offset by somewhat stronger growth and more competition in lending to owner occupiers.”

He also covered recent developments surrounding FSI, Superanuation Governance and the Private Health Insurance Industry.

Good morning. I would like to quickly touch on four issues that have been prominent on APRA’s agenda since we last met with this Committee.

Financial System Inquiry

The first issue is the report of the Financial System Inquiry and, of note this week, the release of the Government’s response to it. As you know, the FSI made 44 recommendations: around half of these were of direct interest to APRA. In some cases, the recommendations – such as those relating to capital requirements for authorised deposit-taking institutions (ADIs) – require specific consideration by APRA, while in others – such as those relating to superannuation, or the regulatory architecture more broadly – the matter is primarily in the hands of the Government, but APRA will likely have a role to play in assisting with implementation.

As to those recommendations that are directed at APRA, we have already made two important announcements. In July this year, we released a study on the relative capital strength of the major Australian banks against their overseas peers1. This study showed that the major banks’ capital ratios were not positioned in the top quartile, as the FSI had advocated in its first recommendation to make ADIs’ capital ‘unquestionably strong’. But we also said that, while this sort of international comparison is a useful sense check, we shouldn’t tie ourselves too tightly to it.

Also in July, we announced a change to the risk weights for mortgage exposures for those banks that are accredited to use internal models to determine their capital ratios. This change – which formally comes into effect from 1 July next year – reflected the second recommendation of the FSI, which advocated that the difference in risk weights between model-using banks and other ADIs using standard risk weights should be narrowed. As an interim measure, we adjusted the risk weight for model-using banks to the bottom of the range recommended by the FSI (ie to an average of at least 25 per cent). We referred to this as an interim measure because it may not be the final calibration: that will ultimately need to wait for more clarity on the full set of reforms to the international framework that are currently being considered by the Basel Committee. But we were comfortable moving ahead on the mortgage risk weight issue, given it was consistent with the direction the international work is taking.

With the major banks choosing to raise capital in response to this change, it also helped substantially close the gap between their current capital ratios and the top quartile positioning that the FSI advocated, providing APRA with more time to consider international developments over the next year before finalising any further changes in Australia. The Government’s response to the FSI suggests we should seek to define ‘unquestionably strong’ by the end of 2016 – notwithstanding all the moving parts, that seems quite manageable at this point in time.

Sound Lending Standards for Housing

The change in mortgage risk weights is a useful segue into the second issue I wanted to mention: the steps we have taken to reinforce sound standards in lending for housing. As the Committee will recall, we wrote to all ADIs in December last year to reinforce the importance of maintaining sound lending standards in an environment of heightened risk. As foreshadowed in our letter, we spent the first half of 2015 engaging with ADIs (particularly the largest lenders) on their lending policies and growth aspirations, in order to assess whether they were prudently managing the risks within the current environment. In many cases, this led to ADIs making changes to their lending policies and growth aspirations to ensure that sound practices were being maintained.

Many of these changes have only recently come into effect, so we are watching carefully to see how they play through the system. Based on the latest available data, the rate of growth in credit for housing is, in aggregate, still accelerating. However, within this there is a compositional switch underway, as a moderation in the growth in lending to investors has been offset by somewhat stronger growth and more competition in lending to owner occupiers. In such an environment, APRA remains very alert to any sign of deteriorating credit standards, and is monitoring that those ADIs identified as needing to strengthen their lending policies do indeed do so.

Superannuation Governance

The third issue I wanted to mention was in relation to superannuation. APRA has been consulting with industry on potential changes to the prudential framework to support implementation of the Government’s proposed changes to governance requirements for the industry, assuming they are passed by the Parliament. As outlined in our recent submission to the Committee on the Superannuation Legislation Amendment (Trustee Governance) Bill 2015, APRA supports the direction of the proposed changes in the Bill as they will more closely align board composition requirements for the superannuation industry with those of other APRA-regulated industries. APRA’s experience, over many years and across all industries, suggests that having at least some independent directors on boards supports sound governance outcomes. Superannuation is fundamentally about investing money on other people’s behalf and therefore strong governance frameworks are critical to protecting the best interests of fund members.

The recent Stronger Super reforms, including the implementation of APRA’s prudential standards, have contributed to a strengthening of governance practices within the superannuation industry, but there remains room for further improvement in a number of areas. The superannuation industry has evolved considerably since the current board composition requirements were introduced into the SIS legislation in 1993. A significant portion of the industry are now public offer funds with broad and open membership, and the industry’s importance, from both a financial system and retirement income policy perspective, continues to increase. It is therefore appropriate for the industry to ensure that it draws from the widest possible pool to ensure that boards have the necessary skills, capabilities and experience to meet the future needs of their members.

Prudential Supervision of Private Health Insurance

The final matter I wanted to note has had far less public attention than the issues I have raised thus far, but has been just as important for APRA: that is, the transition of responsibilities for the prudential supervision of private health insurance funds from the Private Health Insurance Administration Council (PHIAC) to APRA with effect from July 1 this year. That this transition was successfully achieved was due to a great deal of hard work and cooperation involving APRA, PHIAC, Treasury, the Department of Health, and the Department of Finance, and I would like to acknowledge those other agencies for the significant role they played. In the months leading up to the transition, APRA established new prudential standards for the private health insurance industry that, to the maximum extent possible, replicated the standards that had been put in place by PHIAC. Data collections, and the administration of the Risk Equalisation Trust Fund, have also been maintained largely unchanged so that the transition from PHIAC to APRA was as seamless as possible for the insurers themselves.

APRA has committed not to make any material changes to the prudential regime for private health insurers in the short term, but over time will look to align supervisory practices and prudential standards with those of other APRA-regulated industries, where it makes sense to do so.

Another day, Another IT failure

From The Conversation.

St George Bank ruined a lot of bank holiday plans this weekend when their online banking systems stopped working.

The bank’s Internet systems appear to have stopped working on Sunday evening and were still unavailable almost 24 hours later on Monday afternoon. ATMs were working but, as it was a bank holiday, branches were closed meaning that people who rely on the Internet for account transfers and overseas credit card transactions were out of luck.

Apart from a short message acknowledging the outage on their website, St George has not yet given details of the causes of the problem.

But this was not the only recent Internet banking outage at a major bank.

On the 11th and 12th September, the Commonwealth Bank (CBA) suffered a prolonged disruption to its IT services in particular its ‘industry leading’ banking platform – NetBank. And this was not the only prolonged outage at CBA this year. There were IT service disruptions earlier this year, with failures to transfer money into and out of accounts, thus racking up late and overdraft fees for customers. And also last year, and before that …….

For those who would like to see the impact of such outages on CBA customers, the excellent website Aussieoutages has a whole section devoted to CBA and a blog on which customers can register their frustration, with many of the comments NSFW – as social media terms bad language.

So what has the Commonwealth Bank to say for itself about the latest outages? Nothing!

The media page on the CBA site does not even carry a recognition of the outage let alone an apology. There was however a cock-a-hoop press release on the recent decision to bin the Deposit Levy, to add to CBA’s already record profits, and more bonuses for the CEO Ian Narev. And this is from a company that is claiming to be building a culture of customer service!

Where are the banking regulators when banking customers are inconvenienced by the banks that they are paying records fees to?

Unfortunately, APRA and ASIC continue to play pass the parcel on banking regulation.

OK, but which regulator should be wielding the big stick?

In 2011, DBS Bank, the largest bank in Singapore, suffered a computer outage that deprived its customers of access to banking services for about seven hours (half of that experienced by St George customers).

After an investigation, the local banking regulator, the Monetary Authority of Singapore (MAS) hit DBS with a stern rebuke and a set of new regulatory requirements. The bank was also ordered to “redesign its online and branch banking systems platform to reduce concentration risk and allow greater flexibility and resiliency in operation and recovery capability”. In other words – fix your IT systems, or else.

Importantly, the regulator ordered DBS to increase the capital held in reserve for ‘operational risks’ by 20 per cent, or around $180 million. Under the Basel II banking regulations, banks are required to maintain a capital buffer against operational losses, in particular ‘systems risks’.

Because the failure of Internet systems is clearly an operational risk problem, APRA should be considering at least a 20% addition to the operational risk capital charge on Commbank and Westpac (which owns St George and the other banks like BankSA which went offline at the same time). According to Commbank’s latest Risk (so-called Pillar 3) report, which incidentally has pictures of happy Internet users on the front page, a 20% increase would have CBA having to raise just over an additional $500 million of capital. On the same basis, Westpac would require just under $500 million extra capital. Good luck with that, when banks are scrambling to raise capital to cover upcoming regulatory changes.

But has APRA moved to get the IT systems of the country’s biggest banks under control? No sign so far.

So what of ASIC?

ASIC has recently released its regulatory stance on so-called Conduct Risk, or “the risk of inappropriate, unethical or unlawful behaviour on the part of an organisation’s management or employees”. Conduct Risk is the very latest in regulatory fashion and is an attempt to get banks to treat their customers more fairly.

One would have thought that, in return for account fees, providing access to customers’ own money might be a start for banks?

But a quick look at the ASIC web-site shows the usual list of fines and suspensions on financial institutions so tiny that small fry seem huge. But not a whale or even a barramundi in their nets. ASIC does not go after the big fish.

So which regulator should be going into bat for the costumers of the big banks?

Both!

APRA to ensure that IT systems in banks are robust, by using capital tools. And ASIC to ensure that banks treat customers fairly. Demanding return of fees for non-performance might be start?

Author: Pat McConnell, Honorary Fellow, Macquarie University Applied Finance Centre, Macquarie University

Bank Portfolio Loan Movement Analysis

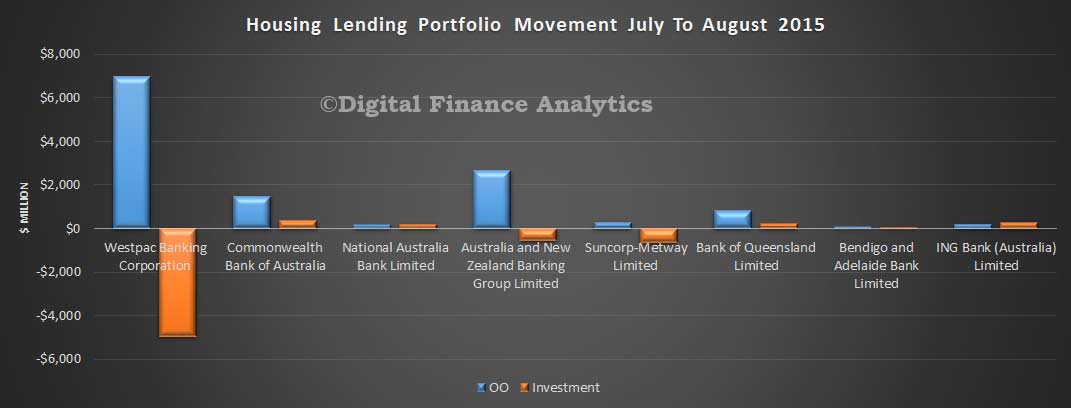
Following on from the APRA data released yesterday, today we look at the bank loan portfolio movements. Looking at home loans first, the APRA credit aggregates which focus on the ADI’s shows that the stock of home loans was $1.378 trillion, up from $1.367 trillion in July, or 0.8%. Within that, investment loans fell from $539.5 bn to $535.5 bn, down 0.7%, whilst owner occupied loans rose from $827 bn to $843 bn, up 1.9%, thanks to the ongoing reclassification. We see some significant portfolio re-balancing at Westpac between owner occupied and investment loans, continuing a trend we observed last month. We also see a relatively strong movement in owner occupied loans, as we predicted, as the focus shifts from investment lending to owner occupied loans.

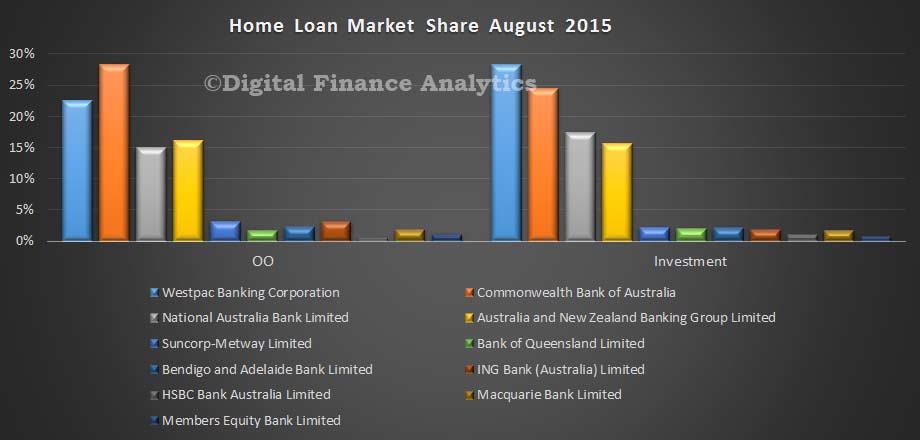
APRA-August-2015-Loan-Portfolio-MovementsThe relative portfolio shares have not changed that much, but the consequences of the Westpac moves means their relative share of investment lending is down somewhat from 28.9% to 28.2% of the market, whilst CBA moved from 24.2% to 24.4% and NAB from 17.3% to 17.4%.

APRA-Home-Lending-Shares-August-2015Looking at trend portfolio movements (which we calculate by summing the monthly movements from September 2014 to August 2015 using the APRA data, adjusted for the ANZ and NAB revisions which were announced earlier), the annual market growth for investment loans is 10%, in line with the APRA speed limit, and we see some banks above. We expect to see further revisions as we progress.

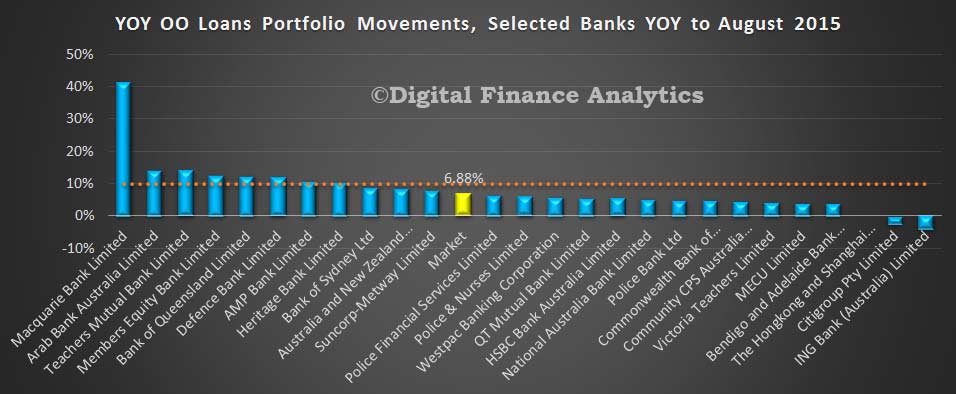
APRA-Investment-Loans-By-Lender-August-2015Looking at the owner occupied side of the ledger, average portfolio growth was 6.88%, and again we see a fair spread with some well above the 10% mark – though of course there is as yet no speed limit on owner occupied lending.

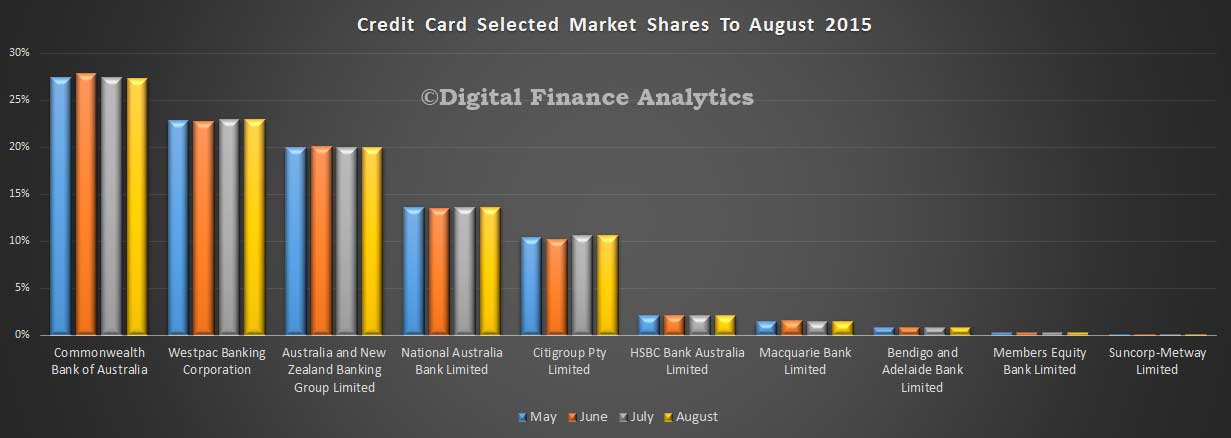
APRA-YOY-OO-Movements-August-2015Turning to credit cards, the $40.8 bn portfolio of loans hardly changed in the month of August, so the mix between providers showed no noticeable movement.

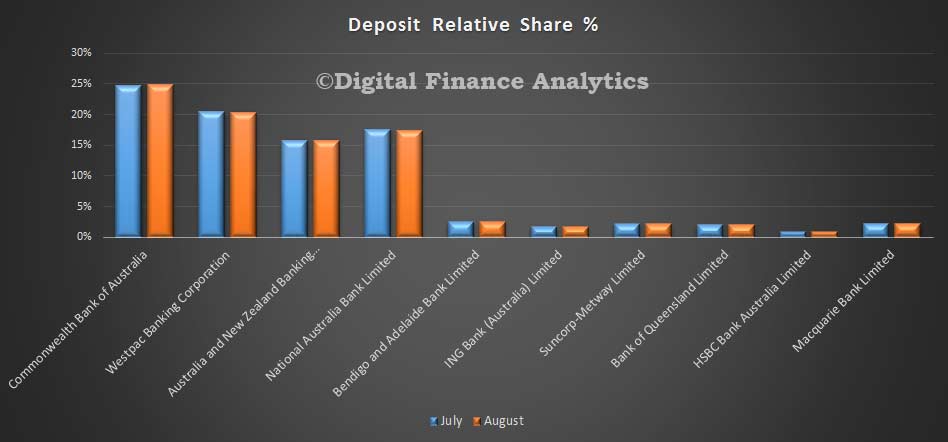
APRA-Cards-August-2015Finally, looking at deposits, there were small portfolio movements, with overall balances rising 0.6% to $1.87 trillion.

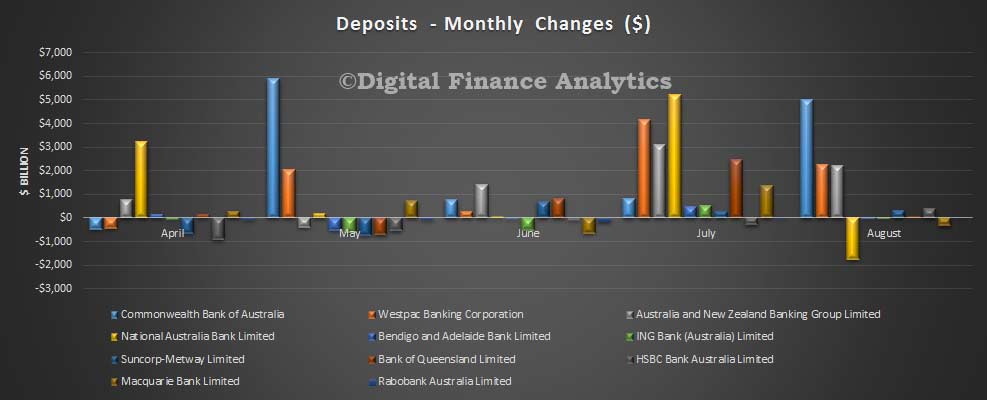
APRA-Deposits-Aug-2015  Looking at the banks, in dollar terms, NAB lost a little share, whilst CBA outperformed with an increase of $5bn in deposits. The noise in the data needs to be recognised, however, because in July, the position was somewhat reversed.

APRA-Deposit-Movements-August-2015

We also note APRA published a paper on revisions to the ADI data, APRA’s analysis shows that, in the 24 editions of MBS from January 2013 to December 2014:

  1. There were 82 reporting banks, an average 2,148 new data items published in each edition of MBS, for a two year total of 51,553 data items.
  2. there were 1,951 revisions to data items (an average of 81 data items revised per edition). There is approximately a 4.6 per cent likelihood of any data item being revised within a year from its first publication;
  3. on average, six banks (around nine per cent of all banks) resubmitted data per month that resulted in revisions to MBS;
  4. there were 557 revisions (about 29 per cent of all revisions, or 1.0 per cent of all data items) over 10 per cent and more than $100m of the original value (‘significant revisions’); and
  5. revisions to data items relating to the loans-to and deposits-from non-financial corporations were the two most significantly revised data items, together accounting for 20 per cent of all ‘significant revisions’, between January 2013 and December 2014.

Following analysis of MBS revisions, APRA intends to improve the usefulness of MBS by individually listing revisions of more than five per cent and $5m of the original value in future editions of MBS.

APRA publishes revisions to its statistics to improve the usefulness of its publications.  APRA publishes revised statistics when better source data becomes available or  occasionally, after a compilation error has been identified. Better source data typically becomes available from resubmissions of data by reporting institutions.  APRA lists ‘significant revisions’ to statistics and aims to explain the circumstances under which they were revised. Significant revisions currently include those revisions more than $100 million and over 10 per cent of the original value. These significant revisions are listed in the ‘revisions’ section of the Back Series of Monthly Banking Statistics publication.

To minimise the frequency of revisions, APRA analyses past revisions to identify potential improvements to source data and compilation techniques. Such analysis is considered international best practice. The International Monetary Fund’s (IMF’s) Data Quality Assessment Framework (DQAF) for example states that statistical agencies should ensure that “studies and analyses of revisions and/or updates are carried out and used internally to inform statistical processes.” The DQAF also recommends that “studies and analyses of revisions are made public.”

Given the substantial revisions we are currently seeing in the 2015 series, especially relating to investment and owner occupied lending, we would expect to see more details of significant changes in the future.

What Does The Latest Credit Data Really Tell Us?

Today we got the RBA Credit Aggregates and APRA Monthly Banking Statistics to August 2015.  Whilst the overall trends may superficially appear clear, actually, they are are clouded in uncertainty, thanks to significant reclassification between owner occupied and investment loans. As a result, any statement about “investment loans slowing” may be misleading. Total housing lending rose 0.63% seasonally adjusted to a new record of $1.49 trillion, of which $1.38 trillion sits with the banks, the rest is from the non-bank sector.

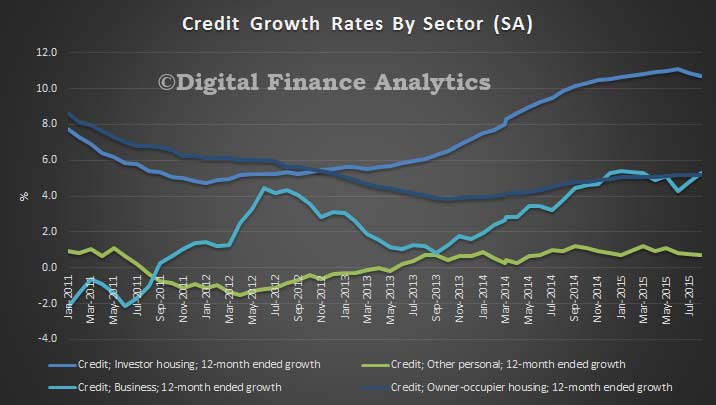
Starting with the RBA data (table D1),  overall housing growth for the month was 0.6%, and 7.5% for the 12 months (both seasonally adjusted). Owner occupied lending grew by 0.6% in the month, and 5.6% for the 12 months, whilst investment lending grew 0.7% for the month, and 10.7% for the year – still above the APRA speed limit. The chart below show the 12 month movements. It also shows business lending at 0.5% in the month, and 5.3% in the 12 months, and personal credit 0.1% in the month and 0.7% in the 12 months. It is fair to say from these aggregates that investment lending fell a little, and we think it is likely to continue to fall as lending criteria are tightened, but there is still momentum, and as we showed in our surveys demand, though tempered by tighter lending criteria.

RBA-Aggregates-Credit-Growth-PC-August-2015However, and this is where it starts to get confusing, the RBA says “Growth rates for owner-occupier and investor housing credit reported in RBA Statistical Table D1 have been adjusted to take into account the fact that the purpose of a large number of loans was reported to have changed in August, mainly from investment to owner-occupation. Similar adjustments are likely to be required in coming months. However, the stocks of owner-occupier and investor housing credit reported in RBA Statistical Table D2 have not been adjusted. The total stock of housing credit and its rate of growth are unaffected by this change.”

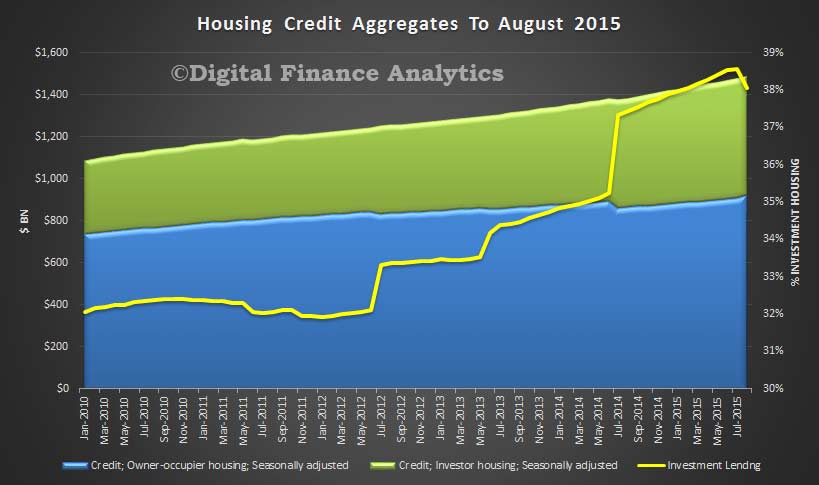
So, the data in D2 shows a significant fall in the stock of investment loans, and because of the adjustments not being made to these numbers (RBA please explain why you are using two different basis for the data) we need to be careful. On these numbers, owner occupied loans rise 1.5% in the month and investment lending fell 0.7%. The 12 month movements would be for owner occupied loans 6% and investment loans 8.3%.

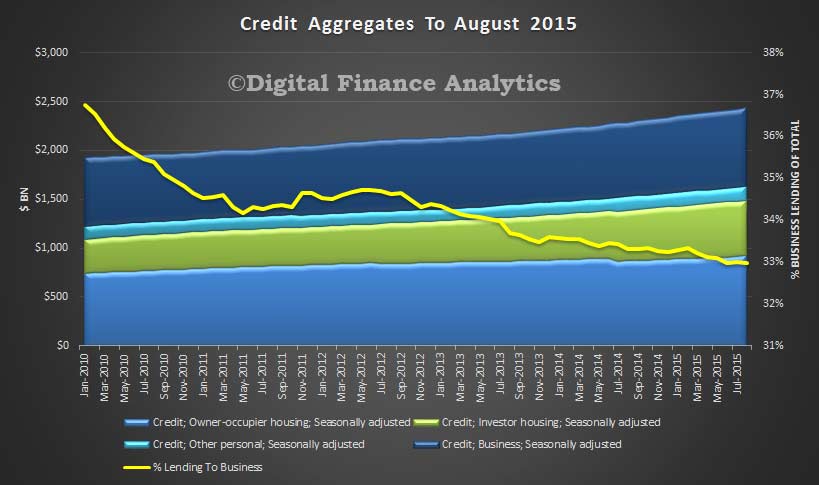
RBA-Housing-Credit-Aggregates-Aug-2015What we can see is that the proportion of lending to business is still at a very low 33%, and this highlights that the banks are still focusing on home lending, with an intense competitive focus on the owner occupied refinance sector, and much work behind the scenes to push as much lending into the owner occupied bucket as possible. Remember that some banks had previously identified loans which should have been in the investment category, so more than 3% of loans were switched, lifting the proportion of investment loans above 38%.

RBA-Credit-Aggregates-Aug-2015The APRA credit aggregates which focus on the ADI’s shows that the stock of home loans was $1.378 trillion, up from $1.367 trillion in July, or 0.8%. Within that, investment loans fell from $539.5 bn to $535.5 bn, down 0.7%, whilst owner occupied loans rose from $827 bn to $843 bn, up 1.9%, thanks to the ongoing reclassification.  Looking at the movements by banks, the average market movement for investment loans over 12 months (and using the APRA monthly movements as a baseline) was 9.92%, just below the speed limit, and we see some of the major banks below the speed limit now, whilst other lenders remain above. These numbers have become so volatile however, that the regulators really do not know what the true score is, and the banks have proved their ability to recast their data in a more favorable light.

APRA-Investment-Loans-By-Lender-August-2015It is unlikely the “fog of war” will abate any time soon, so we caution that the numbers being generated by the regulators need to be handled carefully.

We will be looking at the individual portfolio movements as reported by APRA in a later post. We like a challenge!

APRA May Cease Point of Presence Statistics

APRA has released a discussion document on the future of the Points of Presence statistics which they currently produce. The data provides useful industry level information on channel behaviour and usage, and is highly relevant in the context of digital disruption and migration. The paper suggests modification of the reporting, or possibly a cessation. We believe the POP data is highly relevant and useful and attempts to stop reporting should be resisted.

The Australian Prudential Regulation Authority (APRA) is the prudential regulator of the Australian financial services industry. It oversees banks, credit unions, building societies, general insurance and reinsurance companies, life insurers, friendly societies, and most of the superannuation industry. APRA collects a broad range of financial and risk data from regulated institutions as inputs to its supervisory assessments. Data collected from regulated and unregulated institutions also assist the Reserve Bank of Australia (RBA), the Australian Bureau of Statistics (ABS) and other financial sector agencies to perform their roles. APRA also collects some data to enable APRA to publish information about regulated institutions, and in other cases, to assist the Minister to formulate financial policy. Much of the data APRA collects are used for multiple purposes to reduce the burden of reporting.

APRA publishes as much of the data collected as are considered useful and as resources permit, subject to APRA’s confidentiality obligations with respect to individual institutions’ data. Publication of industry-level statistics enhances understanding of the industries regulated by APRA, aids public discussion on policy issues, and supports well-informed decision-making by regulated institutions, policy-makers, market analysts and researchers. Publication of institution-level data, where possible, is also consistent with promoting the understanding of the financial soundness of regulated institutions.

APRA observes international statistical standards in developing, producing and managing its statistics (except in the few cases where doing so would conflict with APRA’s primary role as a prudential regulator). By doing so, APRA helps protect commercially-sensitive information provided by institutions, whilst providing statistics that are useful and reliable, and that meet the needs of users.

APRA publishes detailed banking services provided within Australia by Authorised Deposit-taking Institutions (ADI) in its ADI Points of Presence (PoP) statistics. APRA is reviewing the PoP statistics to ensure that the statistics remain relevant and useful.

This paper focuses on two options for the future of the PoP statistics and data collection:
1. streamline the PoP statistics and data collection; or
2. cease the PoP statistics and data collection.

APRA is seeking feedback on the proposed changes. Written submissions should be forwarded by 18 November 2015, preferably by email to:
Manager, Banking Statistics,
Australian Prudential Regulation Authority
GPO Box 9836
Sydney NSW 2001
Email: statistics@apra.gov.au

Australian Bank Capital Journey Is Far From Over

‘In Search Of …. Unquestionably Strong’ was the title of a speech given by APRA Chairman Wayne Byres. It is he highlights that there is an ongoing journey towards building greater capital ratios for the banks.

He makes two points of note. First banks around the world are on the same journey, so it must continue, and second, what ‘unquestionably strong’ meant precisely was largely left for APRA to determine. Its not a matter of mechanically moving in step with international benchmarks to maintain top quartile position.

He went ahead to reinforce the point that top quartile positioning is just one means of looking at the issue, and certainly not the only one to use;  highlighted that there are many unknowns about the way capital adequacy will be measured in future, so it is not the end of the story; and that capital is just one measure of the strength of an ADI, and ideally we should think about ‘unquestionably strong’ with a broader perspective.

Using the data from the quarterly performance statistics he compared the capital ratios again CET1 and other measures. We have highlighted the fact that the ratio of loans to shareholder capital has not improved and concluded “We also see the capital adequacy ratio and tier 1 ratios rising. However, the ratio of loans to shareholder equity is just 4.7% now. This should rise a bit in the next quarter reflecting recent capital raisings, but this ratio is LOWER than in 2009. This is a reflection of the greater proportion of home lending, and the more generous risk weightings which are applied under APRA’s regulatory framework. It also shows how leveraged the majors are, and that the bulk of the risk in the system sits with borrowers, including mortgage holders. No surprise then that capital ratios are being tweaked by the regulator, better late then never”.

APRA-Major-ADI-Ratios-and-Loans-June-2015He concluded that APRA was still thinking about how to define ‘unquestionably strong’ and the role of top quartile positioning and made five closing points.

  1. we have a soundly capitalised banking system overall in Australia;
  2. with the aid of recent capital raisings, the initial 70 basis point CET1 gap to the top quartile that we identified is likely to have been substantially closed;
  3. higher capital ratios are likely to be needed if current relative positioning is to be retained and enhanced, particularly if measures beyond CET1 are examined;
  4. by quickly moving on the FSI recommendation regarding mortgage risk weights, APRA has created time to consider international developments emerging over the next year or so; and
  5. given where we are today, APRA and the banking industry have time to manage any transition to higher capital requirements in an orderly fashion.

We would observe that the first two statements seem contradictory – if we are so well capitalised, why the lift in capital by 70 basis points? Why also are regulators all round the world desperately lifting ratio? The short answer is because they let the ratios get too lean and mean – as demonstrated by the GFC. This has to be addressed.

So, in short, the journey lays ahead. Then of course Basel IV is just round the corner. Australian banks are likely to find the costs of doing business will continue to rise. with consequences for loan pricing, loan availability and bank profitability.

ADI Data July 2015 – Investment Loans Grow Again – However…

APRA released their monthly banking stats for ADI’s to end July 2015 today. Looking in detail at the data, we start with home loans. Total ADI loan portfolios grew in the month by 0.4% to $1.37 trillion. The RBA data, already discussed gave a total growth of 0.6% to $1.48 trillion, so this suggests the non-banking sector is growing faster than ADIs. There are lags in the non-bank data streams, so we need to watch future trends carefully.  Investment lending grew more than 11% in the past 12 months.

Looking at the mix between owner occupied and investment home lending, we see that owner occupied loans were static, ($827,905, compared with $827,700 in July), whilst investment loans grew (from $827,905 to $827,700 million) with a rise of $5,799 million, or 1.1%. However, we think the data is corrupted by further restatements of loans as they are reclassified between owner occupied and investment categories.

Looking at the lender data, we start with the all important year on year portfolio movements. Depending on how you calculate this (sum of each month movement, last 3 month annualised, etc) you can make the number move around. We have adopted a simple approach. We sum the portfolio movement each month for 12 months. This gives a market growth average for the year of 11.46%. We also see that many banks – including some of the majors, are still well above the speed limit of 10%. Regulatory pressure does not seem to be having much impact, despite the rhetoric, and repricing. Our thesis appears proven.

MBSJuly2014InvPortfolioMovementsFor completeness, we show the same picture for owner occupied loans – though there is of course no formal speed limit as we think currently competitive action is focussed here.

MBSJuly2014OOPortfolioJulyTurning to the portfolio movements, we see a significant swing at Westpac – we suspect a restatement of loans – but have not found any announcements on this so far. Logically, a $3bn lift in investment lending is too significant to be normal market behaviour, in our opinion. We have factored in the restatements at NAB and ANZ.

MBSJuly2014HomeLenidngMovementsThe relative market share analysis shows that Westpac has the largest investment portfolio, whilst CBA has the largest owner occupied loan portfolio.

MBSJuly2014HomeLendingSharesIt is also worth looking at the relative percentage splits between owner occupied and investment loans by bank. Westpac and Bank of Queensland have the largest relative proportions, so are under more pressure from the 10% question.

MBSJuly2014HomeLendingSplitsIn the credit card portfolio, total balances were up 1% from $40.4 billion to $40.8 billion. We see small movements in relative share, with CBA loosing a little whilst Westpac and Citigroup grew share slightly.

MBSJuly2015CardsFinally, on deposits, we see three of the majors growing their portfolio, with NAB showing the largest inflow.  Total balances grew from $1.83 billion to 1.86 billion, of 1.27%.

MBSJuly2015DepositMovementsRelative deposit share changed just slightly as a result.

MBSJuly2015DepostShares

ME Bank Joins The Rate Changes

Another lender, ME has announced changes to its variable and fixed home loan interest rates for investor and selected owner occupied loans. Keeps the consistency in pattern, with higher rates for existing and new investment loans, and a cut to attract new owner occupied lending.  This is in line with our expectations. Again we make the point, that ME bank is not subject to the APRA changes for advanced IRB banks, once again their pricing is more about competitive dynamics, than directly connected with the 10% speed limit on investor loans.

Effective 15 September 2015 ME’s Basic Variable home loan interest rate for new investor borrowers will rise by 0.40% to 4.69% p.a.* (comparison rate 4.70#) and its Flexible home loan with member package^ interest rate for new investor borrowers will increase by 0.36% to 4.89% p.a.* (comparison rate 5.28#). Rates across existing investor loans will also rise by 0.41%.

Fixed rates for new owner occupied borrowers will fall between 0.09% and 0.50% across its 3 to 7 year terms, including our 3-year fixed rate falling 0.09% to 4.19% p.a.* (comparison rate 4.71#).

ME CEO, Jamie McPhee, said the changes have been precipitated by a major changes in the banking industry which have forced banks including ME to review their lending practices and pricing.

APRA introduced new regulatory measures to reinforce sound residential lending practices last December, including actions to restrict investor lending growth to no more than 10% p.a.

“The changes we have announced today will advantage owner occupied borrowers particularly those seeking to buy their first home,” McPhee said.

“The decision to increase investment rates was a difficult one, but after careful consideration we believe that combined with rate cuts across selected owner occupied home loans it strikes the right balance across our portfolio.”