APRA Data Shows Major Banks Mortgage Book Now $1.43 Trillion – But Shareholder Equity Just 4.7%

APRA today released the Quarterly Authorised Deposit-taking Institution Performance publication for the June 2015 quarter. This publication contains information on ADIs’ financial performance, financial position, capital adequacy and asset quality. There were 160 ADIs operating in Australia as at 30 June 2015, compared to 165 at 31 March 2015. There were eight changes were mainly to some credit unions having their licences revoked.

Over the year ending 30 June 2015, ADIs recorded net profit after tax of $38.0 billion. This is an increase of $5.7 billion (17.6 per cent) on the year ending 30 June 2014.

As at 30 June 2015, the total assets of ADIs were $4.4 trillion, an increase of $376.4 billion (9.3 per cent) over the year. The total capital base of ADIs was $238.1 billion at 30 June 2015 and risk-weighted assets were $1.8 trillion at that date. The aggregate capital adequacy ratio for all ADIs was 13.2 per cent.

Impaired assets and past due items were $26.7 billion, a decrease of $5.4 billion (16.8 per cent) over the year. Total provisions were $13.4 billion, a decrease of $5.2 billion (27.9 per cent) over the year.

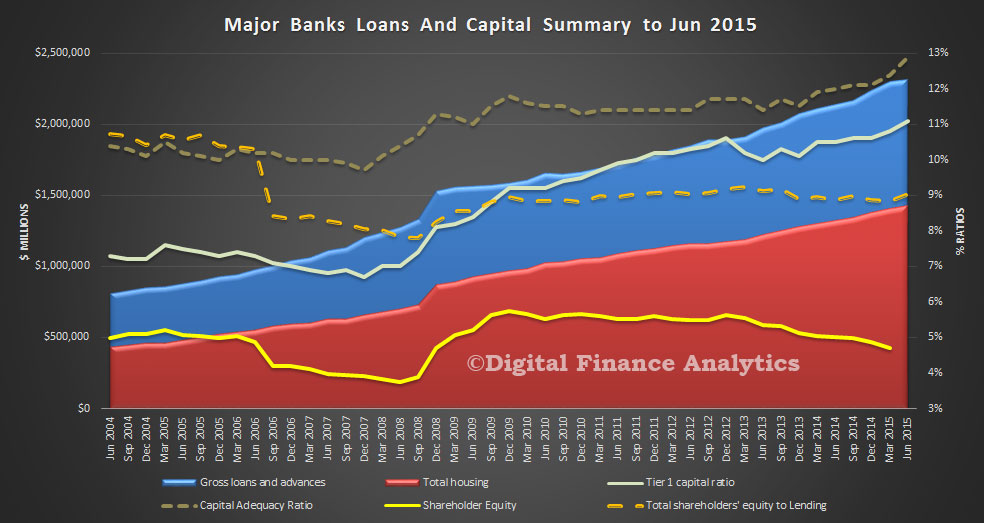
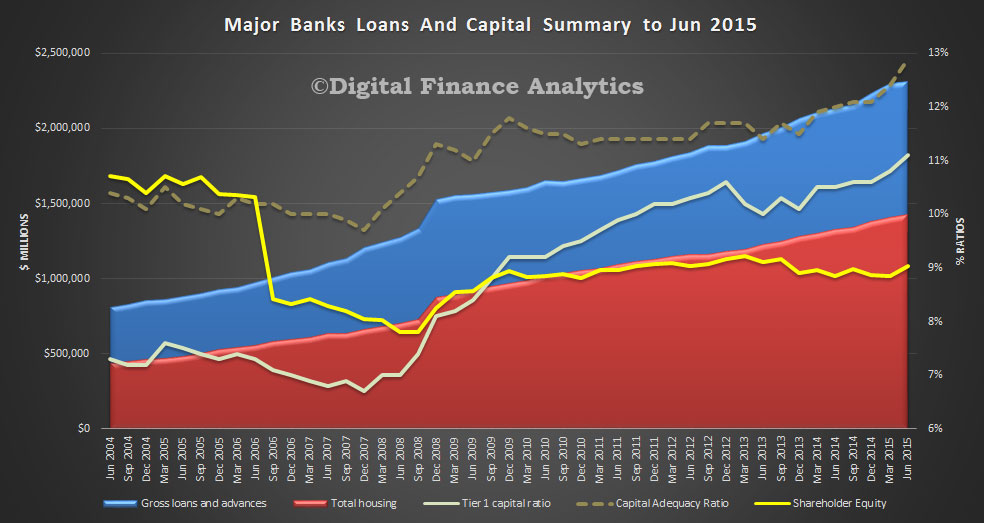
Looking in detail at the average of the four majors, we have plotted loans, housing loans and capital ratios again, to June 2015. We see the growth in lending, and the ongoing rise of housing lending. We also see the capital adequacy ratio and tier 1 ratios rising. However, the ratio of loans to shareholder equity is just 4.7% now. This should rise a bit in the next quarter reflecting recent capital raisings, but this ratio is LOWER than in 2009. This is a reflection of the greater proportion of home lending, and the more generous risk weightings which are applied under APRA’s regulatory framework. It also shows how leveraged the majors are, and that the bulk of the risk in the system sits with borrowers, including mortgage holders. No surprise then that capital ratios are being tweaked by the regulator, better late then never.

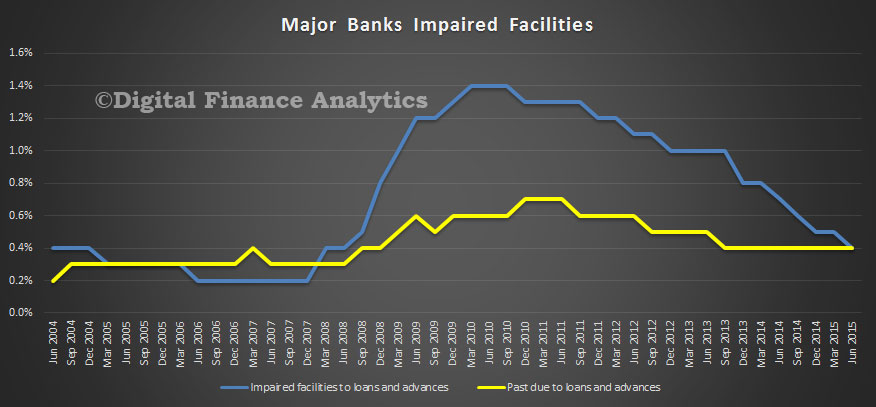
APRA-Major-ADI-Ratios-and-Loans-June-2015At the moment impairments are low, this of course may change if economic momentum slows, unemployment or interest rates rise, or house prices slip. Other risks include external shocks, like China and the impact of rates in the US rising.

APRA-Major-ADI-Immairments-June-2015

Home Lending More Risky – APRA

Wayne Byres, Chairman APRA, “Banking On Housing“, speech today, portrayed the current state of play with regards to supervision of housing lending.  He started by noting that housing lending now accounts for around 40 per cent of banking industry assets, and a little under two-thirds of the aggregate loan portfolio. With such a concentration in a single business line, we are all banking on housing lending remaining ‘as safe as houses’.
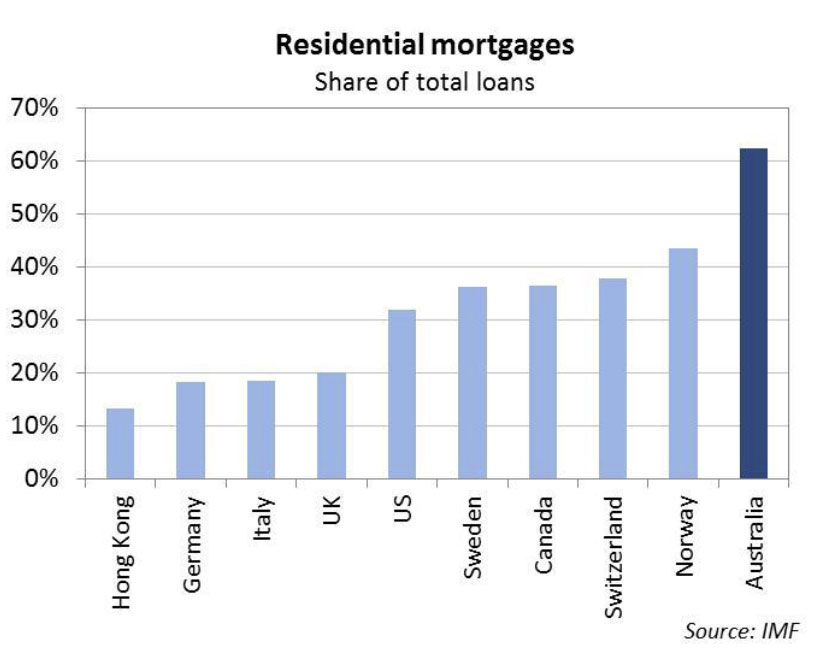
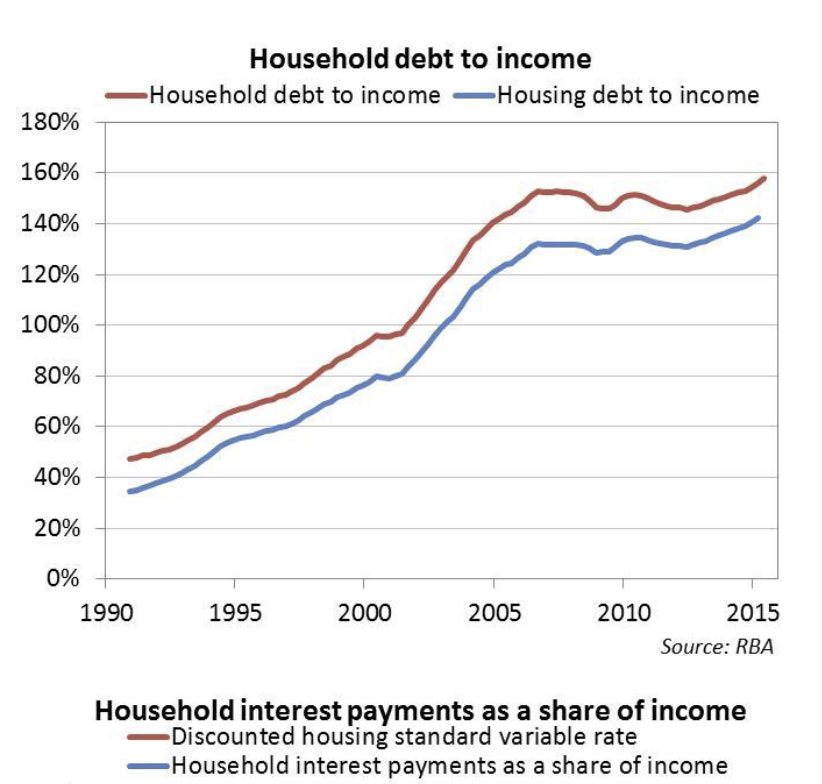
IMF-Home-LoansSupervision is important, he say’s given the high household debt involved. As with housing prices, these debt levels are at the higher end of the spectrum. Furthermore, after plateauing for much of the past decade, the household debt-to-income ratio has begun drifting upwards again. Households still have a significant (and growing) net worth, as housing assets are increasing in value faster than debt. Nevertheless, the trends in overall level of debt bear watching.Debt-to-IncomeHe acknowledges the change in mix of loans, with the growth of investor loans.
Turning to the composition of loan portfolios, a notable change has been the well-publicised growth in lending to investors. In terms of the outstanding stock of housing lending, investors account for more than one-third; of the current flow of approvals, investors now account for more than 40 per cent. For comparison, in the mid-1990’s both those proportions were around half today’s levels.

A key question is: does this compositional shift change portfolio risk profiles? Australian data suggests that there has been little difference in the propensity of investor loans to become impaired, vis-à-vis those to owner-occupiers. However, caution is needed given the lack of any period of severe household stress over the past two decades: evidence from other countries suggests we should be wary of extrapolating the current Australian experience into more stressful scenarios.

Of course, it is not just the nature of the borrower, but also the growth in lending, that acts as a warning sign for supervisors. When we wrote to ADIs in December 2014, we flagged a benchmark for investor lending growth of 10 per cent, or higher, as a sign of increased risk. We highlighted investor lending because it was an area of accelerating credit growth and strong competition: a combination in which the temptation to compete and protect market share could drive a weakening of credit standards. By moderating growth aspirations, we are reducing the tendency for ADIs to whittle away lending standards in the name of ‘matching our competitors’ – when it comes to lower standards, it’s always the other guy’s fault.

He highlighted the rising share of loans originated via brokers.
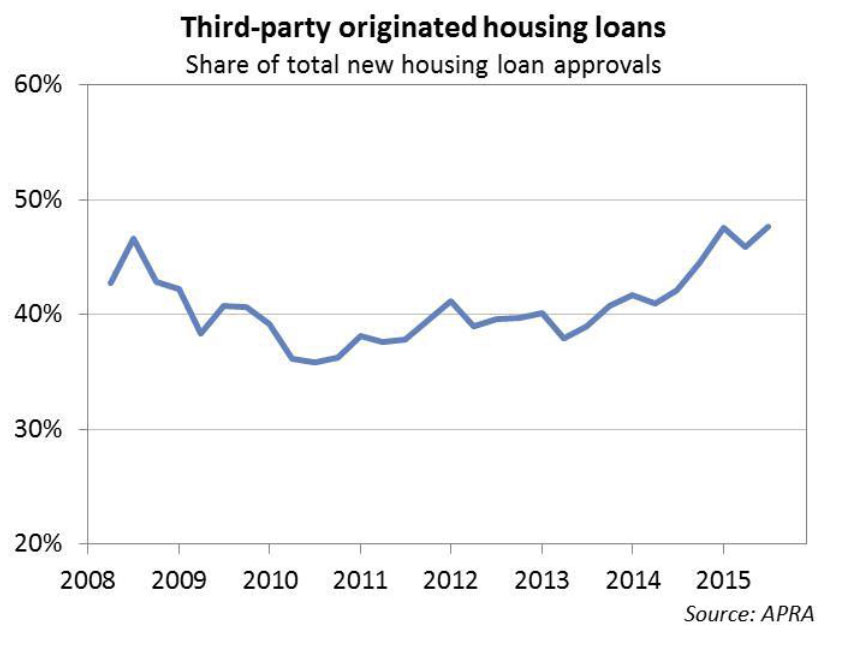
Third-PartyAnother feature of the home lending market has been the increasing use of third-party distribution channels. There are potentially significant advantages from such an approach: for example, allowing smaller lenders or new entrants to compete more readily against the established branch networks of the bigger players. On the other hand, third-party-originated loans tend to have a materially higher default rate compared to loans originated through proprietary channels. This does not mean third-party channels have lower underwriting standards, but simply that the new business that flows through these channels appears to be of higher risk, and must be managed with appropriate care.

He also described the rise in interest only loans, and changes in LVR ratios as highlighted in yesterdays APRA data, which we discussed in detail already.

Finally, he discussed lending standards.

The final layer of analysis has been our detailed review of lending standards at individual lenders. We published some conclusions from this in May,6 and highlighted a few areas where standards were not what they could or should be. Examples included, generous interpretations of the stability and reliability of borrowers’ incomes; borrowers assumed to have very meagre living expenses; and/or a reliance on interest rates not rising very much, or (more puzzlingly) rising on new debts but not existing ones.

ASIC’s recently announced review of interest-only home lending made similar findings.

The industry has responded with improved practices in the past few months. For example, it is now commonplace for lenders to apply a haircut to unstable sources of income, and to assume a minimum interest rate of around 7.25 per cent – well above rates currently being paid – when assessing a borrower’s ability to service a loan. These steps should give greater comfort about the quality of new business now being written.

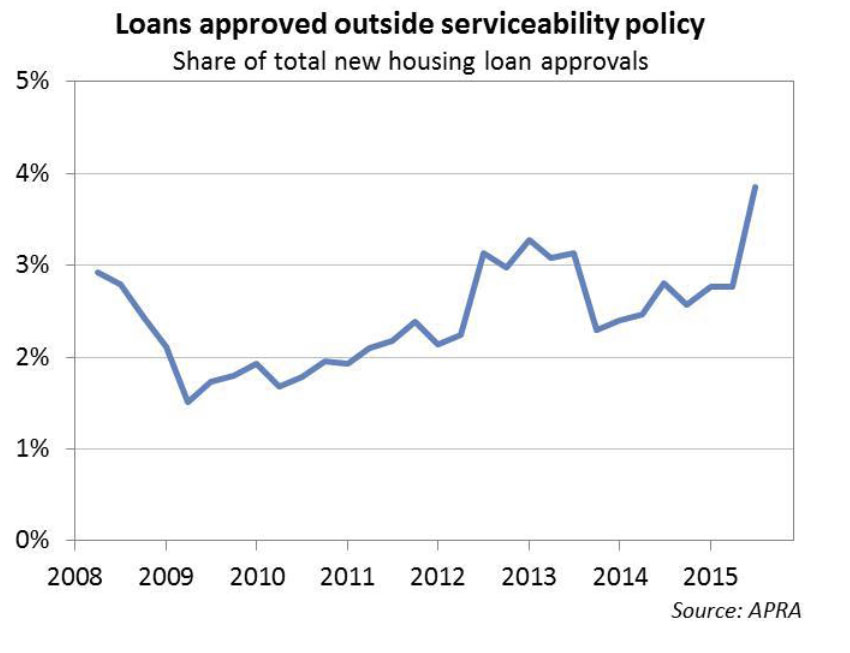
However, a close eye will need to kept on policy overrides – in other words, the extent to which lenders approve loans outside their standard policy parameters. There are some definitional issues that mean care is needed with this data, but the rising trend for loans to be approved outside policy needs to be watched: as lenders strengthen their lending policies, it’s important to make sure this good intent isn’t being undone by an increasing number of policy exceptions.
OutsideServiceBefore I wrap up, I’d like to comment on the potential for further action by APRA, including targeted measures that, it has been suggested, we should employ to specifically respond to rising housing prices in Sydney and Melbourne. In response, I would make three points:

First, our mandate is to preserve the resilience of the banking system, not to influence prices in particular regions; second, the broader environmental factors I outlined at the start of my remarks – high housing prices, high debt levels, low interest rates and subdued income growth – are not present only in our two largest cities; and
third, sound lending standards – prudently estimating borrower income and expenses, and not assuming interest rates will stay low forever – are just as important (and maybe even more so) in an environment where price growth is subdued as they are in markets where prices are rising quickly.

That is not to say that geographic measures would never be contemplated. Parallels are often drawn with New Zealand, where specific measures have been directed at the rapid price appreciation in Auckland. In comparing the respective actions on both sides of the ditch, it’s important to note the Reserve Bank of New Zealand (RBNZ) initiated measures for Auckland only after first instituting a range of measures that applied New Zealand-wide. In other words, more targeted measures built on, rather than substituted for, measures to reduce financial stability risks nationally.

Given many changes to lenders’ policies, practices and pricing are still relatively recent, it is too early to say whether further action might be needed to preserve the resilience of the banking system. We remain open to taking additional steps if needed, but from my perspective the best outcome will be if lenders themselves maintain a healthy dose of common sense in their lending practices, and reduce the need for APRA to do more.
 

ADI Property Exposures to June 2015 – Up and Away!

APRA released their latest quarterly ADI property exposure data today. The publication contains information on ADIs’ commercial property exposures, residential property exposures and new housing loan approvals. Detailed statistics on residential property exposures and new housing loan approvals are included for ADIs with greater than $1 billion in housing loans.

ADIs’ commercial property exposures were $233.7 billion, an increase of $9.9 billion (4.4 per cent) over the year to 30 June 2015. Commercial property exposures within Australia were $194.0 billion, equivalent to 83.0 per cent of all commercial property exposures.

ADIs’ total domestic housing loans were $1.3 trillion, an increase of $97.1 billion (7.9 per cent) over the year. There were 5.4 million housing loans outstanding with an average balance of $243,000.

ADIs with greater than $1 billion in housing loans approved $96.0 billion of new loans, an increase of $10.5 billion (12.2 per cent) on the quarter ending 30 June 2014. Of these new loan approvals, $55.1 billion (57.4 per cent) were owner-occupied loans and $41.0 billion (42.6 per cent) were investment loans.

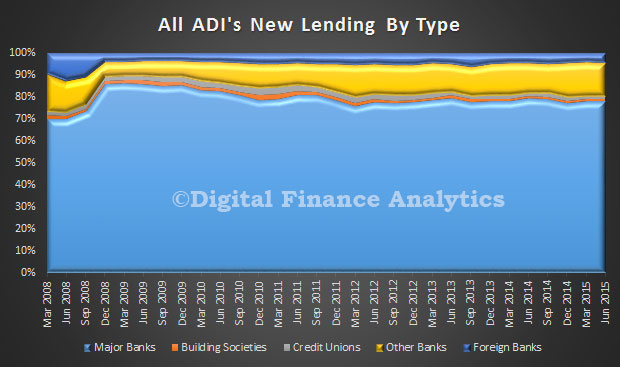
Looking at the housing related data in detail, we see major banks wrote about 80% of all home loans, other banks had about 13% of the market, the rest covered by building societies, credit unions and foreign banks.

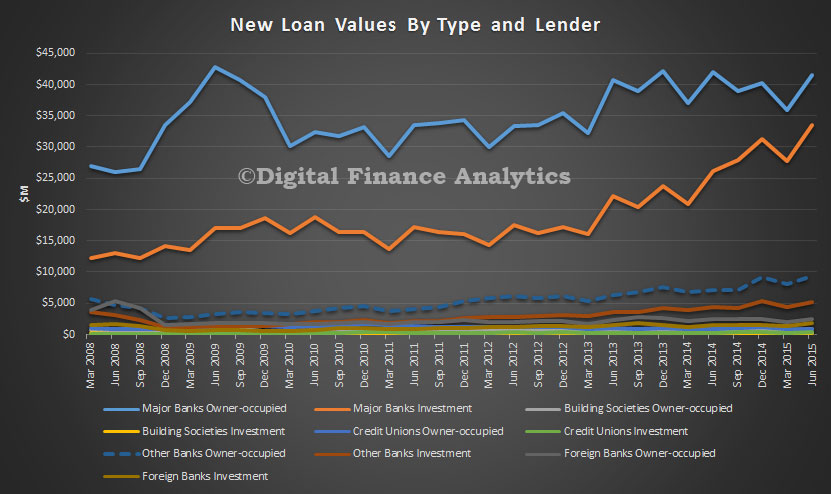
APRA-June2015-NewLoansByMixLooking at the relative value of loans, major banks still have the lion’s share, and we see the continued growth in investment lending

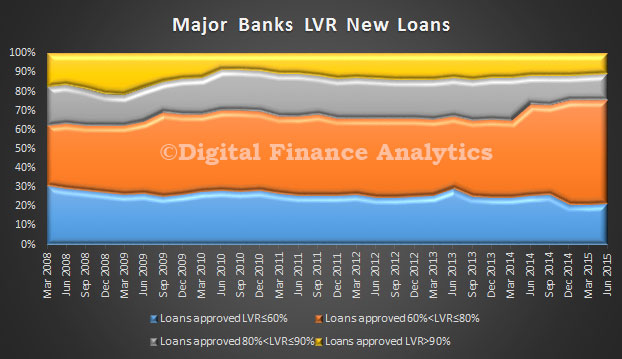
APRA-June2015-NewLoansByValueLooking at the LVR’s of new loans, we see that major banks have upped the proportion in the 60-80% range, and there is a slight reduction in loans over 90%. Clearly lending criteria have been tightened.

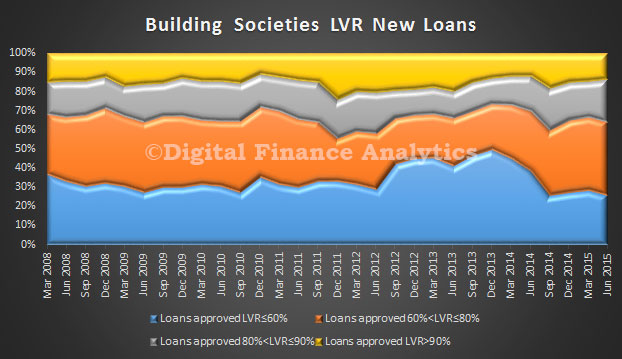
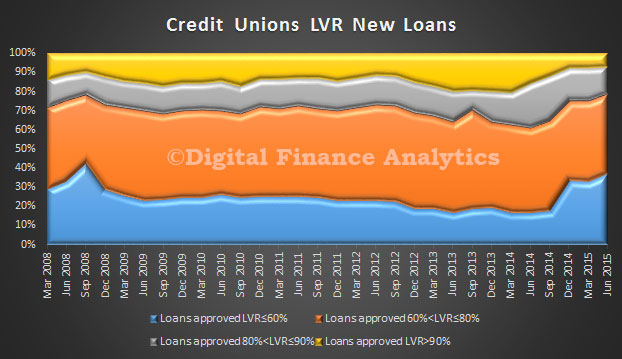
APRA-June2015-NewLoansLVRMajorBanksBuilding societies are writing more than 10% of loans over 90%, significantly more than credit unions.

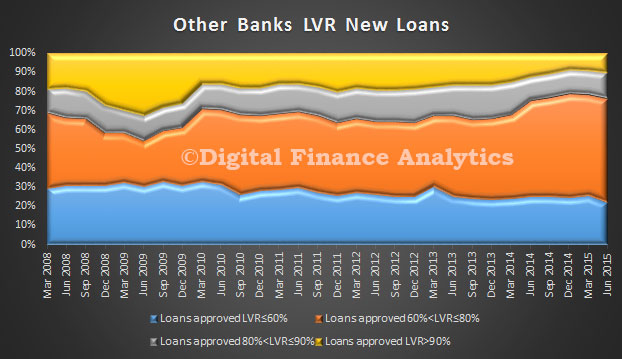
APRA-June2015-NewLoansLVRBuildingSocieties APRA-June2015-NewLoansLVRCreditUnionsOther banks (excluding majors) also dialled back higher LVR loans but grew then past quarter and also grew their relative mix of 60-80% LVR loans.

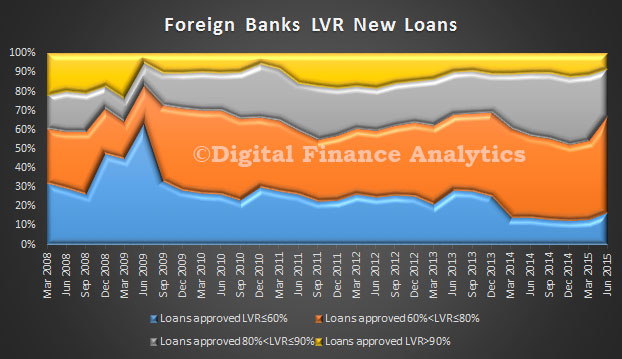
APRA-June2015-NewLoansLVROtherBanksForeign banks new high LVR loans fell. Once again we see growth in the 60-80% LVR range.

APRA-June2015-NewLoansLVRForeognBanks

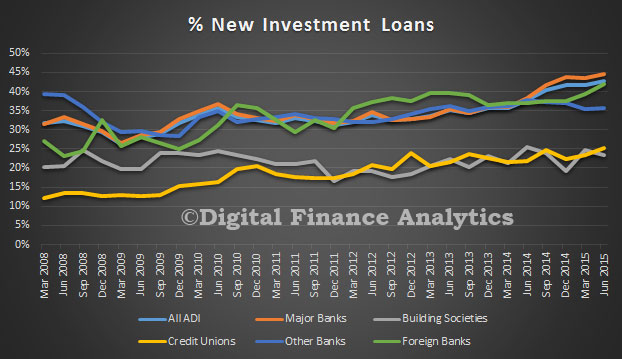
New investment loans grew with the majors (ANZ reclassified loans in the quarter), other banks investment loans fell slightly

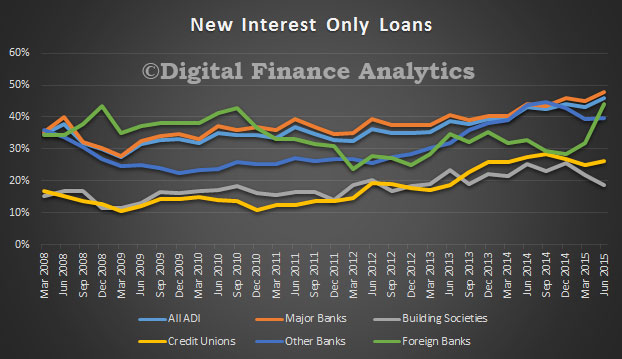
APRA-June2015-NewInvestmentLoansThere was significant growth in interest only loans, foreign banks were strongly up.

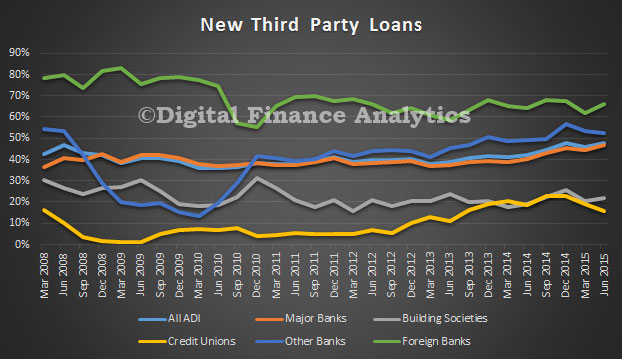
APRA-June2015-NewInterestOnlyLoansOverall about 46% of all new loans were written via third party channels. We see the majors continuing to grow their broker origination, whilst credit unions and foreign banks use of brokers fell.

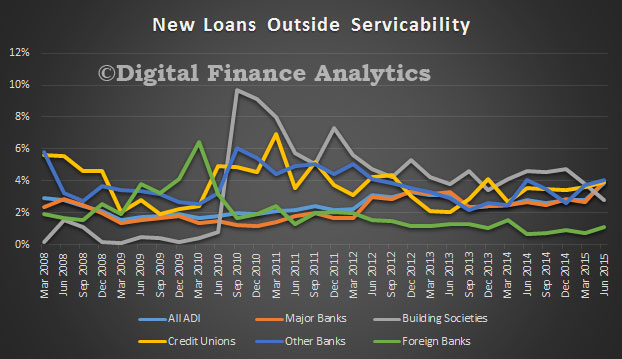
APRA-June2015-NewThirdPartyLoansOverall, the proportion of out of serviceability criteria fell, but overall about 4% of new loans were approved outside normal criteria.

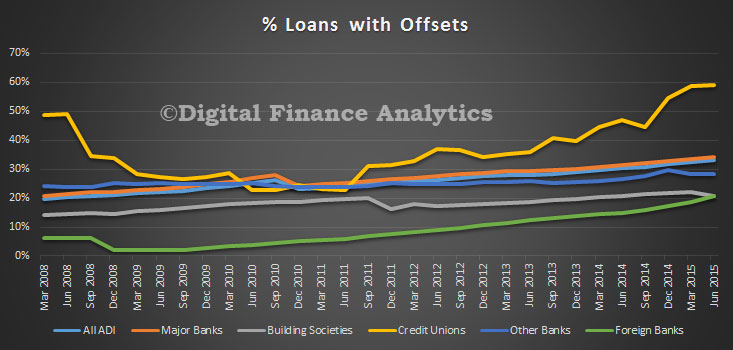
APRA-June2015-NewOutsideServicabilityLoansLoans with offset facilities continued to rise, with credit unions leading the way.

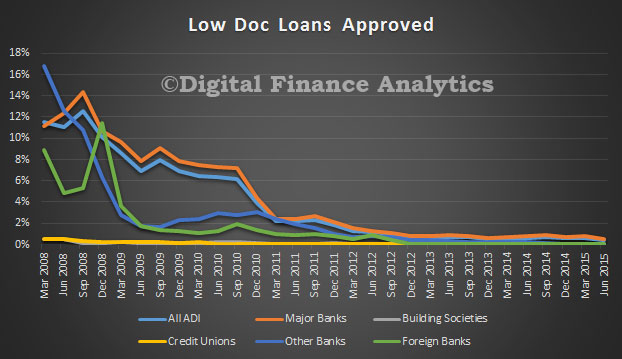
APRA-June2015-OffsetLoansFinally, low documentation loans continue to languish.

APRA-June2015-LowDocLoansByMix

APRA releases updated guidelines on section 66 of Banking Act

The Australian Prudential Regulation Authority (APRA) has today released updated guidelines in relation to section 66 of the Banking Act 1959. Section 66 deals with the use of restricted terms in relation to banking services.

Under section 66 and 66A of the Banking Act the use of a number of terms is restricted to those institutions that are authorised by APRA to carry on banking business. These terms include the use of ‘bank’, ‘banker’, ‘banking’, ‘building society’, ‘credit union’, ‘credit society’, ‘authorised deposit-taking institution’ and ‘ADI’.

These terms are restricted for use only by authorised deposit-taking institutions (ADIs) regulated by APRA to ensure potential customers are not misled into believing that non-APRA-regulated institutions have the same level of capital adequacy, depositor-priority and other prudential protections that apply to ADIs.

The updated guidelines provide additional information for institutions not regulated by APRA, including information on activities that are likely to be considered ‘financial’; information that should be included in an application to use restricted terms; and the likely timeframes for APRA to consider an application. The updated guidelines issued today also clarify and confirm APRA’s existing policy and practice which restrict the use of the terms ‘banker’ and ‘banking’ by ADIs that are not banks.

The Guidelines – Implementation of section 66 of the Banking Act 1959, have been updated by APRA following a consultation on draft revised guidelines issued in April 2013.

The guidelines can be found on the APRA website at:  www.apra.gov.au/adi/Pages/adi-authorisation-guidelines.aspx.

APRA’s Opening Statement to Inquiry on Home Ownership

Wayne Byres opening remarks to the House of Representatives Standing Committee on Economics Inquiry into Home Ownership. He suggests that investment loan growth rates are likely to remain above 10% for some time yet.

Our submission to the Inquiry noted the steps APRA has been taking to reinforce sound lending standards in the housing sector. As we have noted, these efforts are not targeted at promoting home ownership or housing affordability. Rather, our goal has been to preserve the financial strength of the banking sector, by ensuring authorised deposit-taking institutions (ADIs) are well capitalised and lending on a sound basis, and borrowers are well placed to continue to meet their commitments regardless of changes in the economic environment in future.

It is important to note that APRA’s concerns are not driven solely by housing price growth in the major markets of Sydney and Melbourne. Our objective has been to ensure that in the broader environment of high house prices, high household debt, historically low interest rates and subdued income growth – along with strong competitive pressures within the financial system – sound lending standards are maintained across the board. Thus far, we have not imposed formal regulatory requirements in relation to lending practices: put simply, we have requested banks to take a prudent view of borrower income, ensure they are not underestimating a borrower’s living expenses, and allow for the fact that interest rates will not always be as low as they are today. None of this should be seen as anything other than common sense. Our greater scrutiny has, however, prompted some changes to market practice as more aggressive lending has moderated.

When it comes to the growth of investor lending, we have flagged a benchmark of 10 per cent; above that, ADIs may need additional capital. Actual growth remains marginally above this level, and may well be so for the next few months, but we have seen clear moderation in the previous strong upward trajectory, and the large lenders have all indicated their intention to move within this benchmark. This has generated a range of responses over the past month or so, including, most recently, differential pricing for owner-occupiers and investors.

We’re happy to answer further questions on the impact of our initiatives this morning. In addition, since we made our submission we have also announced another measure that is expected to impact on housing lending dynamics. That is, on 20 July we announced an increase in risk weights for housing loans for those banks that use their own internal models to determine their capital requirements (the major banks and Macquarie Bank). This decision was taken in response to a number of factors:

  • competition issues highlighted by the FSI;
  • the direction of international work being undertaken by the Basel Committee on Banking Supervision to improve the reliability and comparability of risk models; and
  • the desire to strengthen the resilience of ADIs using internal models and, through that, the broader financial system.

In very rough terms, the higher risk weights will require each affected bank to fund each $100 of housing loans with, on average, about $1 extra in shareholders’ funds (and hence $1 less in depositors’ funds or other debt). Given implementation is still 11 months away, it is too early to assess the impact of this change on the housing loan market.  However, all other things being equal, the change will reduce the return on equity from housing lending for the affected banks. The extent to which those banks are capable of repricing their business in response will provide an interesting insight into the extent to which the largest banks are subject to competitive pressure from the range of other housing lenders present in the market.

[Revised] APRA Data Shows Investment Growth Still Strong

Now we have the data from ANZ, we have revised the APRA data sets for the last year, to see the true position with regards to movements in the home loans portfolios. This post revises that made Friday, (though the data is correct based on the released APRA figures.

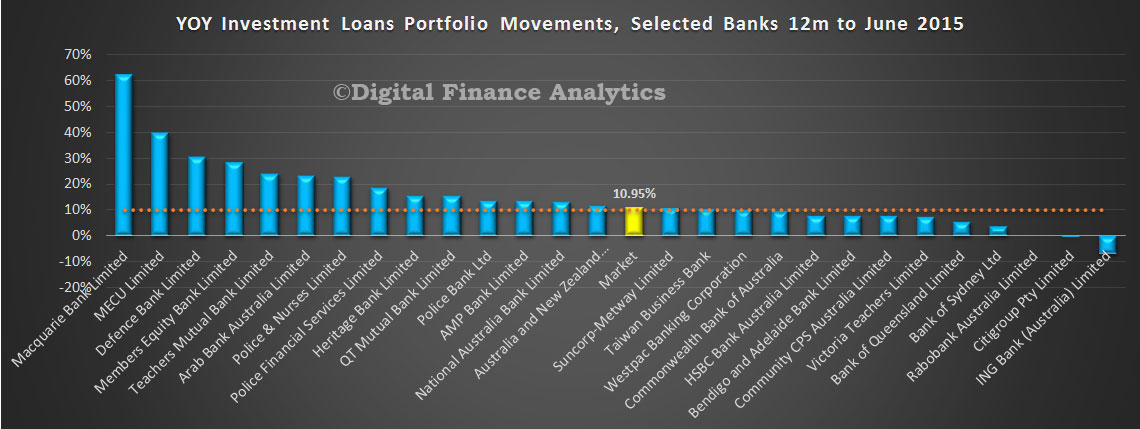
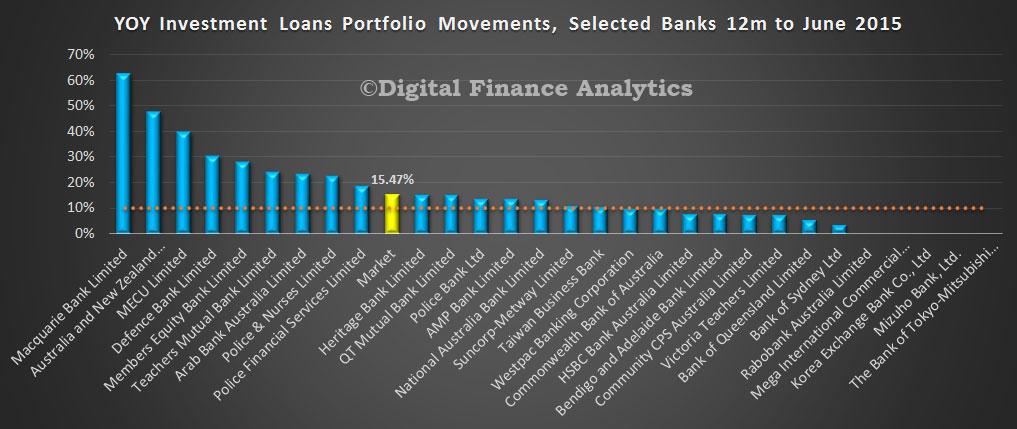
We have adjusted the ANZ and market total lines by the changes ANZ announced late Friday.  As a result, ADI market growth for investment loans is 10.95% (based on the total movements over the 12 months to June 2015). A number of players remain well above the 10% speed limit.

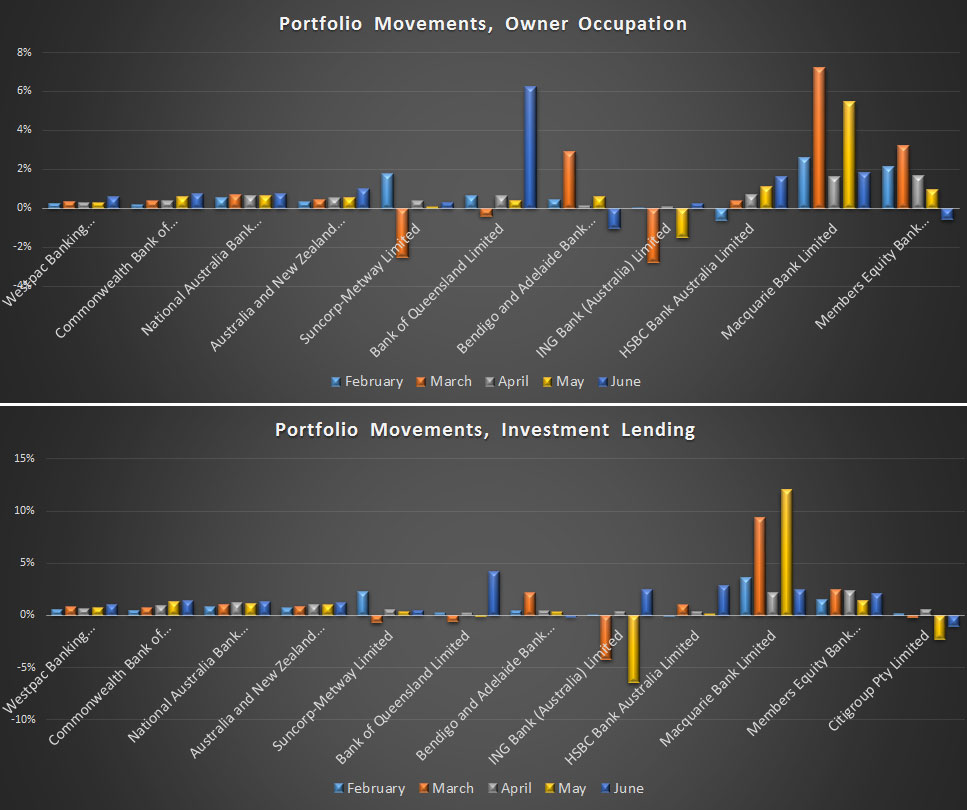
APRA-MBS-June2015-INVGrowthANZTweakThe next charts show the portfolio movements for both owner occupied and investment loans.

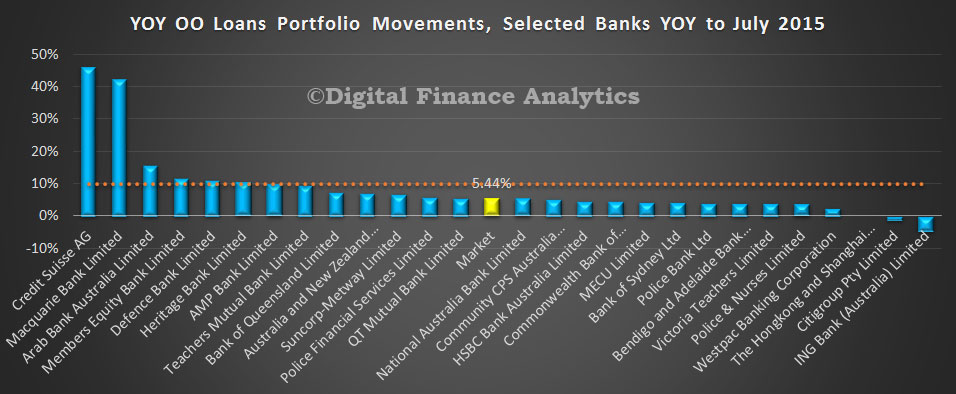
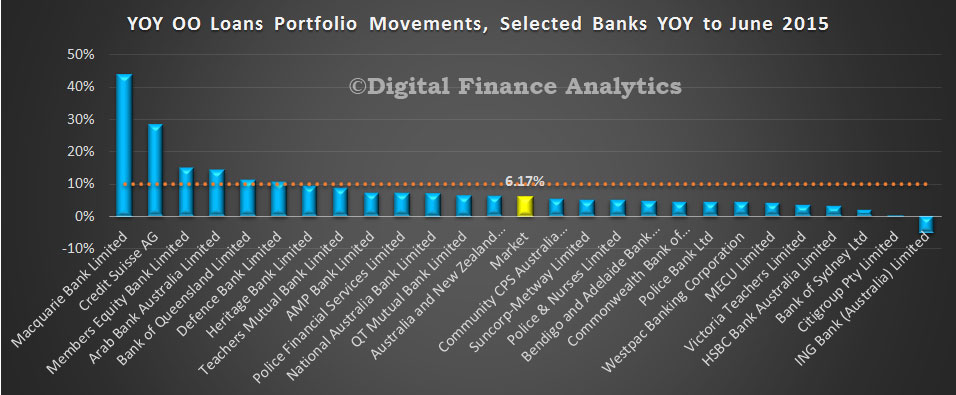
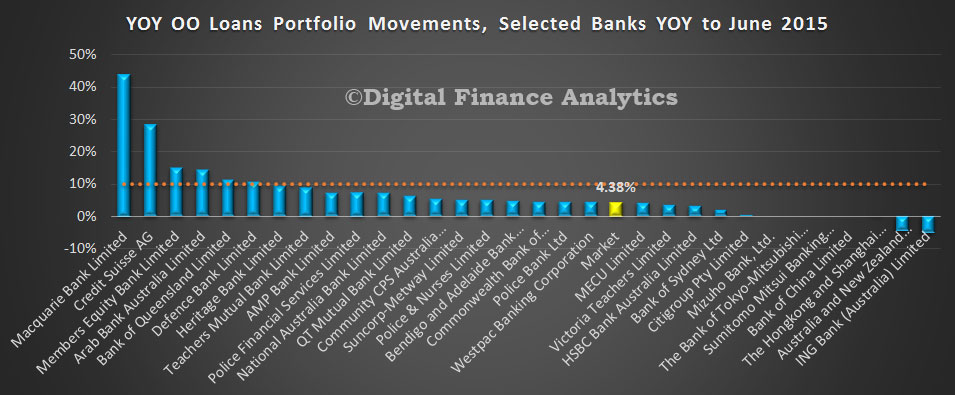
APRA-MBS-June2015-MonMovementANZTweakedFinally, here is the revised owner occupied loans data. Annual growth 6.17%. There is no 10% speed limit from the regulator, but we put the line in for comparison purposes.

APRA-MBS-June2015-OOGrowthANZTweak A final observation, the investment loan growth depends how you calculate it, and where you draw the numbers from. Our preferred approach is to take the growth each month, and add 12 months data together to make the 10.95%. The other approach is to take the data from June 2015, and compare it with July 2014. In that case the market growth is 10.6%. Some analysts gross up the last three months to give annualised rate of over 13%. The RBA data (which includes the non-banks) shows a 12 month growth rate of 10.4% (both original and seasonally adjusted) by summing the monthly changes, or 12.4% if you take the last 3 months data and annualise that. The conclusion is that investment loan growth rates were showing no signs of slowing to June. Lets see what happens in future months.  Also, consider this. APRA imposed the speed limit at 10%, but with no explanation why 10% was a good number. DFA is of the view that the hurdle rate should be significantly lower to have any meaningful impact.

APRA MBS Says Investment Loans Higher – But Beware!

The APRA monthly banking statistics for the ADI’s to June 2015 were released today.  Home investment lending does not show signs of cooling, so this explains the recent more overt pressure being applied by the regulators. We will look at home lending first. The banks grew their lending book by 1.33% in the month to 1.37 trillion. Remember this is the stock of loans. RBA reported total loans were $1,481 bn, the difference being the non-banks.

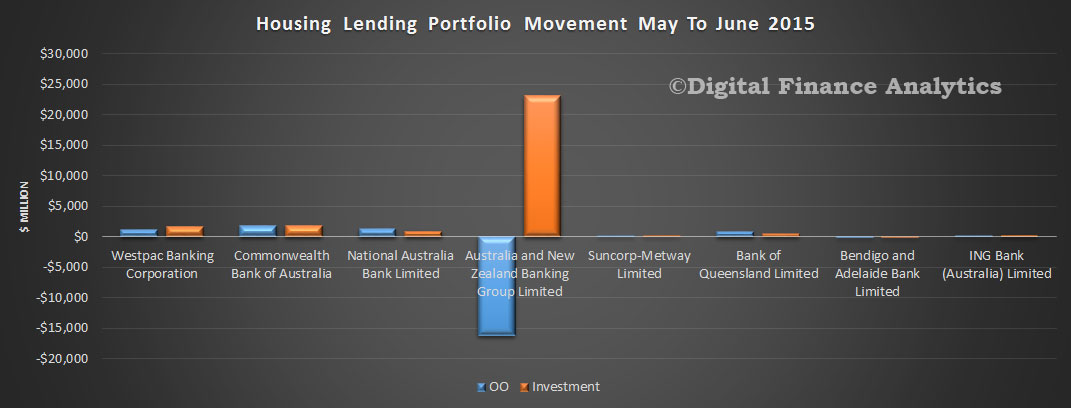
Within that, owner occupied loans were down 1.24% and investment loans were up 5.99%.  Investment loans were worth $507 bn. But this is due to a massive adjustment in the data relating to ANZ. Between May and June, the APRA ANZ data shows their owner occupied loans dropped by $16.2 bn and their investment book grew by $23 bn. We think this helps to explains ANZ’s announcement earlier. Clearly some loans have been reclassified between May and June, so this distorts the overall market picture. APRA’s report on revisions does not really help us. That said, here is the detailed analysis.

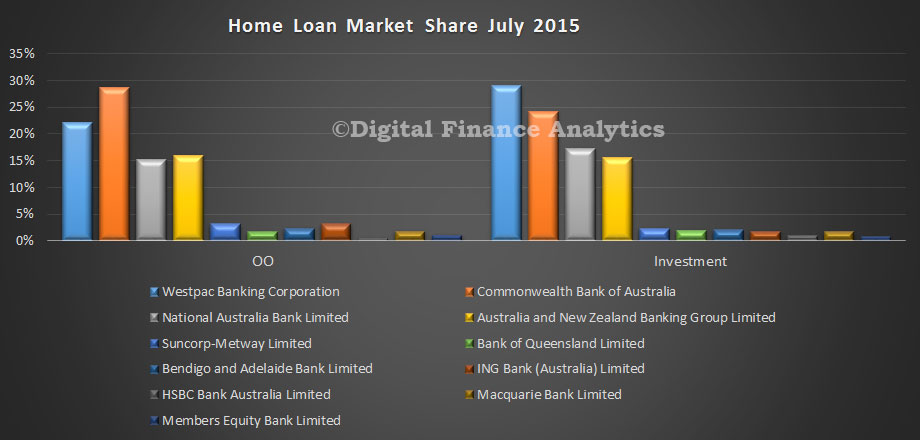
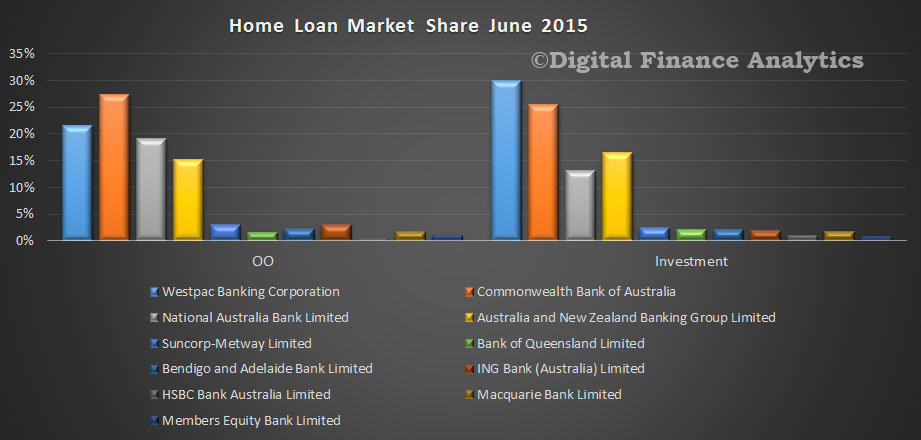
CBA has the largest share of owner occupied loans, with 27.36% of the market. Westpac has 30% of all investment property lending. ANZ had 15.12% of owner occupied loans, and 16.46% of investment loans (under the revised data in June).

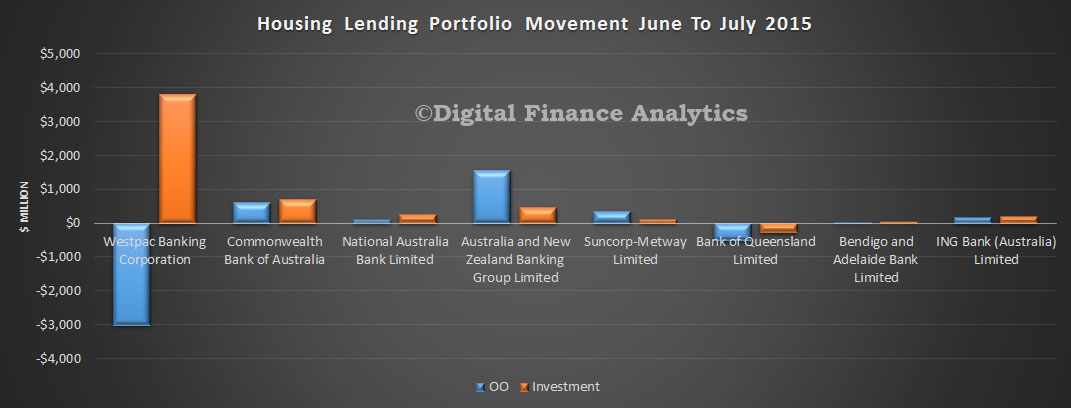
APRA-MBS-June2015-HomeLoanShareThe portfolio movements May to June show the ANZ swing, and not much else!

APRA-MBS-June2015-MonMovementThe APRA speed bump of 10% is well and truly exceeded this month because of the swing in ANZ. The market grew at an annualised rate of over 15% and many large and small players are well above the threshold – ANZ was at 47% – but this is because of the adjustment. The true growth rate is lower. But, no visible impact of the APRA guidelines so far.

APRA-MBS-June2015-INVGrowthFor comparison purposes, here is the data for owner occupied loans – and though no formal speed limit is in place, we have shown the 10% benchmark. The market grew at 4.3% in the past 12 months. The true rate is higher.

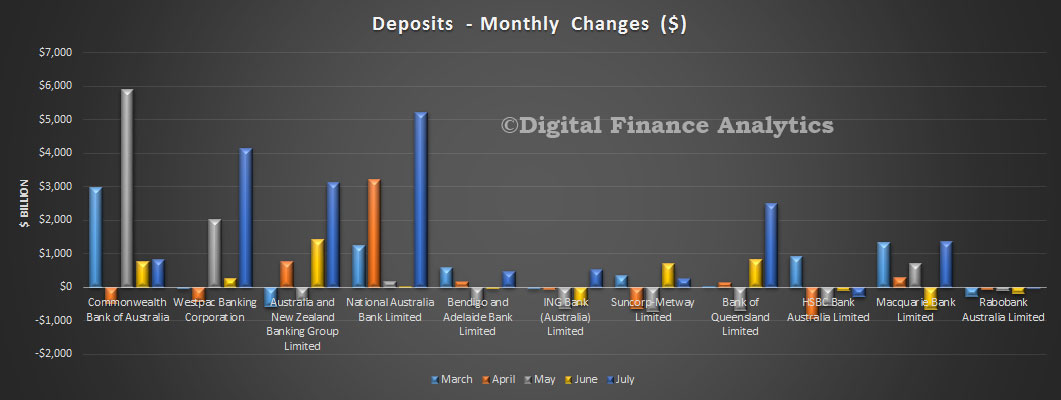
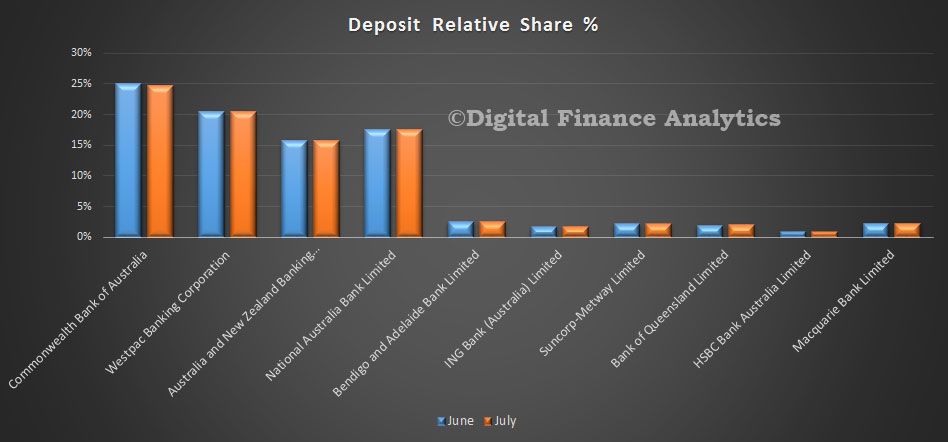
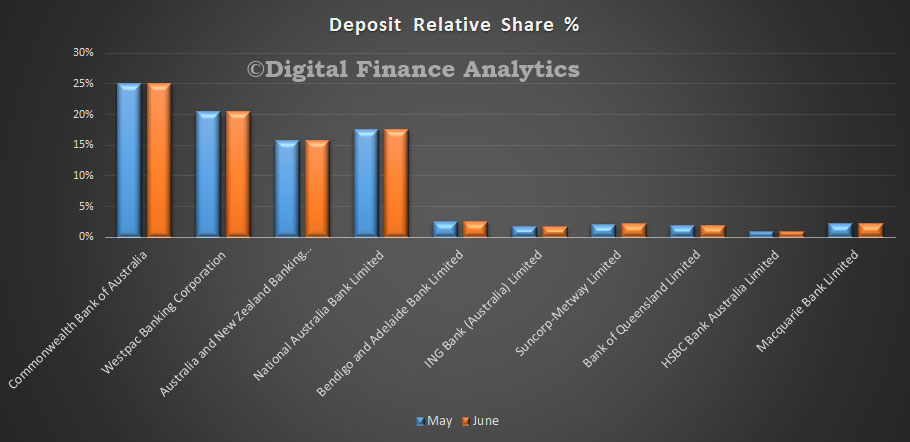
APRA-MBS-June2015-OOGrowthTurning to deposits, little change in the month, total deposits were down just a tad to $1.83 trillion. Little movement in relative shares.

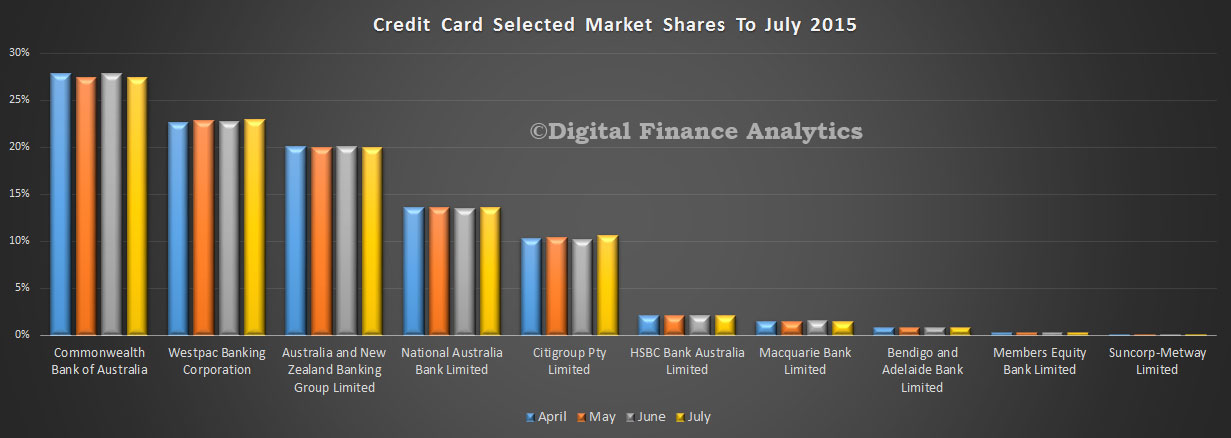
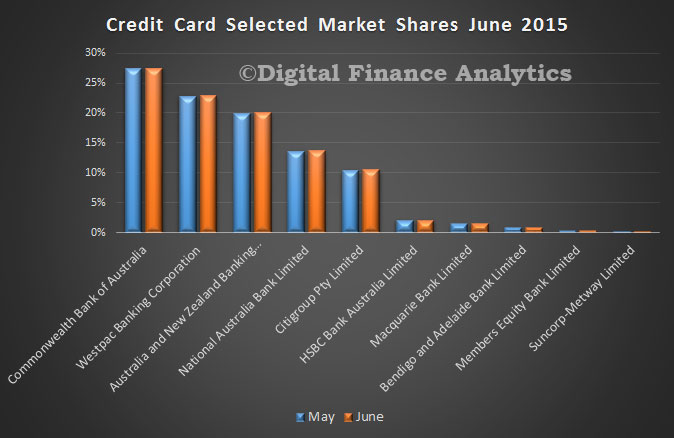
APRA-MBS-June2015-DepositShareOn the credit card portfolios, there was a rise of 0.4% in balances outstanding, to $41.5 bn. No significant change in the relative share.

APRA-MBS-June2015-CardsShare

Higher Mortgage Risk-Weights First Step to Strengthen Australian Bank Capital – Fitch

Fitch Ratings states that an increase in the minimum average Australian residential mortgage risk-weight for banks accredited to use the internal ratings-based (IRB) approach for regulatory capital calculations was expected, and is only the first step in higher capital requirements for these banks. Greater levels of capital are likely to be required over the next 18-24 months as further measures from Australia’s 2014 Financial Services Inquiry (FSI) are implemented and adjustments to the global Basel framework are finalised.

The announced increase in minimum mortgage risk-weights is the first response to the final FSI report, published December 2014, which also recommended Australian banks’ capital positions be ‘unquestionably strong’. The latter recommendation is aimed at improving the resilience of the banking system given its reliance on offshore funding markets, its highly concentrated nature, and the similarity in the business models of most Australian banks. The change in mortgage risk-weights should provide a modest boost to the competitiveness of smaller Australian deposit takers that currently use the standardised approach for regulatory capital calculations.

The change announced by the Australian Prudential Regulation Authority (APRA) on 20 July 2015 is likely to be the first of a number of changes made to strengthen the capital positions of Australian banks. APRA referred to the higher risk-weights as an interim measure, with final calibration between IRB and standardised models expected once the Basel committee’s review of the framework is completed – this is unlikely to be before the end of 2015.

The move will result in minimum average risk-weights for Australian residential mortgage portfolios increasing to at least 25% from around 16% at the moment. APRA estimates this would increase minimum common equity tier 1 (CET1) requirements by about 80bps for Australia’s four major banks – Australia and New Zealand Banking Group Limited (ANZ; AA-/ Stable), Commonwealth Bank of Australia (CBA; AA-/ Stable), National Australia Bank Limited (NAB; AA-/ Stable), and Westpac Banking Corporation (Westpac; AA-/ Stable). This is equivalent to nearly AUD12bn for the four banks based on regulatory capital disclosures at 31 March 2015. The only other bank to be impacted is Macquarie Bank Limited (A/ Stable) which has estimated a CET1 impact of about 20bps, or AUD150m.

The higher risk weights will be implemented on 1 July 2016, giving the affected banks nearly 12 months to address capital shortfalls. Sound profitability means that shortfalls could be met through internal means – the AUD12bn is equivalent to about 40% of annualised 1H15 net profit after tax for the four major banks. Fitch expects the banks will look at increasing the discount on dividend reinvestment plans, and/or underwriting participation in these schemes to meet shortfalls. However, raising capital in equity markets is also an option to address both the requirement early and in anticipation of future increases in regulatory capital requirements. Banks have already begun increasing capital positions, with a number of the major banks announcing capital management activity at their 1H15 results.
The size of the increased capital requirement will vary across the banks based upon their loan portfolio compositions – CBA and Westpac have the largest Australian mortgage portfolios and therefore their minimum capital requirements are expected to be the most impacted.

ANZ Re-balances Mortgage Pricing

As we foreshadowed, the banks are beginning to tweak their mortgage strategies in response to the 10% cap in investment loans, and in a drive to re-balance towards owner-occupied borrowers.

ANZ today announced interest rates for residential investment property loans will increase to manage investor lending growth targets and in response to changing market conditions. There is no change to other variable lending rates including the Standard Variable Rate for owner-occupied home loans or for business lending. Fixed rates for new owner-occupied home lending will be reduced by up to 0.40%.

Effective Monday, 10 August 2015, ANZ’s variable Residential Investment Property Loan (RIPL) Index Rate will rise by 0.27% to 5.65%pa (5.76%pa comparison rate). Fixed rates for new Residential Investment Lending will also increase by up to 0.30%.

ANZ CEO Australia Mark Whelan said: “Although interest rates for residential property investors are at very low levels historically, the decision to raise interest rates for residential investment lending has been difficult but necessary in the current environment. “It allows us to balance the mix of our lending between owner-occupied and investment lending as well as the impact of changing market conditions. This includes a decision to cut fixed rates for new owner-occupied home lending. “This is a considered decision that takes into account our customers’ position and the criteria we look at when setting rates including our competitive position, our regulatory obligations and the state of the residential property market,” Mr Whelan said. ANZ has also introduced a series of other measures recently to improve the mix between investor and owner occupied lending. For residential investment lending, these include reducing interest rate discounts, increasing the deposit required to at least 10% and increasing interest rate sensitivity buffers.

Those who are above APRA’s 10% guidance will be dialing investment loans down and turning to owner occupied loans to bolster their mortgage portfolio growth. On the other hand, those below the 10% threshold seem to be seeing an opportunity to grow their investment portfolio as others pull back. Non-banks are also joining in. Banks who are well above the 10% annual target will of course have to write smaller numbers of loans in the second half to balance out the full year.

MBS-May-2015--Loans-YOY-InvThe other factor in play are the capital changes APRA announced this week, from 16% to 25% for IRB banks by July 2016. ANZ’s approach of applying the lift in investment loan rates to its entire variable portfolio indicates their strategy is designed to take account of the capital allocation changes ahead. It will be interesting to see if other banks follow suit and we see investment loans repriced across the market. We think this is a likely outcome.