APRA Reinforces Sound Residential Mortgage Lending Practices

The Australian Prudential Regulation Authority (APRA) has today written to authorised deposit-taking institutions (ADIs) outlining further steps it plans to take to reinforce sound residential mortgage lending practices. These steps have been developed following discussions with other members of the Council of Financial Regulators.

In the context of historically low interest rates, high levels of household debt, strong competition in the housing market and accelerating credit growth, APRA has indicated it will be further increasing the level of supervisory oversight on mortgage lending in the period ahead.

At this point in time, APRA does not propose to introduce across-the-board increases in capital requirements, or caps on particular types of loans, to address current risks in the housing sector. However, APRA has flagged to ADIs that it will be paying particular attention to specific areas of prudential concern. These include:

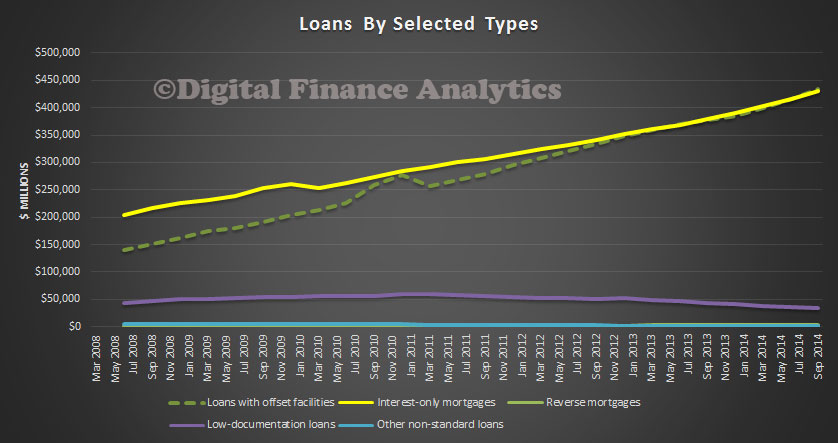
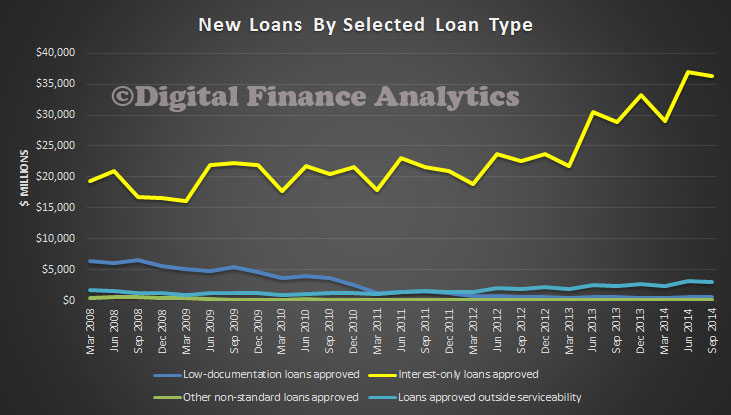
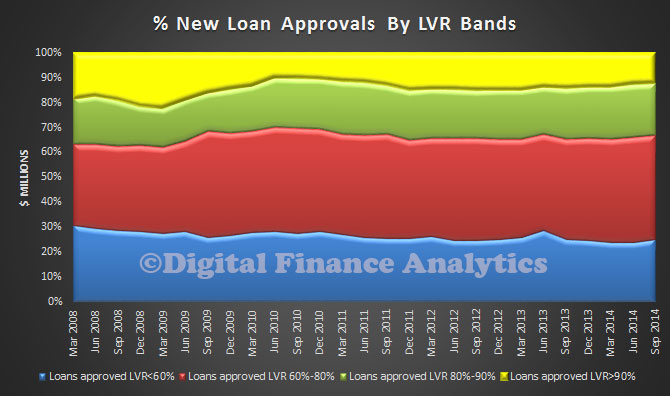
  • higher risk mortgage lending — for example, high loan-to-income loans, high loan-to-valuation (LVR) loans, interest-only loans to owner occupiers, and loans with very long terms;
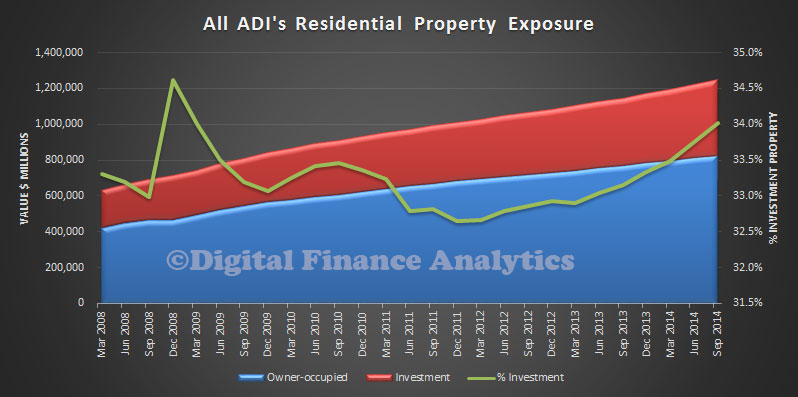
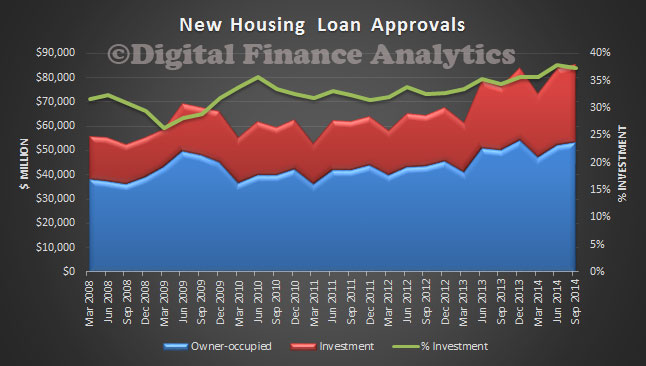
  • strong growth in lending to property investors — portfolio growth materially above a threshold of 10 per cent will be an important risk indicator for APRA supervisors in considering the need for further action;
  • loan affordability tests for new borrowers — in APRA’s view, these should incorporate an interest rate buffer of at least 2 per cent above the loan product rate, and a floor lending rate of at least 7 per cent, when assessing borrowers’ ability to service their loans. Good practice would be to maintain a buffer and floor rate comfortably above these levels.

In the first quarter of 2015, APRA supervisors will be reviewing ADIs’ lending practices and, where an ADI is not maintaining a prudent approach, may institute further supervisory action. This could include increases in the level of capital that those individual ADIs are required to hold.

APRA Chairman Wayne Byres noted that while in many cases ADIs already operate in line with these expectations, the steps announced today will help guard against a relaxation of lending standards and, where relevant, prompt some ADIs to adopt a more prudent approach in the current environment.

‘This is a measured and targeted response to emerging pressures in the housing market. These steps represent a dialling up in the intensity of APRA’s supervision, proportionate to the current level of risk and targeted at specific higher risk lending practices in individual ADIs’ he said.

‘There are other steps open to APRA, should risks intensify or lending standards weaken and, in conjunction with other members of the Council of Financial Regulators, we will continue to keep these under active review.’

The steps announced today build on the enhanced monitoring and supervisory oversight of residential mortgage lending risks that APRA has put in place over the past year, which has included a major stress test of the banking industry, targeted reviews of ADIs’ residential mortgage lending and the release of detailed guidance to ADIs on sound residential mortgage lending practices.

APRA’s heightened supervisory focus on lending standards will be conducted in conjunction with the review of interest-only lending announced today by the Australian Securities and Investments Commission (ASIC). APRA and other members of the Council of Financial Regulators will continue to work closely together to monitor, assess and respond to risks in the housing market as they develop.

Today’s letter to ADIs can be found on the APRA website here: www.apra.gov.au/adi/Publications/Pages/other-information-for-adis.aspx
BACKGROUND

Q: What impact does APRA expect this announcement to have?
A: The aim of this announcement is to further reinforce sound residential mortgage lending practices in the context of historically low interest rates, high levels of household debt, strong competition in the housing market and accelerating housing credit growth. We expect this announcement will help guard against any relaxation of lending standards, and also prompt some ADIs to reinforce their lending practices where there is scope for a more prudent approach in the current risk environment.

Q: What ‘higher risk lending’ practices will APRA be focussing on?
A: APRA will be focussing on the extent to which ADIs are lending at high multiples of borrower’s income, lending at high loan-to-valuation ratios, lending on an interest-only basis to owner-occupiers for lengthy periods and lending for very long terms.

Q: How was the 10 per cent threshold for investor lending determined?
A: The 10 per cent benchmark is not a hard limit, but is a key risk indicator for supervisors in the current environment. The benchmark has been established after advice from members of the Council of Financial Regulators, taking into account a range of factors including income growth and recent market trends.

Q: How was the 2 per cent buffer and 7 per cent floor lending rate determined?
A: The guidance on serviceability assessments was based on a number of considerations, including past increases in lending rates in Australia and other jurisdictions, market forecasts for interest rates, international benchmarks for serviceability buffers, and long-run average lending rates.

Q: Is the 10 per cent growth in investor lending, or the 2 per cent buffer, a hard limit?
A: No. These figures are intended to be trigger points for more intense supervisory action.  Where banks are achieving materially faster growth, utilising a lower buffer, and/or otherwise materially growing the other higher risk parts of their portfolio, it will be a trigger for supervisors to consider whether more intensive supervisory action, including higher capital requirements, may be warranted.

Q: What sort of supervisory action might be considered if banks exceed these thresholds?
A: There are a range of actions that APRA can take, depending on the circumstances. These could include some or all of increased reporting obligations, additional on-site reviews, mandated reviews by external parties, and higher capital requirements.

Q: How may this affect borrowers from obtaining home loans from ADIs?
A: APRA does not expect this to have any effect on the availability of credit for people borrowing within their means to purchase a home. ADIs already conduct affordability tests to ensure that new borrowers are not overstretching themselves to purchase property, or relying on expectations of future increases in house prices to afford to do so. This guidance will primarily guard against any further relaxation in standards.

Q. Why has APRA not introduced high LVR or serviceability limits, as in other countries?
A: In short, we do not see those sorts of limits as necessary or appropriate at this stage.  APRA’s response has been targeted on the specific areas of prudential concern in the current environment: these include risks around serviceability when interest rates are at historically low levels, strong investor loan growth and broader considerations of each ADI’s risk profile. The impact of any APRA actions will therefore be felt by those banks pursing higher risk lending strategies and/or using lower loan underwriting standards.

There is, of course, a range of further actions that could be taken in relation to residential mortgage lending practices if the risk outlook intensifies, and APRA  will continue to keep these under review as market conditions and lending standards evolve.

Q: What role did the Council of Financial Regulators play in the decision-making?
A: Given that these supervisory tools sit within APRA’s supervisory and regulatory framework, APRA is ultimately responsible for determining the appropriate supervisory response. However, we have taken advice from other members of the Council of Financial Regulators in developing our approach, and will continue to do so. ASIC has also today announced a review that it will be carrying out a review of interest-only lending, which will support APRA’s efforts to reinforce sound lending practices.

Q: Why is there a threshold for growth in investor lending, not total housing credit?
A: There is currently very strong growth in lending to property investors, as highlighted by the Reserve Bank in its most recent Financial Stability Review (FSR). This is leading to imbalances in the housing market; the RBA noted in the FSR that “the direct risks to financial institutions would increase if these high rates of lending growth persist, or increase further.” APRA’s approach has therefore sought to target the higher areas of risk.

Q: Does this relate to the recommendation on risk weights in the Financial System Inquiry report?
A: No. The recommendation on risk weights in the FSI report is focused on competitive issues with risk modelling, whereas the announcement today is in relation to further supervisory steps to address specific risks in residential mortgage lending.

The Australian Prudential Regulation Authority (APRA) is the prudential regulator of the Australian financial services industry. It oversees Australia’s banks, credit unions, building societies, life and general insurance companies and reinsurance companies, friendly societies and most of the superannuation industry. APRA is funded largely by the industries that it supervises. It was established on 1 July 1998. APRA currently supervises institutions holding $4.9 trillion in assets for Australian depositors, policyholders and superannuation fund members.

Investment Lending Burns Bright

APRA released their monthly banking statistics for October 2014 today. The total value of housing lending rose to $1.298 trillion, from $1.288 in September, up 0.81%. Of this however, Investment lending rose 1.03% by $4.59 billion and Owner Occupied Lending rose 0.69% by $5.79 billion. This data relates the the banks (ADI’s) excluding the non-bank sector. This is normally about $110 billion.

Looking in detail at the bank by banks analysis, we see a familiar set of trends.

HomeLendingOctober2014ByADIWestpac leads the pack on investment mortgage lending, with a 31.8% share, whilst CBA leads with owner occupied lending with 27.1% share.

HomeLendingSharesOctober2014ByADILooking at the movements, only ING Bank recorded a fall in value in their portfolio. Macquarie grew the strongest. This relates to the $1.5 billion portfolio of non-branded mortgages they purchased from ING in September.

HomeLendingMovementsOctober2014ByADILooking in percentage terms, we see that Macquarie and AMP grew well above system, and ING below in October.

HomeLendingPCMovementsOctober2014ByADITurning to deposits, they fell by 0.06% in the month, to a value of $1.76 trillion. There was little movement between players, though given the growth in loans above, it is clear that wholesale funding is being accessed now, and this explains the continued fall in deposit interest rates.

DepositTotalsOctoberCBA maintains its position as the largest deposit holder, with 24.5% of the market.

DepositSharesOct2014

Looking at movements, we see Rabobank growing their deposits in percentage terms the strongest in the month, a reversal from previous recent months. Other than ANZ, the majors all lost a little share. Suncorp grew its book also.

DepositMovementsOctoberIn cards, balances rose by about $50 million, to $40.4 billion.

CardBalancesOct2014CBA continues to hold the largest cards share with 27.8% of the market.

CardSharesOct2014

Banks And Their Capital

APRA today published the quarterly ADI performance statistics to September 2014.

Over the year ending 30 September 2014, ADIs recorded net profit after tax of $33.5 billion. This is an increase of $3.6 billion (12.0 per cent) on the year ending 30 September 2013.

As at 30 September 2014, the total assets of ADIs were $4.2 trillion, an increase of $345.0 billion (9.1 per cent) over the year. The total capital base of ADIs was $210.4 billion at 30 September 2014 and risk-weighted assets were $1.7 trillion at that date. The capital adequacy ratio for all ADIs was 12.4 per cent.

Impaired assets and past due items were $29.1 billion, a decrease of $7.4 billion (20.3 per cent) over the year. Total provisions were $16.6 billion, a decrease of $6.1 billion (26.9 per cent) over the year.

We have been looking at the relative capital positions of the banks, highly relevant in the current climate where we expect the FSI inquiry report to be commenting on this, as well as the current regulatory reviews, globally and locally.

So we have taken the All Bank data and compared the Tier 1 capital ratio (the yellow line) with a plot of the ratio of lending to capital held. Because the mix of loans has changed, with a greater proportion relating to lending for housing, and the fact that these loans have lower capital weighting, the reported Tier 1 capital is significantly better than the true, unweighted position. In fact, banks are holding relatively less capital against their loan books now compared with before the GFC. This is one reason why capital ratios are under review.

Capital-AnalysisALL-Sept-2014Now, if we look only at the APRA data for the big four banks, we see an even wider divergence, enabled by the advanced capital calculations which enable these banks to hold even less capital against certain housing loan categories. This places the major banks at a competitive pricing advantage.

Capital-Analysis-Sept-2014Almost certainly, the majors will be required, in due course to hold more capital, and this may tilt the playing field towards some of the smaller players. It may also mean lower returns of deposit accounts, and and reduced loan discounting. Overall profitability for some players will also be tested, though we believe there is plenty of slack in the system currently.


ADI Residential Property Exposures Up Again

APRA published their quarterly ADI property statistics today to September 2014. ADIs’ total domestic housing loans were $1.3 trillion, an increase of $103.4 billion (9.0 per cent) over the year. There were 5.2 million housing loans outstanding with an average balance of $239,000. The proportion of investment loans moved higher again to 34% of all loans on book. DFA survey data shows a correlation between interest only and investment loans, (thanks to the benefits of negative equity), but APRA does not provide any linked data on this.

LoanExposSep2014-LoanValuesStockLooking at total loan stock, we see a continued rise in interest only mortgages, and loans with offset facilities. Reverse mortgages, low documentation loans and other non-standard mortgages are relatively controlled by comparison.

LoanExposSep2014-LoanTypesStockTurning to the flow data (loans written each month), ADIs with greater than $1 billion of residential term loans approved $85.4 billion of new loans, an increase of $9.1 billion (11.9 per cent) over the year. Of these new loan approvals, $53.5 billion (62.6 per cent) were owner-occupied loans and $31.9 billion (37.4 per cent) were investment loans. Thus we see that overall monthly totals continue to rise, and investment loans are growing faster than owner occupied loans. The 37.4% of investment loans September is understated because the owner-occupied lending data includes refinances, which should be removed from the analysis, to give a true picture of new lending.

LoanExposSep2014-LoanValue

Looking in more detail, we see the value of interest only loans rising in recent months, and also a small rise in the number of loans approved outside serviceability. Low documentation loans remain controlled.

LoanExposSep2014-LoanTypesFlowLooking at lending by LVR bands we see about 40% of loans being written are above 80% loan to value, and of these around 10% are above 90%. No data is provided on the proportion of loans covered by lender mortgage insurance. This should be.

LoanExposSep2014-LVRBrokers are having a field day at the moment, with commissions being increased, and values written rising. The APRA data shows 43.2% of all loans by value were originated via third party channels.

LoanExposSep2014-Third-PartySo, the RBA’s plan that the property sector should take up some of the slack left by the evaporating mining sector is still playing out. However, lending for investment property, and interest only lending have higher risks attached, and we think changes to capital rules are still likely to emerge to try and address some of the implicit risks.

Finally, ADIs’ commercial property exposures were $225.5 billion, an increase of $13.5 billion (6.4 per cent) over the year. Commercial property exposures within Australia were $187.4 billion, equivalent to 83.1 per cent of all commercial property exposures.

APRA Extends Basel III Consultation

APRA today extended the consultation period on the changes to Basel III disclosure requirements.

On 18 September 2014, APRA released for consultation a discussion paper and draft amendments to Prudential Standard APS 110 Capital Adequacy and Prudential Standard APS 330 Public Disclosure, which outlined APRA’s proposed implementation of new disclosure requirements for authorised deposit-taking institutions (ADIs).

The disclosures are in relation to:

  • the leverage ratio;
  • the liquidity coverage ratio; and
  • the identification of potential globally systemically important banks.

This consultation package also proposed minor amendments to rectify minor deviations from APRA’s implementation of the Basel Committee’s Basel III framework.

APRA’s intention was that, subject to the outcome of the consultation, these amendments would come into effect from 1 January 2015. A number of matters remain to be addressed before APRA is able to finalise the new standards. Accordingly, given the limited period of time remaining before the scheduled implementation date, APRA is advising affected ADIs that any new requirements will not take effect until 1 April 2015 at the earliest.

Super Now Worth $1.87 Trillion – APRA

APRA just released their quarterly super statistics to September 2014. Superannuation assets totalled $1.87 trillion at the end of the September 2014 quarter. Over the 12 months to September 2014 this represents a 9.6 per cent increase. Total assets in MySuper products was $378.1 billion at the end of the September 2014 quarter. Over the 12 months to September 2014 this represents a 128.2 per cent increase.

Of these, $1.14 trillion are regulated by APRA and these grew by 2.2% since the previous quarter, whereas $ 557 million are self-managed super assets  managed by the ATO and this grew by 0.2% since June 2014.

SuperSept20141However, the number of SMSFs grew by 1.6% from the previous quarter, to stand at more than 539,000 funds.

SuperSept20142Looking in more detail at the APRA regulated funds, with more than four members, there were $23.6 billion of contributions in the September 2014 quarter, up 7.2 per cent from the September 2013 quarter ($22.0 billion). Total contributions for the year ending September 2014 were $96.8 billion. Outward benefit transfers exceeded inward benefit transfers by $471 million in the September 2014 quarter. There were $15.1 billion in total benefit payments in the September 2014 quarter, an increase of 10.9 per cent from the September 2013 quarter ($13.7 billion). Total benefit payments for the year ending September 2014 were $57.1 billion. Net contribution flows (contributions plus net benefit transfers less benefit payments) totalled $8.0 billion in the September 2014 quarter, an increase of 9.6 per cent from the September 2013 quarter ($7.3 billion). Net contribution flows for the year ending September 2014 were $37.8 billion. Net contribution flows (contributions plus net benefit transfers less benefit payments) totalled $8.0 billion in the September 2014 quarter, an increase of 9.6 per cent from the September 2013 quarter ($7.3 billion). Net contribution flows for the year ending September 2014 were $37.8 billion. The graph below shows the composition of net contribution flows for each quarter from December 2008 to September 2014.

SuperSept20143The annual industry-wide rate of return (ROR) for entities with more than four members for the year ending 30 September 2014 was 8.2 per cent. For the five-years to September 2014 the annualised geometric-average ROR was 6.9 per cent. The graph below shows the ROR for each quarter from December 2004 to September 2014. The rate of return (ROR) represents the net earnings on superannuation assets and measures the combined earnings of a superannuation fund’s assets across all its products and investment options.

SuperSept20144As at the end of the September 2014 quarter, 51 per cent of the $1,219.7 million investments for entities with at least four members were invested in equities; 33 per cent of investments were invested in fixed income and cash investments; 12 per cent of investments were invested in property and infrastructure and 4 per cent were invested in other assets, including hedge funds, and commodities.

Note that small APRA funds (SAFs) and Single Member Approved Deposit funds (SMADFs) do not report quarterly to APRA. Therefore the quarterly assets of these funds are estimated based on the assets they report to APRA in their annual returns. This is done using a straight line growth methodology.


Australian Securitisation Under The Microscope

Today, in a speech by Chris Aylmer, Head of Domestic Markets Department, RBA, we got an interesting summary of recent developments in the market. This is important, because as at June, the Bank held about $25 billion of these assets under repo as part of their liquidity management operations. In addition, at the same forum, Charles Litterell, EGM APRA discussed the planned reforms to prudential framework for securitisation, highlighting that APRA want to facilitate a much larger, but very simple and safe, funding-only market and also facilitate a capital-relief securitisation market. In both cases, they want to impose a simpler and safer prudential framework than has evolved internationally. The RBA comments are worth reading:

While conditions in global financial markets have improved since the depths of the global financial crisis, the market for asset-backed securities has notably lagged this improvement. Issuance of private-label asset-backed securities in the US is currently equivalent to around 1½ per cent of GDP, compared with an average of around 8 per cent in the first half of the 2000s (Graph 1). Issuance of private-label residential mortgage-backed securities (RMBS) has been virtually non-existent since 2008. In contrast, issuance of auto loan-backed securities is nearing its pre-crisis level. Issuance of securities backed by student-loans and credit card receivables is also growing, though it remains well below its pre-crisis peak.

sp-so-111114-graph1Activity in the European securitisation market remains very subdued, with annual issuance placed with investors relative to the size of the economy declining for the fourth year in a row. While the challenging economic conditions on the continent have contributed to this, European authorities have identified a number of other impediments and are developing proposals to address them.[2] In September the European Central Bank (ECB) announced that it will implement an asset-backed securities purchase program aimed at expanding the ECB’s balance sheet. While this program is not explicitly targeted at reviving the European ABS market, the ECB expects the programme to stimulate ABS issuance.

In comparison with its overseas counterparts, the Australian securitisation market, which remains predominantly an RMBS market, has experienced a strong recovery over the past couple of years, albeit not to pre global financial crisis levels. Issuance started to pick up in late 2012, reached a post-crisis high in 2013, and has remained high since then.

This mainly reflects the strong performance of Australian residential mortgages and the high quality of the collateral pools which are primarily fully documented prime mortgages. While delinquency rates on Australian prime residential mortgages increased after 2007, this increase was a lot less severe than in most other developed economies (Graph 2). Indeed, serious delinquencies in Australia, those of 90 days or longer, remained below 1 per cent and have declined since 2011 to around 0.5 per cent currently. Mortgage prepayment rates, which affect the timing of the payments to the RMBS notes, have also been relatively stable in Australia, resulting in subdued prepayment and extension risk for RMBS investors.

sp-so-111114-graph2Issuance margins on RMBS continued to tighten throughout this year across all categories of issuers (Graph 3). Banks have been able to place their latest AAA-rated tranches in the market at weighted average spreads of 80 basis points – the lowest level since late 2007. Spreads on the AAA-rated tranches of non-bank issued RMBS have also declined, to around 100 basis points. Investor demand has extended across the range of tranches, with a significant pick-up reported in demand for mezzanine notes. As a result, a number of issuers have priced their mezzanine notes at some of the tightest spreads since 2007.

sp-so-111114-graph3Similar to last year, RMBS issuance this year has mainly originated from the major banks (Graph 4). Indeed, issuance by the major banks is on par with their issuance prior to the global financial crisis. Issuance by other banks has also been robust this year, although it is still well below pre-crisis levels when these issuers accounted for around 40 per cent of the market.

sp-so-111114-graph4Mortgage originators have been active this year, although their issuance has predominantly been of prime RMBS. Mortgage originators have issued only $1.6 billion of non-conforming RMBS in 5 transactions so far this year. The number of mortgage originators active in the market in the past two years has increased relative to the period from 2009 to 2012.

They are an important presence in the market. In the period preceding the global financial crisis, mortgage originators took advantage of innovations in the packaging and pricing of risk. In doing so, they were able to undercut bank mortgage rates. The banks responded and spreads on mortgages declined markedly. While a number of large mortgage originators have exited the market, the presence of mortgage originators promotes competition in the mortgage market.

Issuance of asset-backed securities other than RMBS has generally been in line this year with previous years. Issuance of commercial mortgage-backed securities (CMBS) and other ABS this year has been around $5 billion, compared with an average of about $6 billion over the three preceding years.

The investor base in Australian ABS has continued to evolve (Graph 5). The stock of RMBS held by non-residents has been relatively steady since late 2010 suggesting that non-residents have been net buyers of Australian ABS. The strong performance of Australian RMBS and lack of issuance elsewhere may have been an important driver behind the participation of foreign investors. There has been a pick-up in RMBS holdings by Authorised deposit-taking institutions (ADIs) – they now hold just under 40 per cent of marketed ABS outstanding – with the major banks accounting for much of the increase.

sp-so-111114-graph5Holdings of ABS by real money domestic investors have gradually declined, to the point where these investors, in aggregate, now hold less than a quarter of what they held four years ago. The longer-term sustainability of the Australian securitisation market may well depend on increasing participation in the market by domestic real money investors.

One of the key structuring developments since mid 2007 has been the increase in credit subordination provided to the senior AAA-rated notes. This primarily reflects decreased reliance by the major banks on lenders mortgage insurance (LMI) support in their RMBS. This trend has been driven by investor preference for detaching the AAA-rating on the senior notes from the ratings of the LMI provider.

The increased subordination in the major banks’ RMBS has been to a level in excess of that required to achieve a AAA-rating without LMI support. This mitigates the downgrade risk owing to changes in ratings criteria. In contrast, other categories of RMBS issuers have continued to use LMI to support their structures, allowing them to achieve AAA-ratings on a larger share of their deals.

The RBA highlighted that “the risk management and valuation of ABS collateral is obviously an analytically intensive process, requiring considerable information about the security and the underlying assets. Over time we will further develop pricing and margins that reflect the specifics of the asset-backed security and its collateral pool. This could, for example, take the form of credit risk models of the collateral pool which take into account characteristics such as geographic concentrations, delinquencies and loan-to-value ratios. These collateral credit models will be combined with structural security models to calibrate margins specific to the security that reflect its projected behaviour under stress scenarios”.

APRA’s Stress Testing And Bank Optimism

APRA has released Wayne Byre’s speech at the ABF Randstad Leaders Lecture Series on Seeking strength in adversity: Lesson’s from APRA’s 2014 stress test on Australia’s largest banks.

He outlines the results of recent bank stress testing, with a focus on the exposure to mortgage lending. Essentially, the tests indicate that whilst capital buffers appear to be adequate, the assumptions made by the banks, in terms of raising further capital, and other mitigating factors may well be too optimistic. “Banks may well survive the stress, but that is not to say the system could sail through it with ease”.  The entire speech is worth reading, but I highlight some of his remarks.

Let me start by posing a question: are Australian banks adequately capitalised?

That’s a pretty important question, and one that the Financial System Inquiry is rightly focussed on. When compared against the Basel III capital requirements, they certainly seem to be. At end June 2014, the Common Equity Tier 1 ratio of the Australian banking system was 9.1 per cent, well above the APRA minimum requirement of 4.5 per cent currently in place, or 7.0 per cent when the capital conservation buffer comes into force in 2016. And in APRA’s view, after adjusting for differences in national application of the Basel standards, the largest Australian banks appear to be in the upper half of their global peers in terms of their capital strength. But the question remains: is that adequate?

There is no easy answer to that question. To answer it, you need to first answer another question: adequate for what?

Adequate to generate confidence is one simple answer. We require banks to have capital because they make their money by taking risks using other people’s money. That is not intended to sound improper; the financial intermediation provided by banks is critical to the efficient functioning of the economy. However, as very highly leveraged institutions at the centre of the financial system, investing in risky assets and offering depositors a capital guaranteed investment, we need confidence that banks can withstand periods of reasonable stress without jeopardising the interests of the broader community (except perhaps for their own shareholders). But what degree of confidence do we want?

Risk-based capital ratios are the traditional measure used to assess capital adequacy. Risk weights can be thought of as an indicator of likely loss on each asset on (and off) a bank’s balance sheet. So they tell us something about the maximum loss a bank can incur. But they don’t tell us anything about how likely, or under what scenario, those losses might eventuate.

Over the past decade, and particularly in the post-crisis period, regulators and banks have supplemented traditional measures of capital adequacy with stress testing. Stress testing helps provide a forward-looking view of resilience in a way in which static comparisons or benchmarks cannot. It provides an alternative lens through which the adequacy of capital can be assessed. In simple terms, it tries to answer the question: does a bank have enough capital to survive an adverse scenario – can we be confident it has strength in adversity?

Unsurprisingly, our stress test this year has targeted at risks in the housing market. The low risk nature of Australian housing portfolios has traditionally provided ballast for Australian banks – a steady income stream and low loss rates from housing loan books have helped keep the banks on a reasonably even keel, even when they are navigating otherwise stormy seas. But that does not mean that will always be the case. Leaving aside the current discussion of the state of the housing market, I want to highlight some key trends that demonstrate why housing risks and the capital strength of Australian banks are inextricably and increasingly intertwined.

Over the past ten years, the assets of Australian ADIs have grown from $1.5 trillion to $3.7 trillion. Over the same period, the paid-up capital and retained earnings have grown from $84 billion to $203 billion. Both have increased by almost identical amounts – close enough to 140 per cent each. This similarity in growth rates over the decade hides some divergent trends in individual years, but today the ratio of shareholders’ funds to the balance sheet assets of the Australian banking system – a simple measure of resilience – is virtually unchanged from a decade ago. Much of the recent build up in capital has simply reversed a decline in core equity in the pre-crisis period – as a result, on the whole we’re not that far from where we started from.

So how have regulatory capital ratios risen? Largely through changes in the composition of the asset side of the balance sheet. While the ratio of loans to assets has barely budged, the proportion of lending attributable to housing has increased from roughly 55 per cent to around 65 per cent today. Because housing loans are regarded as lower risk, the ratio of risk weighted assets to total (unweighted) assets has fallen quite noticeably – from 65 per cent to around 45 per cent. The impact of this trend is that, even though balance sheets have grown roughly in line with shareholders’ funds, risk-weighted assets have grown more slowly and regulatory capital ratios are correspondingly higher.

Results – Phase 1

In the first phase, banks projected a significant impact on profitability and marked declines in capital ratios in both scenarios, consistent with the deterioration in economic conditions. The stress impact on capital was driven by three principal forces: an increase in banks’ funding costs which reduced net interest income, growth in risk weighted assets as credit quality deteriorated, and of course, a substantial increase in credit losses as borrowers defaulted.  In aggregate, the level of credit losses projected by banks was comparable with the early 1990s recession in Australia, but unlike that experience, there were material losses on residential mortgages. This reflects the housing market epicentre of the scenarios, and also the increasing concentration of bank loan books on that single asset class. In each scenario, losses on residential mortgages totalled around $45 billion over a 5 year period, and accounted for a little under one-third of total credit losses. By international standards, this would be broadly in line with the 3 per cent loss rate for mortgages experienced in the UK in the early 1990s, but lower than in Ireland (5 per cent) and the United States (7 per cent) in recent years. In other words, banks’ modelling predicts housing losses would certainly be material, but not of the scale seen overseas.

Stress testing on this core portfolio is an imprecise art, given the lack of domestic stress data to model losses on. Beneath the aggregate results, there was a wide range of loss estimates produced by banks’ internal models. This variation applies both to the projections for the number of loans that would default, and the losses that would emerge if they did. Our view was that there seemed to be a greater range than differences in underlying risk are likely to imply.  Another key area where there were counter-intuitive results was from the modelling of the impact of higher interest rates on borrowers’ ability to meet mortgage repayments. Banks typically projected little differentiation in borrower default rates between the two scenarios, despite the very different paths of interest rates and implied borrowing costs. This raises the question whether banks could be underestimating the potential losses that could stem from sharply rising interest rates in the scenario. In the current low interest rate environment, this is a key area in which banks need to further develop their analytical capabilities.

Phase 2

The results in the second phase of the stress test, based on APRA estimates of stress loss, produced a similar message on overall capital loss – although the distribution across banks differed from Phase 1 as more consistent loss estimates were applied. Aggregate losses over the five years totalled around $170 billion under each scenario. Housing losses under Scenario A were $49 billion; they were $57 billion under Scenario B.

These aggregate losses produced a material decline in the capital ratio of the banking system. The key outcomes were:

  • Starting the scenario at 8.9 per cent, the aggregate Common Equity Tier 1 (CET1) ratio of the participant banks fell under Scenario A to a trough of  5.8 per cent in the second year of the crisis (that is, there was a decline of 3.1 percentage points), before slowly recovering after the peak of the losses had passed.
  • From the same starting point, under Scenario B the trough was 6.3 per cent, and experienced in the third year.
  • The ratios for Tier 1 and Total Capital followed a similar pattern as CET1 under both scenarios.
  • At an individual bank level there was a degree of variation in the peak-to trough fall in capital ratios, but importantly all remained above the minimum CET1 capital requirement of 4.5 per cent.

This broad set of results should not really be a surprise. It reflects the strengthening in capital ratios at an industry level over the past five years. But nor should it lead to complacency. Almost all banks projected that they would fall well into the capital conservation buffer range and would therefore be severely constrained on paying dividends and/or bonuses in both scenarios. For some banks, the conversion of Additional Tier 1 instruments would have been triggered as losses mounted. More generally, and even though CET1 requirements were not breached, it is unlikely that Australia would have the fully-functioning banking system it would like in such an environment. Banks with substantially reduced capital ratios would be severely constrained in their ability to raise funding (both in availability and pricing), and hence in their ability to advance credit. In short, we would have survived the stress, but the aftermath might not be entirely comfortable.
Recovery planning.

The aggregate results I have just referred to assume limited management action to avert or mitigate the worst aspects of the scenario. This is, of course, unrealistic: management would not just sit on their hands and watch the scenario unfold. As part of Phase 2, APRA also asked participating banks to provide results that included mitigating actions they envisaged taking in response to the stress. The scale of capital losses in the scenarios highlights the importance of these actions, to rebuild and maintain investor and depositor confidence if stressed conditions were to emerge.

This was an area of the stress test that was not completed, in our view, with entirely convincing answers. In many cases, there was clear evidence of optimism in banks’ estimates of the beneficial impact of some mitigating actions, including for example on cost-cutting or the implications of repricing loans. The feedback loops from these steps, such as a drop in income commensurate with a reduction in costs, or increase in bad debts as loans become more expensive for borrowers, were rarely appropriately considered.

Despite the commonality of actions assumed by banks, there was variation in the speed and level of capital rebuild targeted. Some banks projected quick and material rebuilds in their capital positions, after only a small “dip” into the capital conservation range. Other banks assumed that they would remain within the range for a long period of time. It is far from clear that a bank could reasonably operate in such an impaired state for such a length of time and still maintain market confidence.

Disappointingly, there was a only a very light linkage between the mitigating actions proposed by banks in the stress test and their recovery plans (or “living wills”), with loose references rather than comprehensive use. Recovery plans should have provided banks with ready-made responses with which to answer this aspect of the stress test. APRA will be engaging with banks following the stress test to review and improve this area of crisis preparedness.

Most importantly, the exercise also raised questions around the combined impact of banks’ responses. For example, proposed equity raisings, a cornerstone action in most plans, appeared reasonable in isolation – but may start to test the brink of market capacity when viewed in combination and context. The tightening of underwriting standards, another common feature, could have the potential to lead to a simultaneous contraction in lending and reduction in collateral values, complicating and delaying the economic recovery as we have seen in recent years in other jurisdictions. In other words, banks may well survive the stress, but that is not to say the system could sail through it with ease.

Concluding comments

To sum up, the Australian banking industry appears reasonably resilient to the immediate impacts of a severe downturn impacting the housing market. That is good news. But a note of caution is also needed – this comes with a potentially significant capital cost and with question marks over the ease of the recovery. The latter aspect is just as important as the former: if the system doesn’t have sufficient resilience to quickly bounce back from shocks, it risks compounding the shocks being experienced. Our conclusion is, therefore, that there is scope to further improve the resilience of the system.


APRA Releases Final Mortgage Lending Guidance

Following its earlier draft, APRA today released a final prudential practice guide for authorised deposit-taking institutions (ADIs) on sound risk management practices for residential mortgage lending.

Prudential Practice Guide APG 223 Residential mortgage lending (APG 223) provides guidance to ADIs on addressing housing credit risk within their risk management framework, applying sound loan origination criteria and appropriate security valuation methods, managing hardship loans and establishing a robust stress-testing framework.

There are a number of tweaks made in response to submissions they received. The intent remains unchanged.

Draft APG 223 has been amended to clarify APRA’s intention that senior management would review risk targets and internal controls, as appropriate, with Board oversight.

APRA has amended draft APG 223 to be consistent with CPS 220. That is, an ADI would set risk limits for various aspects of residential mortgage lending, so that the ADI operates well within its tolerance for credit risk.

APRA accepts that an ADI should seek to ensure that the portfolio in aggregate, and not the individual loan, is able to absorb substantial stress (such as in an economic downturn) without producing unexpectedly high loan default losses for the lender; and APRA has also clarified that the interest rate buffer would factor in increases over several years rather than the full term of the loan.

APRA expects ADIs to assess and verify a borrower’s income and expenses having regards to the particular circumstances of the borrower. In view of the uncertainty and challenges in estimating living expenses, APRA supports ADIs adopting a prudent approach. This would include the use of margins when benchmarks like HEM or HPI are incorporated into the assessment. Furthermore, consistent with the updated RG 209, APRA advises that the use of benchmarks such as HEM or HPI is not a replacement for verification and assessment of the borrower’s declared expenses. The APG 223 has been amended to ensure consistency with ASIC’s updated RG 209.

It is not APRA’s intention to restrict access to finance for impending retirees. However, it is not prudent for ADIs to rely on superannuation lump sums for repayment unless their quantum is verifiable and timing reasonably known, which is likely to be the case closer to retirement. Consequently APRA does not propose to amend the guidance in draft APG 223.

APRA’s industry-wide data on residential mortgage lending indicates that, over the past several years, both direct and broker originated home loan loss rates have been quite low, due to low default rates and continued growth in home loan collateral values. APRA’s data also indicates, however, that there is a significantly higher default rate for broker-originated loans compared to loans originated through proprietary channels. This higher default rate would be expected to translate to higher loss rates, particularly in adverse  circumstances. APRA has, however, made some amendments to APG 223 to address some of the specific comments made in submissions, e.g. the sections on risk appetite and remuneration.

The application of the remuneration requirements to all ‘persons whose activities may affect the financial soundness of the regulated institution’ is an existing requirement of CPS 510. Therefore,including brokers in an ADI’s remuneration policy is not new and APG 223 aligns remuneration and risk management in the important area of residential mortgage lending origination. For the avoidance of doubt, APG 223 is intend ed to capture an ADI’s engagement with its brokers, not how a broker firm pays its staff.

APRA considers it appropriate to retain references in APG 223 to the claw back of commissions; however, some amendments have been made to the guidance in this area. References to specific circumstances under which claw backs should occur have been removed; APG 223 instead refers to the importance of ensuring remuneration arrangements ‘discourage conflicts of interest and inappropriate behaviour’. In addition, APRA continues to encourage ADIs to monitor the performance of third – party originators, with a view to restricting or terminating relationships with originators who have unexpectedly elevated levels of loan defaults or materially deficient loan documentation and processing.

APRA considers that it is appropriate for ADIs to pay particular attention to potentially riskier loan types. The guidance identifies several types of loans that may fall into this category, but the examples are not intended to be exhaustive or definitive. Each type of loan may be appropriate in certain circumstances, and ultimately the need for specific portfolio limits should be assessed by each ADI with respect to its own portfolio.

The type of valuation undertaken may depend on the level of risk involved; however, the valuation approach should ensure adequate provisioning where required. APRA has amended the guidance to indicate that valuations other than a full revaluation may be appropriate in certain circumstances, e.g. for loans with a very low LVR.

Appropriate stress testing should be tailored to the particular risk exposures of an individual ADI. APRA’s supervisory experience is that serviceability data collected at loan origination remains useful for ongoing stress testing and portfolio risk management, and good practice suggests that this data should be retained while it possesses material value.

APRA has amended the section on LMI to acknowledge its use by ADIs as a risk mitigant, to smooth out the normal variability of losses that occurs over time and to diversify regional concentrations of risk.

Monthly Banking Statistics For September Shows Investment Loans Still Running

APRA just released their data for September 2014. This provides a breakdown of balances outstanding by financial institution across the main lines of business. This only includes players within their bailiwick.

Looking at home loans first, total balances rose from $1.28 to $1.288 trillion, with investment loans rising by 0.85% to $446.3 billion, and owner occupied loans by 0.44% to $841.1 billion. So investment lending forged ahead, again.

Looking at the relative shares, we see CBA with 27.2% of the owner occupied market, and Westpac with 31.9% of the investment home loan market. Together the two Sydney-based players dominate.

HomeLoanSharesSept2014We see that Bank of Queensland and Westpac have relatively the largest share of investment loans in their loan portfolios.

HomeLoanBalancesSept2014Looking at the month on month movements, we see the most significant movements in investment loans at Westpac and CBA. We also see Macquarie active on the investment loan front, wth a growth of 3.8% month on month, they grew their investment book the fastest. Macquarie also grew their owner occupied loan portfolio the fastest, at 2.7%.

HomeLoanMovementsSept2014Turning to deposits, total balances were up 1.03% month on month, to a total of $1.77 trillion. Looking at the individual players, CBA and WBC have dominant positions.

DepositSharesSept2014In relative terms, HSBC (3.2%) and CBA (2.3%) grew balances the fastest, Bank of Queensland and Rabobank both lost balances.

DepositMoveentsSept2014Switching to Credit Cards, balances fell slightly in the month, at $40.2 billion. There is little change in the individual portfolios amongst the big four and Citigroup.

CreditCardBalancesSept2014


CreditCardSharesSept2014