The Bank for International Settlements released a paper “Why does financial sector growth crowd out real economic growth?” The paper suggests that rather than encouraging a bigger banking sector, we should be careful because a larger finance sector actually kills growth in the real economy. That is an important insight, given that in Australia, the ratio of bank assets to GDP is higher than its ever been, and growing, at a time when economic growth in anemic.
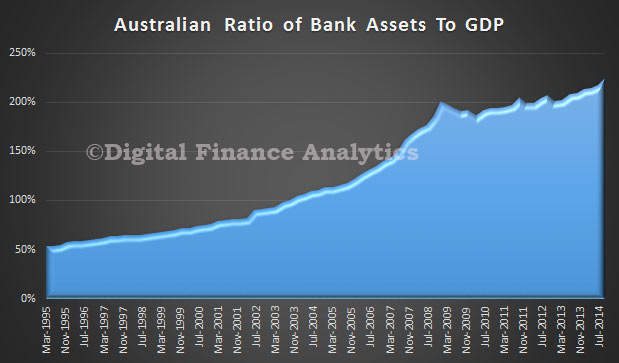 Other countries have significantly higher ratios. The mythology that a bigger banking sector is good for Australia should be questioned. At a time when banks are growing in Australia, thanks to high house prices and lending, inflating their size, we should be looking hard at these findings, because if true, we are on the wrong track.
The purpose of this paper is to examine why financial sector growth harms real growth. We begin by constructing a model in which financial and real growth interact, and then turn to empirical evidence. In our model, we first show how an exogenous increase in financial sector growth can reduce total factor productivity growth. This is a consequence of the fact that financial sector growth benefits disproportionately high collateral/low productivity projects. This mechanism reflects the fact that periods of high financial sector growth often coincide with the strong development in sectors like construction, where returns on projects are relatively easy to pledge as collateral but productivity (growth) is relatively low.
Next, we introduce skilled workers who can be hired either by financiers to improve their ability to lend, increasing financial sector growth, or by entrepreneurs to improve their returns (albeit at the cost of lower pledgeability). We then show that when skilled workers work in one sector it generates a negative externality on the other sector. The externality works as follows: financiers who hire skilled workers can lend more to entrepreneurs than those who do not. With more abundant and cheaper funding, entrepreneurs have an incentive to invest in projects with higher pledgeability but lower productivity, reducing their demand for skilled labour. Conversely, entrepreneurs who hire skilled workers invest in high return/low pledgeability projects. As a result, financiers have no incentive to hire skilled workers because the benefit in terms of increased ability to lend is limited since entrepreneurs’ projects feature low pledgeability. This negative externality can lead to multiple equilibria. In the equilibrium where financiers employ the skilled workers, so that the financial sector grows more rapidly, total factor productivity growth is lower than it would be had agents coordinated on the equilibrium where entrepreneurs attract the skilled labour. Looking at welfare, we are able to show that, relative to the social optimum, financial booms in which skilled labour work for the financial sector, are sub-optimalwhen the bargaining power of financiers is sufficiently large.
Turning to the empirical results, we move beyond the aggregate results and examine industry-level data. Here we focus on manufacturing industries and find that industries that are in competition for resources with finance are particularly damaged by financial booms. Specifically, we find that manufacturing sectors that are either R&D-intensive or dependent on external finance suffer disproportionate reductions in productivity growth when finance booms. That is, we confirm the results in the model: by draining resources from the real economy, financial sector growth becomes a drag on real growth.
Their conclusions are important.
First, the growth of a country’s financial system is a drag on productivity growth. That is, higher growth in the financial sector reduces real growth. In other words, financial booms are not, in general, growth-enhancing, likely because the financial sector competes with the rest of the economy for resources. Second, using sectoral data, we examine the distributional nature of this effect and find that credit booms harm what we normally think of as the engines for growth – those that are more R&D intensive. This evidence, together with recent experience during the financial crisis, leads us to conclude that there is a pressing need to reassess the relationship of finance and real growth in modern economic systems.