Australian Home Price Growth Still At The Top; The Shadow Of A Fall Hangs Long

The latest BIS data series on home prices trends has been published to Q2 2017. Here is a selected range, which shows Australia is near the top in terms of trend growth, relative to other western countries, including UK, USA, Canada and New Zealand.

Norway and Sweden are slightly higher. The fastest rate of growth is in South Africa, which has reached a heady 700!

There is an important lesson in this data. If prices do crash it can take significant time to recover. Look at home prices in Ireland (the yellow solid line), which peaked in 2007, and 10 years later is still well below the peak – a salutatory warning.  USA prices have now just passed their pre-GFC peak and the UK achieved this in 2014!

The fallout from home price falls cast a long shadow.  Importantly, the fall in prices took on average 5 years from their peak to the subsequent trough. A warning that if Australian prices start to slide, they could do so for many years.

For many years, the BIS has promoted analysis of the long-term movements in residential property prices that are particularly important for financial stability research and policy.  A data set of long historical time series of nominal residential property prices in 13 advanced economies was presented for the first time in 1994. Interest in this data set has steadily increased among researchers as well as policymakers and private sector practitioners.

The research data set on long series on residential property prices presented here currently includes quarterly time series for 18 advanced economies going back as far as 1970 or 1971 or even earlier, and quarterly time series for five emerging market economies with starting dates between 1966 and 1991. This work has been undertaken by the BIS in close coordination with national authorities with the aim of providing the most accurate data whenever possible. However, these long series are imperfect. They have been constructed from a variety of sources, including central banks, national statistical offices, research institutes, private companies and academic studies. The methodologies they employ, and the types of geographical areas and dwellings they cover, are likewise varied. Although significant efforts have been made recently to harmonise and improve the comparability of house price indices across countries, the discrepancies in the compilation methods are quite large and may hamper the usability of the data set.

Wallowing In Debt

The long comparative data series from the Bank for International Settlements provides a useful and well documented relative comparisons across countries and over time.  They are careful to compare like with like!

The data on household debt relative to GDP is one of the most significant – “Credit to Households and NPISHs from All sectors at Market value – Percentage of GDP – Adjusted for breaks”.  Here is a set comparing Australian Household Debt with USA, Canada, New Zealand and Hong Kong and Ireland. Australian households are wallowing in debt (no wonder mortgage stress is so high), even relative to Canada (where home prices have now started to fall), Hong Kong (where prices are in absolute terms higher), and New Zealand (where the Reserve Bank there has been much more proactive in tacking the ballooning debt). See also the plunge in debt in Ireland, still trying to deal with the collapse which followed the GFC in 2007.

If we then add in the range of other economies (which I accept makes the chart more complex), we find that only Switzerland has a higher ratio. Even those Scandinavian countries with high ratios and high home prices are below Australia. Interesting then that household wealth, according to the recent survey, was highest in Switzerland, then Australia, thanks to high home values (but of course supported by very high debt).

We appear to have settings which simply are allowing this debt to continue to accumulate – and over the weekend the QLD election campaign included promises of yet more assistance to first time buyers worth $30m, further stoking the debt pyre.

Basel III Implementation Status In Australia

The Basel Committee published its latest status report on Basel III implementation to end-September 2017 – the 13th progress report. This includes a status report on Australia:

There are areas (in red) where the deadline has passed, and as yet plans are not announced. Many other countries have red marks, but it is worth noting the Euro area is ahead of many other regions. Disclose is a major gap in Australia according to the committee.

APRA provided comments on the status.

It also, once again, highlights the complexity in the Basel framework. Here the overall Basel Committee statement summary.

As of end-September 2017, all 27 member jurisdictions have final risk-based capital rules, LCR regulations and capital conservation buffers in force. 26 member jurisdictions have issued final rules for the countercyclical capital buffers and for domestic systemically important banks (D-SIBs) frameworks.

With regard to the global systemically important banks (G-SIBs) framework, all members that are home jurisdictions to G-SIBs have final rules in force. 21 member jurisdictions have issued final or draft rules for margin requirements for non-centrally cleared derivatives and 22 have issued final or draft rules for monitoring tools for intraday liquidity management.

With respect to the standards whose agreed implementation date passed at the start of 2017, 20 member jurisdictions have issued final or draft rules of the revised Pillar 3 framework (as published in January 2015, ie at the end of the first phase of review), 19 have issued final or draft rules of the standardised approach for measuring counterparty credit risk (SA-CCR) and capital requirements for equity investments in funds, and 18 have issued final or draft rules of capital requirements for bank exposures to central counterparties (CCPs).

Members are now striving to implement other Basel III standards. While some members reported challenges in doing so, overall progress is observed since the previous progress report (as of end-March 2017) in the implementation of the interest rate risk in the banking book (IRRBB), the net stable funding ratio (NSFR), and the large exposures framework. Members are also working on or turning to the implementation of TLAC holdings, the revised market risk framework, and the leverage ratio. The Committee will keep on monitoring closely the implementation of these standards so as to keep the momentum in implementing the comprehensive set of the Committee’s post-crisis reforms.

Regarding the consistency of regulatory implementation, the Committee has published its assessment reports on all 27 members regarding their implementation of Basel risk-based capital and LCR standards.

Rising US Rates Will Clip Home Prices Here

Interesting research is contained in a BIS Working Paper “Interest rates and house prices in the United States and around the world“.

They show that home prices are indeed connected to interest rates, and changes in rates do have a flow on effect to prices, and that there are spillover effects, especially relating to interest rates in the USA.

This means that as the FED lifts rates, as is now well signalled, we should expect prices to fall here and in other countries. There may be some delay, the modelling is complex, and the relationships are not straight forward. But it is is worth remembering that in the US real house prices fell by as much as 31% over the course of 2007–09!

This paper estimates the response of house prices in 47 advanced and emerging market economies (EMEs) to changes in short- and long-term interest rates. Our study has four novel aspects. First, we analyse in some detail the impact of short-term interest rates on house prices. Second, we look at the responsiveness of house prices around the world to US interest rates. Third, we use a unique data set on house prices compiled by the BIS in cooperation with national statistical and monetary authorities. And fourth, our empirical framework tries to capture the important role of inertia in house prices.

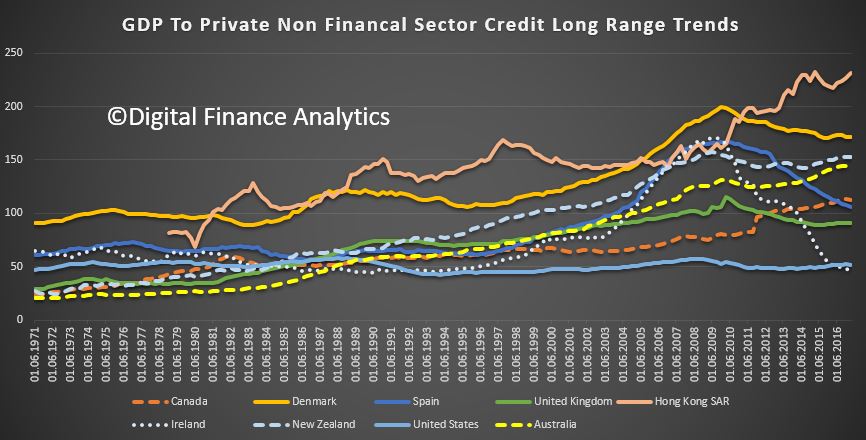
One striking feature of house price growth is its persistence. With the exception of Germany, Portugal and Switzerland, advanced economies have seen real house prices growing by an average of at least 6% per year for 40 years or longer. In the United States, for instance, this resulted in a 13-fold increase in real house prices over a period of 47 years; in Norway, in a 77-fold increase over 66 years. And in South Africa, real house prices increased nearly 150 times over half a century.

Another way to appreciate the persistence of house prices is to contrast the length of their upswings and downswings. We define an upswing (downswing) as a period of house price increases (decreases) sustained in an individual country for three years or more. Based on this definition, periods of upswing accounted for nearly 80% of the advanced economy sample. The upswings lasted on average 13 years; with the longest one, in Australia, still continuing after half a century. By contrast, downswings accounted for only 8% of the advanced economy sample; they lasted on average five years, and the longest one, in Japan, lasted 13 years. In EMEs, upswings accounted for two thirds of the sample. They lasted on average eight years, and the downswings four years.

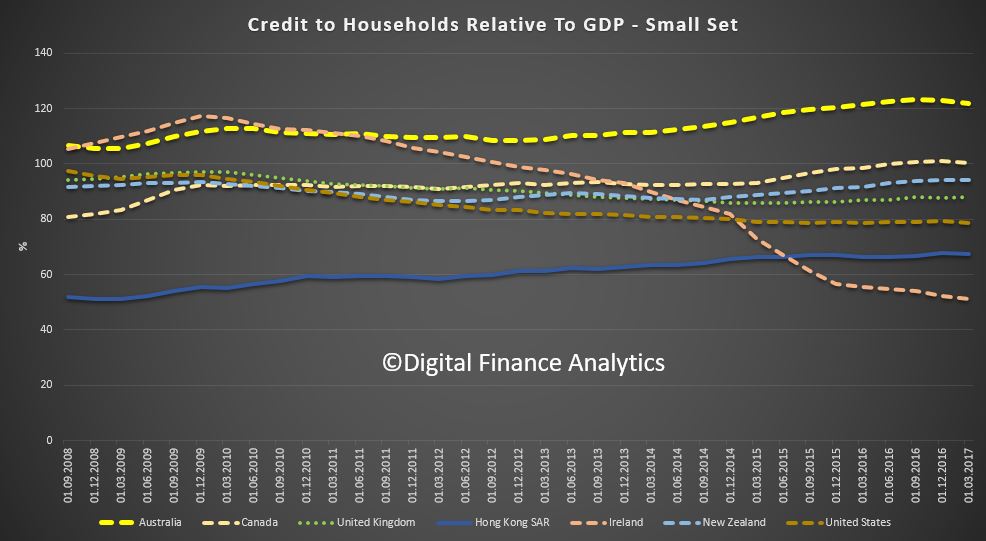
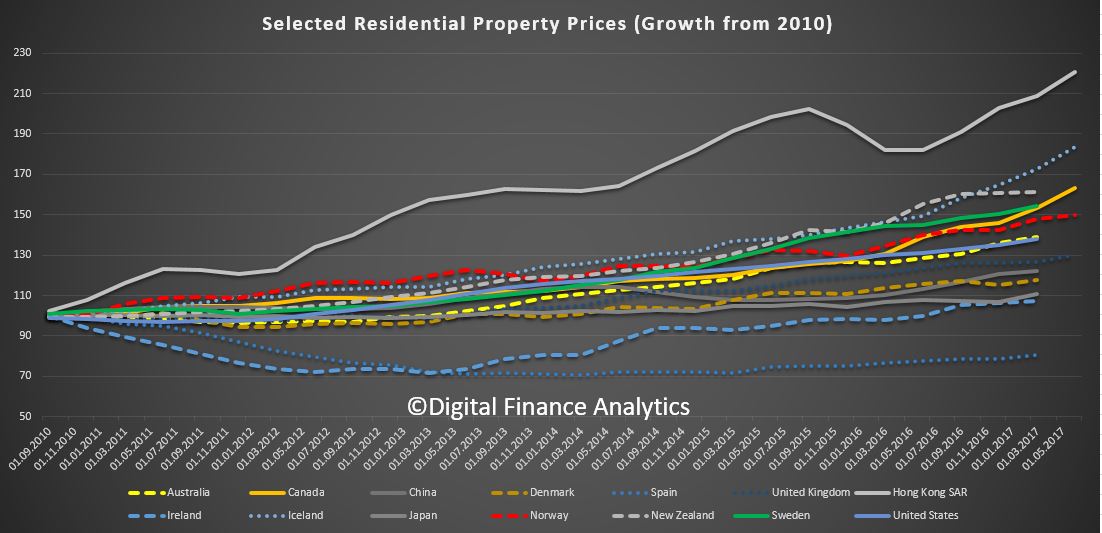
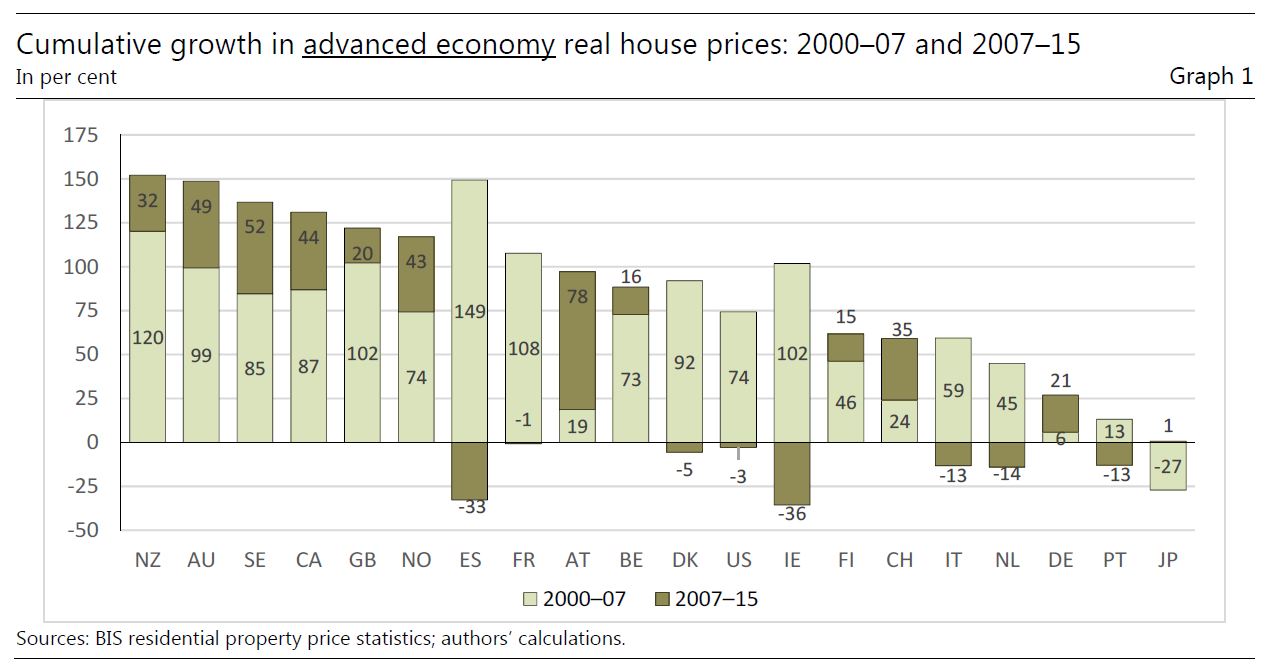
The surge in house prices has been particularly pronounced since the turn of the millennium. Between 2000 and 2015, real house prices increased by 100% or more in half the economies in our sample.  Most countries experienced a housing boom before 2007 (light bar segments). But many have also seen very rapid house price growth since 2007 (dark bar segments). These included Australia, Austria, Canada, the Netherlands, Norway, Sweden and Switzerland among advanced economies; and Brazil, Hong Kong SAR, Israel, Malaysia and Peru among EMEs.

Our focus on short-term interest rates is motivated by their link to monetary policy. As a house is a long-lived asset, the interest rate appropriate for relating the service flow from a house to its price is arguably a long-term rate. However, house prices also depend importantly on ease of access to credit, which is in turn significantly affected by the monetary policy stance. Bernanke and Blinder (1992), for instance, showed that changes in the US federal funds rate were associated with changes in lending by US banks, an effect that has become known as the bank lending channel of monetary policy. Short-term interest rates, which are more closely related to the stance of monetary policy, might therefore be just as important a “fundamental” for house prices as longer-term rates. Indeed, we find a surprisingly important role for short-term interest rates as drivers of house prices, especially outside the United States. Our interpretation is that this reflects an important role for the bank lending channel of monetary policy, especially in countries where securitisation of home mortgages is less prevalent.

The motivation for looking at the responsiveness of house prices around the world to not only domestic but also US interest rates is that the latter have become a key measure of the global cost of financing. We do find spillover effects from US interest rates, both short and long ones, on house prices outside the United States.

Our study draws on the BIS residential property price statistics and, in particular, the “preferred” house price series as identified by national statistical offices or central banks. We compiled over 1,000 annual observations on house prices for the non-US countries in our sample from these series and about a half century of quarterly house prices for the United States. We use these data to estimate the dynamic impact of changes in interest rates and other explanatory variables on real house prices around the world.

Most empirical studies assume that short-term interest rates do not influence house price growth other than through the domestic cost of borrowing, ie by their influence on long-term interest rates. The findings in this paper suggest that this view might be mistaken: changes in short-term interest rates seem to have a strong and persistent impact on house price growth.

Moreover, global, ie US short-term interest rates – not just domestic ones – seem to matter, both in advanced economies and EMEs. We interpret the relative importance of short-term interest rates in driving house prices as indicating an important role for the bank lending channel of monetary policy in determining housing financing conditions, especially outside the United States, where securitisation of home mortgages is less prevalent.

The larger effect of interest rates on house prices we find reflects in part the use in our regressions of a long distributed lag of interest rate changes. For the United States, our estimates for the period from 1970 to the end of 1999 suggest that a 100 basis-point fall in the nominal short-term rate, accompanied by an equivalent fall in the real short-term rate, generated a 5 percentage point rise in real house prices, relative to baseline, after three years. We find an even larger effect if we include the data through end-2015. For other advanced economies and EMEs, we estimate that a 100 basis-point fall in domestic short-term interest rates, combined with an equivalent fall in the US real rate, generates an increase in house prices of up to 3½ percentage points, relative to baseline, after three years. Another reason we find larger interest rate effects is by allowing for inertia in house price movements. We find strong evidence against the random walk hypothesis: real house prices around the world tend to move in the same direction for about a year after being hit by a disturbance, then exhibit a modest reversal.

We think that this inertia in house prices reflects the large search and transaction costs associated with trading residential real estate and shifting between owner-occupied and rental housing. These costs are ignored in the user cost model, which predicts a fairly high interest rate sensitivity for house prices.

Our findings also suggest a potentially important role for monetary policy in countering financial instability. While higher short-term interest rates alone cannot significantly dampen the demand for housing, slower house price growth can give supervisors more time to implement measures to strengthen the financial system. At the same time, the finding that house prices adjust to interest rate changes gradually over time suggests that modest cuts in policy rates are not likely to rapidly fuel house
price bubbles.


Note: BIS Working Papers are written by members of the Monetary and Economic Department of the Bank for International Settlements, and from time to time by other economists, and are published by the Bank. The papers are on subjects of topical interest and are technical in character. The views expressed in them are those of their authors and not necessarily the views of the BIS.
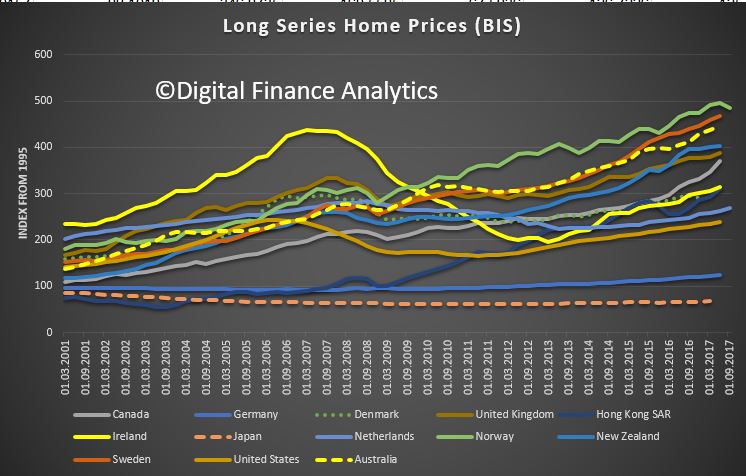
An Interesting Perspective On Financial Inclusion

Interesting speech from Frank Elderson, Executive Director of the Netherlands Bank, highlighting some of the risks attached to the digital revolution and the impact on potentially excluded households. For example, losing access to bank branches, or ATMs, the impact of big data and the complexity of banking products. This perspective is important.

We still face challenges here in the Netherlands. Although these challenges are of a very different order to those in many other parts of the world. That’s because in the Netherlands, a lot is already very well arranged. For example, we have a stable system of payments, and everyone has access to financial products and services, such as bank accounts, insurance and pensions. Over 99% of Dutch citizens have a bank account.

Plus, in the Netherlands, we also devote a lot of attention to financial education, another important aspect of financial inclusion. You also play a big role in this respect. These initiatives include the Money Week project for primary school pupils, the Money Wise platform, as well as the activities of Child and Youth Finance International.

Yet there’s another aspect of financial inclusion I’d like to see us pay more attention to in this country: resilience. We strive for financially resilient consumers in society. Consumers should, in order to be resilient, make prudent and sound decisions. That’s one aspect on which we still have much work to do in the Netherlands. It is apparent in several areas. Let me give you a few examples:

National issue #1: vulnerable groups

For one, the impact of innovation, and the widespread digitization of financial products and services. This development means that many more people are now able to gain access to, for instance, insurance and banking services for the very first time. It’s fantastic to see what innovation can deliver in this respect.

However, in the Netherlands we have seen how innovation has also led to certain sections of society becoming more financially vulnerable. This is due to banks closing more of their branches and reducing the number of ATMs. At the same time, the new products and services that FinTech companies offer are sometimes still inaccessible for certain groups. These include the elderly, the handicapped, and people with low digital literacy.
These days, innovative firms focus on specific or younger target groups.

The early adopters. This is a logical business strategy. However, during this transition we must also consider the needs of more vulnerable groups. After all, access to these products and services should be available to everyone. While we are dismantling old systems and introducing new ones, the vulnerable among us may not always be able to keep up.

They run a risk of becoming disenfranchised – a risk of being left out in the cold.

National issue #2: exclusion

The second development I’d like to call your attention to under the aegis of ‘financial resilience’ is the use of data analysis to make services more personalised. Again, we can see how this has had a very positive impact internationally. For example, if a financial service provider, based on data analysis, can see a customer is reliable, then such service provider is more likely to grant that person a loan to set up a small business.

But there is also another darker to this coin, also in The Netherlands. In addition to the potential violation of privacy, data analysis can also lead to the exclusion of some customers. They may, for example, be excluded from certain financial services, if, by shrewdly combining various databases, it becomes clear that they have a high risk profile, or low profit expectations.

National issue #3: understanding

The third and final aspect of financial resilience I’d like to discuss concerns people’s understanding of financial products. Getting a mortgage or choosing a pension is not an easy process. The information provided is often highly complex. If someone takes out a mortgage they can’t afford, or chooses the wrong pension, it can lead to serious financial problems.

The combination of honest communication and understandable products is an important concern in this respect.

‘Consider the vulnerable people’

I’m sure you’re familiar with these examples. But I’ve mentioned them for a very good reason. When you’re designing a product or a service, I urge you, as representatives of the financial sector, to please always stop and ask yourself the question: “have I considered the more vulnerable people
among us?”

Long Term Debt Trends – Where Australia Sits

The BIS data-sets on financial trends across countries is a fertile place to go for interesting charts. They recently released several updated series. The one I found most interesting was the ratio of private sector debt from banks, compared with GDP, or formally “Credit to Private non-financial sector from Banks, total at Market value – Percentage of GDP – Adjusted for breaks”. All series on credit to the non-financial sector cover 44 economies, both advanced and emerging. They capture the outstanding amount of credit at the end of the reference quarter. Credit is provided by domestic banks, all other sectors of the economy and non-residents.

Here is a plot from 1971 to present day. I selected some of the more telling data from the 44 available (omitting those in the central range for example).

We see that the strongest rise in the ratio has been in Hong Kong, followed by Denmark, then New Zealand and Australia. Also, look at the impact a recession had on the ratios for Ireland and Spain.

Households and Businesses here hold more debt relative to GDP, and we have moved from the bottom of the range in 1971, accelerating more strongly than many to our current heavily debt ridden state. This degree of leverage highlight the risks in the system, and of course will get worse if growth rates stay low while lending for housing continues at ~6% growth each year. And we know that much of the debt sits with households.

The USA, by comparison is pretty steady over the range, and well below Canada and Denmark.


Inflation Has Become “The Lodestar” For Central Banks

The September 2017 Bank for International Settlements Quarterly Review says that the combination of a stronger outlook plus low inflation spurs risk-taking. But the quest for the “missing inflation” has become the focus.

Low inflation despite a stronger economic outlook helped push markets up in recent months and reduced the expected pace of tightening of monetary policy in major economies. Signs of increased risk-taking have become apparent in a number of areas, including narrow credit spreads, increased carry trade activity and looser bond covenants.

“All this puts a premium on understanding the ‘missing inflation’, because inflation is the lodestar for central banks,” said Claudio Borio, Head of the Monetary and Economic Department.

The September 2017 issue of the Quarterly Review:

  • Shows a pickup in the growth of international debt securities in the first half of 2017, when total stocks rose to $22.7 trillion. The outstanding stock of securities issued by banks grew at its fastest pace in six years.

  • Calculates that credit-to-GDP ratios remained well above trend levels for a number of jurisdictions, often coinciding with wide property price gaps. Demand from projects financed by property developers may play a role.
  • Reviews the doubling in outstanding government debt of emerging market economies since 2007, to $11.7 trillion at end-2016. Government debt rose from 41% to 51% of GDP over the same period. Emerging market government borrowing is mostly at longer maturities, at fixed rates and in local currencies, and its pattern increasingly resembles that of advanced economies.

  • Reports on new data initiatives aimed at assessing the exposure of economies to foreign currency risk. From now on, the BIS will regularly publish a currency breakdown of cross-border loans and deposits. Bank loans can be added to debt securities to estimate the build-up of total foreign currency debt. Country-level estimates of total US dollar, euro and yen credit provide a better gauge of foreign currency indebtedness of borrowers in a given country and its vulnerability to currency fluctuations. The BIS is also releasing new data series on monetary policy rates and exchange rates.

Special features look at topical issues in global markets and economics:

  • Claudio Borio, Robert McCauley and Patrick McGuire (BIS)* analyse the amount of debt incurred by borrowing through FX swaps and forwards, a missing element in assessments of financial stability risk. The authors estimate the size, distribution and use of this missing debt, and assess its implications for financial stability. The off-balance sheet dollars owed by non-banks outside the United States may exceed their $10.7 trillion of on-balance sheet dollar debt (as of Q1 2017). The missing debt is secured with foreign currency, is mostly short-term and is likely to generally serve as a hedge for FX exposures in cash flows and on balance sheets. But rolling over short-term hedges of long-term assets can still spark or amplify funding and liquidity problems during periods of stress.
    This research is the first to put a number on the amount of dollar debt missing from balance sheets and fills in a gap in our understanding of liquidity risk posed by financial firms operating across different currencies,” said Hyun Song Shin, Economic Adviser and Head of Research.
  • Morten Bech (BIS) and Rodney Garratt (UCSB) outline how central banks might create and use blockchain-based digital currencies. They identify two types of such potential central bank cryptocurrencies, one for consumers and the other for large-value payments, and compare them with existing payment options.
  • Codruta Boar, Leonardo Gambacorta, Giovanni Lombardo and Luiz Pereira da Silva (BIS) find that countries which frequently use macroprudential tools have tended to have higher and more stable economic growth rates. On the other hand, ad hoc interventions could hurt growth.
  • Torsten Ehlers and Frank Packer (BIS) argue that more consistent standards for green bonds could help develop the market for instruments to finance investments with environmental or climate-related benefits. Although there is some evidence that investors have paid a premium on average at issuance for certified green bonds, the bonds have not generally underperformed conventional ones in the secondary market.

Fintechs And Banking – Opportunities and Risks

The Bank For International Settlements (BIS) has released a released a consultative document on the implications of fintech for the financial sector. Sound practices: Implications of fintech developments for banks and bank supervisors assesses how technology-driven innovation in financial services, or “fintech”, may affect the banking industry and the activities of supervisors in the near to medium term.

The Basel Committee on Banking Supervision (BCBS) set up a task force to examine Fintech. Their report makes a number of observations about the way Fintechs may disrupt financial services. They also highlight the potential risks which regulators and players will need to consider.

The BCBS notes that, “despite the hype, the large size of investments and the significant number of financial products and services derived from fintech innovations, volumes are currently still low relative to the size of the global financial services sector. That being said, the trend of rising investment and the potential long-term impact of fintech warrant continued focus by both banks and bank supervisors”.

They developed a meta-model showing the range of elements across the financial services value chain where Fintech may play.

They say that “while some market observers estimate that between 10–40% of revenues and 20–60% of retail banking profits are at risk over the next 10 years,  others claim that banks will be able to absorb the new competitors, thereby improving their own efficiency and capabilities”.

Various future potential scenarios are considered, with their specific risks and opportunities. In addition to the banking industry scenarios, three case studies focus on technology developments (big data, distributed ledger technology, and cloud computing) and three on fintech business models (innovative payment services, lending platforms and neo-banks).

Although fintech is only the latest wave of innovation to affect the banking industry, the rapid adoption of enabling technologies and emergence of new business models pose an increasing challenge to incumbent banks in almost all the scenarios considered.

Banking standards and supervisory expectations should be adaptive to new innovations, while maintaining appropriate prudential standards. Against this background, the Committee has identified 10 key observations and related recommendations on the following supervisory issues for consideration by banks and bank supervisors:

  1. the overarching need to ensure safety and soundness and high compliance standards without inhibiting beneficial innovation in the banking sector;
  2. the key risks for banks related to fintech developments, including strategic/profitability risks, operational, cyber and compliance risks;
  3. the implications for banks of the use of innovative enabling technologies;
  4. the implications for banks of the growing use of third parties, via outsourcing and/or partnerships;
  5. cross-sectoral cooperation between supervisors and other relevant authorities;
  6. international cooperation between banking supervisors;
  7. adaptation of the supervisory skillset;
  8. potential opportunities for supervisors to use innovative technologies (“suptech”);
  9. relevance of existing regulatory frameworks for new innovative business models; and
  10. key features of regulatory initiatives set up to facilitate fintech innovation.

Australia’s Home Price Growth Nothing Special

The latest data from the BIS, which tracks residential property price growth has been released. It shows that home price inflation is widespread across many countries, and in that context, Australia (average 8 capital cities) is nothing special, we are in the middle of the pack.

Base-lined in 2010, this data series is the most comprehensive available, though with all the issues of matching data from multiple sources and translating it to a common basis. In most cases, this series covers all types of dwellings in markets for both new and existing dwellings in the country as a whole.

Hong Kong has the strongest growth, and New Zealand and Canada are both well ahead of Australia.  We track quite closely with the USA. Spain sits at the bottom of the selected series.

We can also look at the change YOY, which shows that Australian residential prices are accelerating, whilst the macroprudential measures deployed in New Zealand is slowing growth there. Iceland, Canada and Hong Kong are all accelerating.

Two observations. First home price growth is not just a local issue – as we discussed recently there are a range of complex factors driving asset prices higher.

Second, whilst we are in middle of the pack in terms of home price growth, our total debt burden is much higher, we are near the top of the pack on this measure. Once again driven by a complex range of interrelated factors.

The interplay of accounting and regulation and its impact on bank behaviour

According to a new working paper – from BIS, accounting and regulatory standards are pulling in different directions, and as a result bank risks may be misinterpreted.

Accounting rules and disclosure standards are important determinants for banks’ incentives and behaviour, and the recent financial crisis, where criticism was voiced (eg regarding the role of fair value accounting of financial assets and incurred loss provisioning of loans), is just another example of the importance and relevance of banks’ financial reporting in a regulatory and supervisory context.

In March 2013, the Basel Committee’s Research Task Force initiated a work stream that deals with aspects of the interplay of accounting and regulation and its impact on bank behaviour from a research perspective. Specifically, the work stream was tasked to “identify ways in which the interaction between accounting and regulatory rules provides incentives that affect the risk taking of financial institutions”, and it commenced research on specific aspects of loan loss provisioning, disclosure rules, fair value accounting, and prudential filters.

In summary, the results described in this report as well as the conclusions from other studies reported in Basel Committee working paper 28 suggest that both in the context of loan loss provisioning and the valuation of banks’ assets, there is a tension between backward-looking and forward-looking measurement. This observation is also consistent with the mixed picture that is given by the analytical results regarding several research questions. One conclusion is that corner solutions in one or the other direction do not seem optimal, and that an adequate mix of the two concepts may be superior. The other conclusion is that further evidence on the research questions posed is clearly needed. For example, all projects of the work stream focus on quantities, but not on prices of financial instruments (eg loan rates or yields of securities). Therefore, researchers are encouraged to further address the interplay of accounting and regulation and its impact on bank behaviour from an academic perspective.

Note: The Working Papers of the Basel Committee on Banking Supervision contain analysis carried out by experts of the Basel Committee or its working groups. They may also reflect work carried out by one or more member institutions or by its Secretariat. The subjects of the Working Papers are of topical interest to supervisors and are technical in character. The views expressed in the Working Papers are those of their authors and do not represent the official views of the Basel Committee, its member institutions or the BIS.