High Household Debt Kills Real Growth

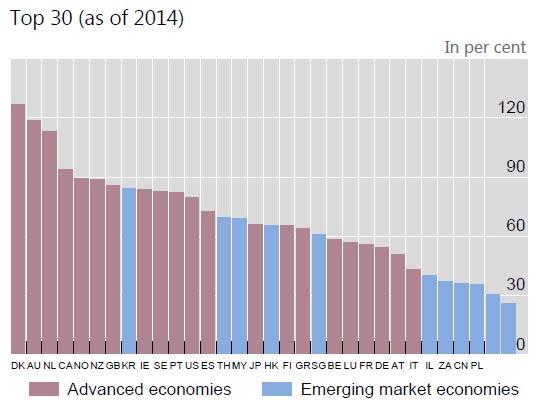
A new working paper from the BIS “The real effects of household debt in the short and long run” shows that high household debt (as measured by debt to GDP) has a significant negative long term effect on consumption, and so growth.

A 1 percentage point increase in the household debt-to-GDP ratio tends to lower growth in the long run by 0.1 percentage point. Our results suggest that the negative long-run effects on consumption tend to intensify as the household debt-to-GDP ratio exceeds 60%. For GDP growth, that intensification seems to occur when the ratio exceeds 80%.

Moreover, the negative correlation between household debt and consumption actually strengthens over time, following a surge in household borrowing. What is striking is that the negative correlation coefficient nearly doubles between the first and the fifth year following the increase in household debt.

Bad news for Australian households where the ratio is well above 80%, at 130%.

This is explained by massive amounts of borrowing for housing (both owner occupied and investment) whilst unsecured personal debt is not growing. Such high household debt, even with low interest rates sucks spending from the economy, and is a brake on growth. The swelling value of home prices, and paper wealth (as well as growing bank balance sheets) do not really provide the right foundation for long term real sustainable growth.

Note: BIS Working Papers are written by members of the Monetary and Economic Department of the Bank for International Settlements, and from time to time by other economists, and are published by the Bank. The papers are on subjects of topical interest and are technical in character. The views expressed in them are those of their authors and not necessarily the views of the BIS.

The Globalisation of Inflation

The BIS has published an important working paper looking at the consequences of managing inflation given the rise of global value chains. As a result it questions the traditional approach used by central banks to attempt to manage inflation targets.  The monetary policy implications of a greater role for global factors in determining domestic inflation are farreaching, as clearly these factors are beyond the control of individual central banks. Such implications cannot be ignored.

At the heart of the globalisation of inflation (GI) hypothesis is the view that the factors influencing domestic inflation have become increasingly global. One implication of this hypothesis is that global, and not just domestic, measures of economic slack should be relevant determinants of domestic inflation and that their role should have increased with global economic integration. This more “globe-centric” view of the inflation process stands in contrast to traditional, “country-centric”, characterisations, in which a Phillips curve relates a purely domestic output gap to domestic inflation.

Because of its far-reaching implications for our understanding of inflation and the conduct of monetary policy, the GI hypothesis has attracted considerable attention.

While it is generally agreed that domestic inflation rates have been co-moving more closely, the correct interpretation of this finding hinges on the validity of the GI hypothesis. Proponents argue that tighter comovements reflect, in particular, the growing structural integration of goods and labour markets. This would, for instance, propagate national cost shocks more widely and strongly. By contrast, sceptics place greater weight on common policies. The empirical evidence so far has not yielded conclusive results.

The industrial organisation underpinning the expansion of GVCs has evolved. Initially, GVCs arose from firms’ foreign direct investment and within-firm trade across geographic borders. Growth in net international asset positions went hand-in-hand with the increase in international input-output linkages. Over time, however, outsourcing and offshoring have taken on greater prominence. Advances in technology have enabled international supply chains to expand. It is now possible to coordinate and track just-in-time production through international supply chains from start to finish, ie through all the different production stages, and by different firms located in geographically distant world regions. As a result, today’s GVCs include international manufacturing giants, such as Apple, that do not own most of the manufacturing plants in their supply chains.

These developments represent a challenge to the classical assumptions behind the traditional country-centric view of trade and inflation determination.

To assess this hypothesis, we evaluate the extent to which various proxies for GVCs explain the relative importance of global and domestic measures of slack in influencing domestic inflation. We do so in a panel setting, thereby exploring the relevance of GVCs both across countries and over time. To track the growth of GVCs, we consider total trade and its major components, focusing in particular on intermediate goods and services. To measure the influence of global and domestic slack on inflation, we rely on the published estimates of Bianchi and Civelli (2015) – estimates that are in the spirit of the analysis of Borio and Filardo (2007). That recent paper provides estimates that capture greater time variation (annual estimates for each country) and cover a wider range of countries than the earlier paper. We exclude the GFC period and its aftermath owing to the powerful balance sheet dynamics that appear to dominate the typical cyclical forces.

We find that GVCs are a key to explaining the influence of global factors on domestic inflation. There is statistically significant evidence that the growth of international input-output linkages explains the increasing sensitivity of domestic inflation to global factors. This is the case both across countries and over time. The growth of GVCs is associated with both a reduction of the impact of domestic slack on domestic inflation and an increase in that of its global counterpart. Moreover, once the role of GVCs is taken into account, we find that the conventional measure of trade openness so extensively used in the literature, based on the aggregate volume of trade in goods and services, has only limited explanatory power for the link between globalisation and domestic inflation.

Our evidence supports the view that the rise of GVCs has been a key factor behind the growing importance of the global output gap in determining domestic inflation.

We also find that controlling for the impact of GVCs, conventional measures of trade openness only have limited explanatory power. It is natural to think that a reason for this close link is the increased crossborder competition generated by the expansion of GVCs. The more easily measurable channel of this competition is through price pressures from inputs that are actually imported at all stages of the production process. The much harder-tomeasure, but possibly even more important, channel works through the inputs that could potentially be imported at the various production stages (ie through the contestability of markets for goods and services). Unfortunately, our analysis cannot distinguish between the two.20 But more detailed GVC measures based on increasingly available intermediate trade data could eventually shed further light on these channels and help refine the analysis.

Our findings point to the need for further theoretical and empirical research on the globalisation of inflation hypothesis, especially on the role of GVCs. On the theoretical side, this raises questions about approaches that model inflation as largely a country-centric phenomenon and derive the corresponding policy implications. On the empirical side, questions remain about whether it would be possible to develop more informative measures of global slack that would reflect differences in the sectoral value-added content of trade rather than simply in its economy-wide content. For example, Auer et al (2016) provide a quantification of one specific channel of interest, finding that most of the international co-movement in producer price inflation can be attributed to input-output linkages. There is also a need to extend the analysis carried out in this paper to a consideration of
alternative measures of domestic and global slack. The monetary policy implications of a greater role for global factors in determining domestic inflation would be farreaching, as clearly these factors are beyond the control of individual central banks. Such implications cannot be ignored.

Note: BIS Working Papers are written by members of the Monetary and Economic Department of the Bank for International Settlements, and from time to time by other economists, and are published by the Bank. The papers are on subjects of topical interest and are technical in character. The views expressed in them are those of their authors and not necessarily the views of the BIS.

The costs of the financial crisis are significant (and still with us)

Given all the talk about deregulation of US banking, it is worth reflecting on this chart, from a recent presentation by William Coen, Secretary General of the Basel Committee, to students at Harvard Law School, on “The global financial crisis and the future of international standard setting: lessons from the Basel Committee“, Cambridge, United States, 12 December 2016.

Bank failures, government bail-outs and subsequent monetary policy settings have combined to lower overall real GDP.

Actions which weaken supervision, and increase risks of a further collapse need to be seen in this light.

The Credit-to-GDP Gap – Early Warning Of Trouble Ahead?

The BIS has released their updated series on the Credit-to-GDP Gaps.  In essence, the bigger the gap the greater the concern. Specifically, the bigger the gap, the more likely it is regulators should be lifting counter-cyclical buffers when it comes to capital management and control.

The largest gaps are from Hong Kong, China. Singapore. Australia is up the list, behind Canada, but ahead of USA, UK and New Zealand.

Here are the raw GDP to Credit ratios. Australia sits behind China and Canada, but well ahead of USA, UK and New Zealand. We are at the higher risk end of the spectrum.

The Credit to GDP Gap trends over time also tell a story. Our gap is higher now, compared with the past few years. Again a signal of rising risks?

The BIS says:

The build-up of excessive credit features prominently in discussions about financial crises. While it is difficult to quantify “excessive credit” precisely, the credit-to-GDP gap captures this notion in a simple way. Importantly from a policy perspective, large gaps have been found to be a reliable early warning indicator (EWI) of banking crises or severe distress.

The published series cover 43 countries starting at the earliest in 1961.

The credit-to-GDP gap (gapt) is defined as the difference between the credit-to-GDP ratio (ct/yt) and its long-run trend tt.

Importantly, while the use of these total credit series as input data facilitates comparability across countries, it means that the credit-to-GDP gaps published by the BIS may differ from credit-to-GDP gaps considered by national authorities as part of their countercyclical capital buffer decisions. Given the EWI qualities of the gap, the indicator was adopted as a common reference point under Basel III to guide the build-up of countercyclical capital buffers (BCBS (2010)). Authorities are expected, however, to apply judgment in the setting of the buffer in their jurisdiction after using the best information available to gauge the build-up of system-wide risk rather than relying mechanistically on the credit-to-GDP guide. For instance, national authorities may form their policy decisions using credit-to-GDP ratios that are based on different data series from the BIS’s as input data, leading to credit-to-GDP gaps that differ from those published by the BIS.


Household Debt Service Ratio Latest Data

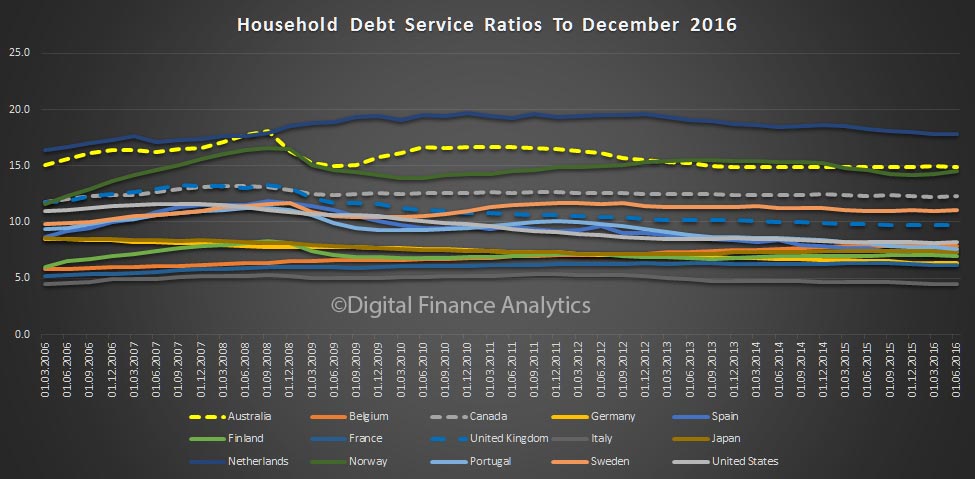
The BIS has just released their December 2016 update of comparative Debt Service Ratios for Households. Australia sits below Netherlands and Norway, but well above most other countries, including USA, UK and Canada. We are awash with household debt, but remember our current interest rates are ultra low. The ratio will deteriorate as rates rise, which is what we expect to happen.

By way of background, the debt service ratio (DSR) is defined as the ratio of interest payments plus amortisations to income. As such, the DSR provides a flow-to-flow comparison – the flow of debt service payments divided by the flow of income.

It takes the stock of debt, and the average interest rate on the existing stock of debt. To accurately measure aggregate debt servicing costs, the interest rate has to reflect average interest rate conditions on the stock of debt, which contains a mix of new and old loans with different fixed and floating nominal interest rates attached to them. The average interest rate on the stock of debt is proxied by the average lending rates on loans from  financial institutions.

So whilst there will be some cross-border statistical variations, we can be confident the results are relatively accurate.

Delving Deeply into Currency and Derivatives Markets

The December 2016 BIS Quarterly Review: Delving deeply into currency and derivatives markets – has been released.

Trading on global currency and over-the-counter (OTC) derivatives markets continues to grow, but why are some segments thriving while others fall back?

The December 2016 issue of the BIS Quarterly Review examines the data collected earlier this year from close to 1,300 banks and other dealers in 52 jurisdictions as part of the Triennial Central Bank Survey of foreign exchange and OTC derivatives markets, the most comprehensive snapshot of the size and structure of these markets.

Three underlying themes emerge, said Hyun Song Shin, Economic Adviser and Head of Research: changes in the role and composition of market participants, the evolving role of emerging market economy (EME) currencies and monetary policy as a driver of market developments. These developments can in turn have an impact on the real economy. “What happens in financial markets does not always stay in financial markets,” Mr Shin said.

The December BIS Quarterly Review also:

  • Finds that the increase in global bond yields over the last few months has not caused major disruption in financial markets. Equity markets rallied and yields rose further as markets priced in a greater likelihood of fiscal expansion after the US presidential election. However, EME assets came under pressure.

    “Developments during this quarter stand out for one reason: for once, central banks took a back seat,” said Claudio Borio, Head of the Monetary and Economic Department. “It is as if market participants, for once, had taken the lead in anticipating and charting the future, breaking free from their dependence on central banks’ every word and deed.”

  • Presents new data from China and Russia, which have started to contribute to the BIS locational banking statistics. The new data show that banks in China are the 10th largest lenders in the international banking market and banks in Russia the 23rd largest.
  • Finds that differences in the regulations applying to different classes of derivatives partly explain why central clearing has become more entrenched in OTC interest rate derivatives markets than in other OTC markets.
  • Documents the increased use of the Chinese renminbi in financial trading. The shares of FX derivatives trading compared with spot trading, and of financial counterparties compared with non-financial counterparties, are approaching those of well established liquid currencies. The market for renminbi-denominated interest rate derivatives, however, remains small.

Five special features analyse currency and financial market developments:

  • Michael Moore (Warwick Business School), Andreas Schrimpf (BIS) and Vladyslav Sushko (BIS)* find that the downsizing of FX markets reflects a fall in the activity of “fast money” traders and hedge funds, and a drop in FX prime brokerage. In contrast, more long-term investors are hedging currency risk, supporting trading in FX derivatives. FX dealer banks are less willing to take on risk, and competition from non-bank market-makers has risen.
  • Torsten Ehlers and Egemen Eren (BIS)* argue that changing monetary policy stances helped drive a near doubling in the turnover of US dollar OTC interest rate derivatives, while euro-denominated contracts nearly halved. Exchange-traded markets continue to handle the majority of interest rate derivatives turnover, but are growing more slowly than OTC markets. Regulatory reforms have encouraged a move to central clearing and electronic trading and made OTC markets more similar to exchanges.
  • Christian Upper and Marcos Valli (BIS)* explore why derivatives markets for EME currencies and interest rates are smaller than their advanced economy counterparts. They argue that lower levels of financial development, less integration in the global economy and lower per capita income may be holding back growth in these markets.
  • Robert McCauley and Chang Shu (BIS)* explain that the rise of non-deliverable forwards (NDFs), contracts which allow hedging and speculation in a currency without providing or requiring settlement in it, masks significant differences across currencies, reflecting different paths of FX market development. While the internationalisation of China’s renminbi has favoured deliverable forwards over NDFs, such contracts have become more popular in the Brazilian real and Korean won.
  • Jonathan Kearns and Nikhil Patel (BIS)* use trade-weighted exchange rates and BIS-constructed debt-weighted exchange rates to assess competing forces influencing the impact that currency moves have on an economy. They find that exchange rate devaluation could damage rather than stimulate activity in emerging market economies where borrowers have a high share of foreign currency debt, probably because of the impact on their balance sheets.

* Signed articles reflect the views of the authors and not necessarily those of the BIS.

Monetary policy has been stretched to its limits

The BIS released original quotes from interview with Claudio Borio, Head of the Monetary and Economic Department, in Süddeutsche Zeitung, conducted by Markus Zydra and published on 30 November 2016.

Mr Borio, the world is facing many problems. What is the root cause? 

We do not know for sure. The big questions in economics have not quite been solved. But let me start by saying that the rhetoric about the global economy is worse than the reality. In terms of global growth, we are not that far away from historical averages, especially if we adjust for demographics. Moreover, unemployment has been declining, and in several cases is close to historical norms or measures of full employment. 

So everything is fine? 

It is the medium term that is our concern – what we have called the “risky trilogy”. The long-term decline in productivity growth has accelerated since the crisis, so that the prospects for long-term growth are not bright. Debt levels, both private and public, are historically high and have been increasing since the crisis. And, most critically, the room for policy manoeuvre, both monetary and fiscal, is limited. 

But can central banks help out? 

Monetary policy has been stretched to its limits. In inflation-adjusted terms, interest rates have never been negative for so long and they are lower now than in the midst of the financial crisis, which is odd since the situation has improved. If you came from Mars and they told you that policymakers were struggling to reach price stability, you might be surprised, as inflation is not far from measures of stable prices. But since many central banks have inflation targets set at 2%, there is a lot at stake. 

Why do we have low inflation? 

We do not fully understand this. But I think we have underestimated the long-lasting impact of the globalisation of the real economy, notably the entry of China and former communist states into the world trading system. There has been persistent downward pressure on wages and prices, as competition has greatly increased, helped also by technological change. The pricing power of producers and, in particular, the bargaining power of workers have declined, making the wage-price spirals of the past less likely. 

The ECB and other central banks fear deflation. 

Building on previous work, we have analysed deflation across many countries since the 1870s. There is only a very weak link between deflation and slow growth. That finding has not received the attention it deserves. 

What should central banks be doing? 

The idea is to look carefully at what is driving disinflation and use all the flexibility available in the mandate to reach the 2% inflation target. To form a judgment is not easy, but is always necessary. Whether deflation is costly or not depends on its drivers. For instance, to the extent that it is globalisation, it is not costly, as it is supply-driven rather than the reflection of weak demand. 

Where is the danger? 

Around 2003, policymakers were also concerned with deflation, and as a result kept interest rates very low. But this contributed to a credit and property price boom that sowed the seeds of the bust that did so much damage later on. In the crisis years after 2008, it was essential to loosen monetary policy. But since then, monetary policy has been overburdened. On balance, too little has been done to repair balance sheets and to raise sustainable growth through structural reforms, such as by making markets more flexible and promoting entrepreneurship and innovation. 

And more fiscal spending? 

Only where there is room. Public debt in relation to GDP has never been so high in so many countries during peacetime. Fiscal space should not be overestimated. It is all too easy to end up with an even larger pile of debt. 

The global debt is around $90 trillion, and it is rising. How should one reduce it? 

How to manage the debt burden is the hardest question. The best way, of course, is to grow out of it, which is why structural reforms are so important. Other forms are more painful. 

Do you fear political populism? 

I fear a return to trade and financial protectionism. We are seeing some worrying signs. The open global economy order has been remarkably resilient to the financial crisis; but it might not so easily survive another one. At that point, we could see a historic rupture. That is an endgame we should do all we can to avoid. 

There are academics and politicians advocating the abolition of cash. What do you think of that? 

Negative nominal interest rates, especially if persistent, are already problematic. Quite apart from the problems they generate for the financial system, they can be perceived as a desperate measure, paradoxically undermining confidence. Getting rid of cash would take all this one big step further, as it would signal that there is no limit to how far into negative territory nominal interest rates could be pushed. That would risk undermining the very essence of our monetary economy. It would be playing with fire. Also, it would be quite a challenge for communication, even in simply economic terms. It would be like saying: “We want to abolish cash in order to tax you with lower negative rates in order to – tax you even more in the future.” 

Why? 

Because the reason for doing this would be to raise inflation – which is perceived as an unjust tax on savings. This would require people to have faith in the “model” which policymakers use to steer the economy. Quite a challenge!
Long Term Home Price Trends

The BIS has released their latest dataset on long term residential price trends. Australia figures near the top, ahead of NZ, US and UK, but behind Norway and Sweden.

bis-home-prices-nov-16But for those convinced prices can only go up, look at Japan (lower now than in 1999), Ireland, (peak in 2008, but now much lower) and Hong Kong (often cited as the most expensive market, but fallen recently). Property can go down as well as up!

How much longer will prices here defy gravity?

Dollar replaces VIX as gauge of banks’ appetite for leverage

The dollar has ousted the VIX index as a barometer of the banking sector’s appetite for leverage, with bank lending coming under pressure when the dollar appreciates, Bank for International Settlements Economic Adviser and Head of Research Hyun Song Shin said on Tuesday.

bis-vix

Speaking at the London School of Economics, Mr Shin said the link between the VIX, a measure of implied stock market volatility, and bank borrowing, or leverage, which had held before the crisis has broken down since. Bank leverage has been subdued despite low VIX readings. Instead, bank leverage is now tied more closely to the dollar.

“Just as the VIX index was a good summary measure of the price of balance sheets before the crisis, so the dollar has become a good measure of the price of balance sheets after the crisis,” Mr Shin said.

“The dollar has supplanted the VIX index as the variable most associated with the appetite for leverage. When the dollar is strong, risk appetite is weak.”

Mr Shin said the breakdown of rules of thumb for well functioning markets, like the equalisation of interest rates across different market segments, showed that incipient deleveraging pressures have been building in recent months.

This rise in the so-called cross-currency basis, the premium banks charge borrowers of sought-after currencies like the US dollar, reflects the breakdown of covered interest parity (CIP), a previously ironclad rule that kept the interest rates implicit in currency markets closely in line with those in money markets.

A BIS working paper, published on Tuesday, found that a stronger dollar means wider deviations from CIP – signalling the higher cost of borrowing dollars in foreign exchange markets – as well as a pullback in cross-border bank lending in dollars.

The paper, by Mr Shin and BIS colleagues Stefan Avdjiev and Cathérine Koch, together with Wenxin Du from the US Federal Reserve Board, finds that a stronger dollar crimps bank balance sheets and reduces banks’ ability to take on risks.

“To the extent that the CIP deviation turns on the constraints on bank leverage, our results suggest that the strength of the dollar is a key determinant of bank leverage,” the paper states. Eroding bank risk capital put a higher price on bank balance sheets, while better capitalised banks were more able to withstand deleveraging pressures and keep up the flow of credit to the real economy.

Mr Shin said the developments showed the need for a global perspective in tracking the functioning of the financial system and the importance of capital market indicators in assessing strains that affect banks and the wider economy.

“This link between banks and capital markets has gone global. We can begin to understand some of the big puzzles of our day when we lift our gaze to take in this global picture,” he said.

Update On Basel Regulatory Framework

The Basel Committee on Banking Supervision has issued the Eleventh progress report on adoption of the Basel regulatory framework. It includes a status update for each country, including Australia, where progress continues, based on self-reporting made to the committee in March 2016.

Pillar 3 disclosures appear to be the main area of slippage. In January 2015, the Basel Committee issued the final standard for revised Pillar 3 disclosure requirements, which will take effect from end-2016 (ie banks will be required to publish their first Pillar 3 report under the revised framework concurrently with their year-end 2016 financial report). The standard supersedes the existing Pillar 3 disclosure requirements first issued as part of the Basel II framework in 2004 and the Basel 2.5 revisions and enhancements introduced in 2009.

aus-basel-status-sept-2016More broadly, the Committee’s latest report as of end-September 2016 shows that:

all 27 member jurisdictions have final risk-based capital rules, LCR regulations and capital conservation buffers in force;

26 member jurisdictions have issued final rules for the countercyclical capital buffers;

25 have issued final or draft rules for their domestic SIBs framework; and
18 have issued final or draft rules for margin requirements for non-centrally cleared derivatives.

With regard to the global SIBs framework, all members that are home jurisdictions to G-SIBs have the final framework in force. While members are now turning to the implementation of other Basel III standards, including the leverage ratio and the net stable funding ratio (NSFR), some member jurisdictions report challenges in meeting the agreed implementation deadlines for some standards. These include the revised Pillar 3 framework (by end-2016), the standardised approach for measuring counterparty credit risk (by January 2017), capital requirements for central counterparty (CCP) exposures (by January 2017) and capital requirements for equity investments in funds (by January 2017).

This report sets out the adoption status of Basel III standards for each member jurisdiction of the Basel Committee as of end-September 2016. It updates the Committee’s previous progress reports which have been published on a semiannual basis since October 2011 under the Committee’s Regulatory Consistency Assessment Programme (RCAP).

Since it introduced the RCAP in 2011, the Committee has periodically monitored the adoption status of the risk-based capital requirements. From 2013, the Committee expanded its coverage to monitor its members’ adoption of the requirements for systemically important banks (SIBs), the liquidity coverage ratio (LCR) and the leverage ratio. In 2015, the Committee extended its monitoring of the adoption progress to all Basel III standards, which will become effective by 2019.

Methodology

The information contained in the following table is based on responses from Basel Committee member jurisdictions, and reports the status as of end-September 2016.

The following classification is used for the adoption status of Basel regulatory rules:

1. Draft regulation not published: no draft law, regulation or other official document has been made public to detail the planned content of the domestic regulatory rules. This status includes cases where a jurisdiction has communicated high-level information about its implementation plans but not detailed rules.
2. Draft regulation published: a draft law, regulation or other official document is already publicly available, for example for public consultation or legislative deliberations. The content of the document has to be specific enough to be implemented when adopted.
3. Final rule published: the domestic legal or regulatory framework has been finalised and approved but is still not implemented by banks.
4. Final rule in force: the domestic legal and regulatory framework has been published and is implemented by banks.
In order to support and supplement the status reported, summary information about the next steps and the adoption plans being considered are also provided for each jurisdiction.
In addition to the status classification, a colour code is used to indicate the adoption status of each jurisdiction. The colour code is used for those Basel components for which the agreed adoption deadline has passed.

Green = adoption completed; yellow = adoption in process (draft regulation published); red = adoption not started (draft regulation not published). N/A: Not applicable.