
Please consider supporting our work via Patreon
Please share this post to help to spread the word about the state of things….

/
RSS Feed
Digital Finance Analytics (DFA) Blog
"Intelligent Insight"

We discuss the latest building approvals and Cranes Index data. Residential construction is taking a dive.
Please consider supporting our work via Patreon
Please share this post to help to spread the word about the state of things….
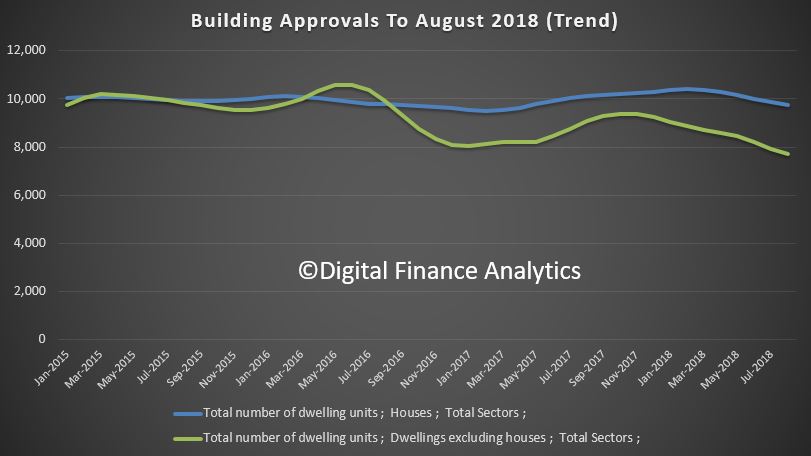
The ABS data released today shows that the number of dwellings approved in Australia fell by 1.9 per cent in August 2018 in trend terms.
In seasonally adjusted terms, total dwellings fell by 9.4 per cent in August, driven by a 17.2 per cent decrease in private dwellings excluding houses. Private houses fell 1.9 per cent in seasonally adjusted terms.
We will continue to base our analysis on the trend data, but this will understate more recent falls…
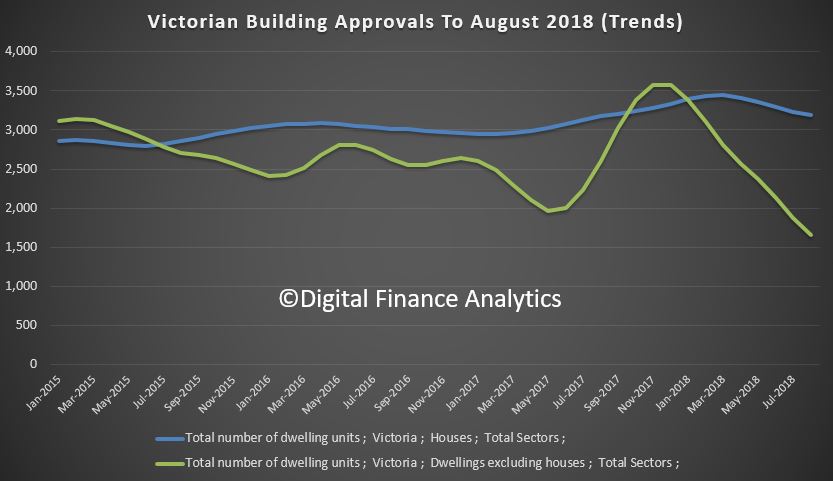
 The cause is simple, a significant fall in the number of new high-rise residential development applications, especially in Victoria. Recent falls in demand and prices suggests a significant reduction in momentum is on the cards there.
Justin Lokhorst, Director of Construction Statistics at the ABS said “The fall was mainly driven by private dwellings excluding houses, which decreased by 2.7 per cent in August, Private sector houses also fell, by 1.2 per cent.”
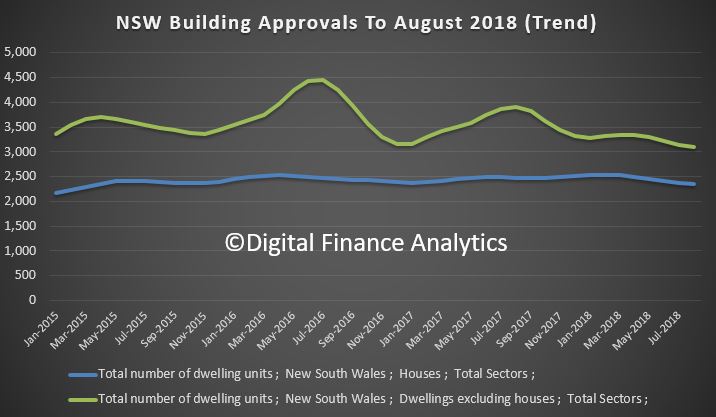
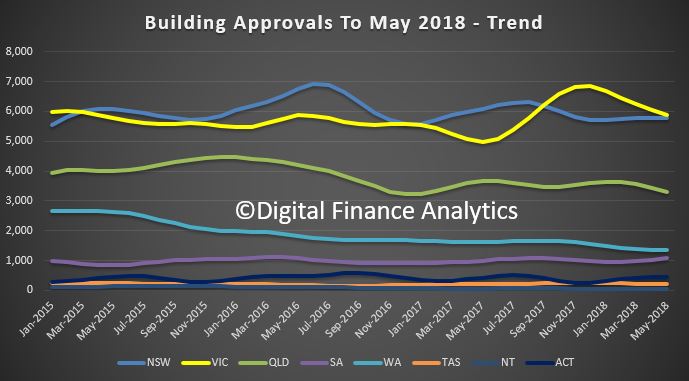
 Among the states and territories, dwelling approvals fell in August in Victoria (5.1 per cent), South Australia (3.6 per cent) and New South Wales (1.6 per cent) in trend terms.
 Dwelling approvals rose in trend terms in Western Australia (2.7 per cent), Tasmania (2.3 per cent), Northern Territory (1.5 per cent) and Australian Capital Territory (0.1 per cent). Dwelling approvals were flat in Queensland. But the significant falls in the two most populated states swamps any better news elsewhere.
In trend terms, approvals for private sector houses fell 1.2 per cent in August. Private sector house approvals fell in Queensland (3.3 per cent), Victoria (1.4 per cent), New South Wales (1.1 per cent) and South Australia (0.7 per cent), but rose in Western Australia (1.4 per cent).
The value of total building approved fell 1.3 per cent in August, in trend terms, and has fallen for nine months. The value of residential building fell 0.8 per cent while non-residential building fell 2.3 per cent.
Now, its worth comparing this approvals data with the latest RLB Crane Index, an interesting measure of construction activity (especially high-rise development).
Their Q3 2018 data – the 13th edition of the RLB Crane Index has seen
Australia reach a new record high of 173. Nationally, the number of cranes rose 7%, to 735, the highest count. Melbourne and Newcastle saw a strong crane increases, overtaking the record levels reached six months earlier. Sydney continues to decline from the peak reached in Q4 2017, falling 6%.
They say that the residential index pick up from its fall in Q2 2018, increasing 8%, to 170. Additionally, the non-residential index continued its rise, increasing 7%, recording a new high of 180. Recent construction statistics released by the Australian Bureau of Statistics highlight the ongoing strength of the construction industry. For FY 2018,total construction in Australia reached $221 billion.
Strong increases were seen in the non-residential and engineering construction sectors of 11.1% and 20.7% respectively, while the residential building sector remained constant at $74 billion.
They say that Melbourne’s crane numbers rose, increasing by 35 cranes. Driving this rise is the civil sector with the introduction of 13 new cranes. All
other sectors remained strong, either maintaining or increasing cranes from the count six months ago.
Since its peak in Q3 2017, Sydney’s crane count has been falling, driven by a declining residential sector. The residential crane count has fallen by 55 cranes from its peak in Q4 2017, while the non-residential sector recorded an increase of 26 cranes.
Brisbane has bounced back from its dip in the last edition, driven by a rise in mixed-use projects. While the residential sector remained stable, 11 new cranes were added to the mixed use sector.
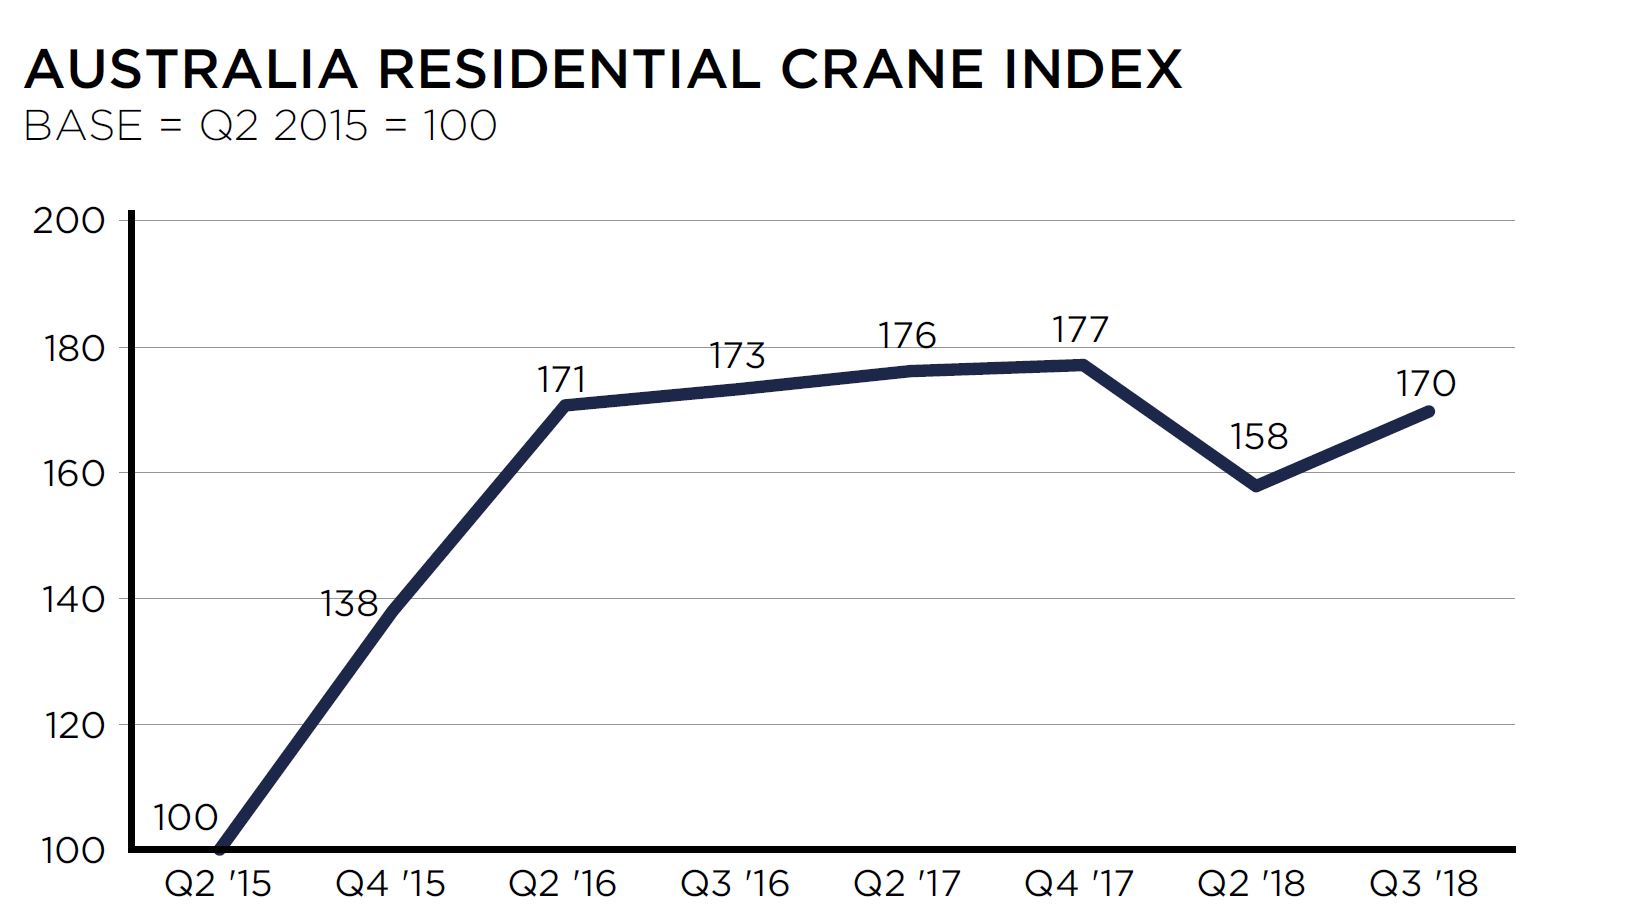 The Residential Crane Index at 170 is just below the peak in late 2017 of 177. Note this is NOT the number of cranes. However, we suspect construction momentum is easing, so the number is likely to fall in the months ahead, and the index will decline – Melbourne looks likely to be worst hit in the months ahead.
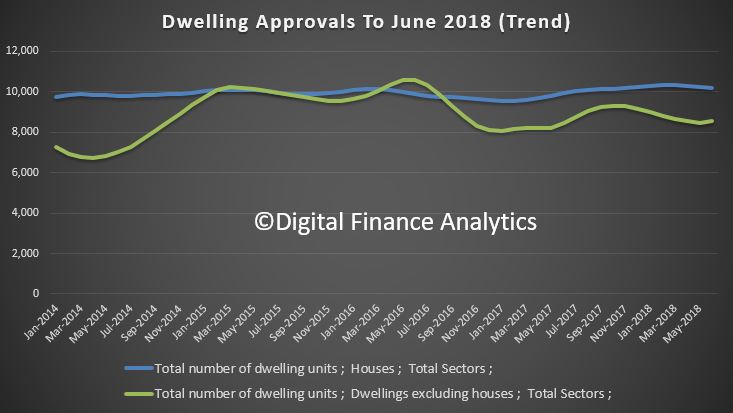
The number of dwellings approved in Australia rose by 0.1 per cent in June 2018 in trend terms, according to data released by the Australian Bureau of Statistics (ABS) today. We suspect the MSM will fixate on the less reliable seasonal results, which show a significant bounce in approvals.
Among the states and territories, dwelling approvals rose in June in the Australian Capital Territory (5.8 per cent), South Australia (5.6 per cent), Northern Territory (4.8 per cent), Tasmania (2.2 per cent), Western Australia (1.7 per cent) and New South Wales (0.2 per cent) in trend terms.
Dwelling approvals fell in trend terms in Queensland (1.6 per cent) and Victoria (1.2 per cent).
In trend terms, approvals for private sector houses fell 0.6 per cent in June. Private sector house approvals fell in Western Australia (1.4 per cent), Victoria (0.9 per cent) and New South Wales (0.8 per cent), but rose in South Australia (0.4 per cent). Private house approvals were flat in Queensland.
In seasonally adjusted terms, total dwellings rose by 6.4 per cent in June, driven by a 7.2 per cent increase in private dwellings excluding houses. Private houses rose 5.0 per cent in seasonally adjusted terms.
The value of total building approved fell 0.8 per cent in June, in trend terms, and has fallen for seven months. The value of residential building rose 0.3 per cent, while non-residential building fell 2.9 per cent.
“The rise was driven by private dwellings excluding houses, which increased by 1.1 per cent in June.” said Justin Lokhorst, Director of Construction Statistics at the ABS. “This was offset by a 0.6 per cent fall in private sector houses.”
The number of dwellings approved in Australia fell by 1.5 per cent in May 2018 in trend terms, according to data released by the Australian Bureau of Statistics (ABS) today. At is all about a fall in unit approvals, with a notable decline in Melbourne. Expect more falls ahead, a further signs of trouble in the housing sector.
“Dwelling approvals have weakened in May, driven by a 2.6 per cent fall in private dwellings excluding houses,” said Justin Lokhorst, Director of Construction Statistics at the ABS.
Among the states and territories, dwelling approvals in May fell in Queensland (4.2 per cent), Victoria (2.7 per cent), Tasmania (2.0 per cent) and Western Australia (0.8 per cent) in trend terms.
Dwelling approvals rose in trend terms in South Australia (4.3 per cent), Northern Territory (2.8 per cent) and Australian Capital Territory (1.5 per cent), and were flat in New South Wales.
In trend terms, approvals for private sector houses fell 0.5 per cent in May. Private sector house approvals fell in Queensland (1.7 per cent), Western Australia (0.6 per cent), South Australia (0.4 per cent) and New South Wales (0.2 per cent). Private sector house approvals were flat in Victoria.
In seasonally adjusted terms, total dwellings fell by 3.2 per cent in May, driven by a 8.6 per cent decrease in private sector houses. Private sector dwellings excluding houses rose 4.3 per cent in seasonally adjusted terms.
The value of total building approved fell 0.7 per cent in May, in trend terms, and has fallen for seven months. The value of residential building fell 0.8 per cent, while non-residential building fell 0.4 per cent.
The HIA said:
“The market is cooling for a number of reasons including a slowdown in inward migration since July 2017, constraints on investor finance imposed by state and federal governments and falling house prices.
“A slowing in Australia’s population growth since June 2017 coincides with changes to visa requirements announced early last year. Since then Australia has experienced almost a year of slowing population growth.
“Finance has become increasingly difficult to access for home purchasers. Restrictions on lending to investors and rising borrowing costs have seen credit growth squeezed. Falling house prices in metropolitan areas have also contributed to banks tightening their lending conditions which have further constrained the availability of finance.
The ABS reports that the number of dwellings approved in Australia fell by 0.1 per cent in April 2018 in trend terms. We see a fall in units, somewhat offset by a rise in houses approved. The seasonally adjusted numbers show a more significant drop.
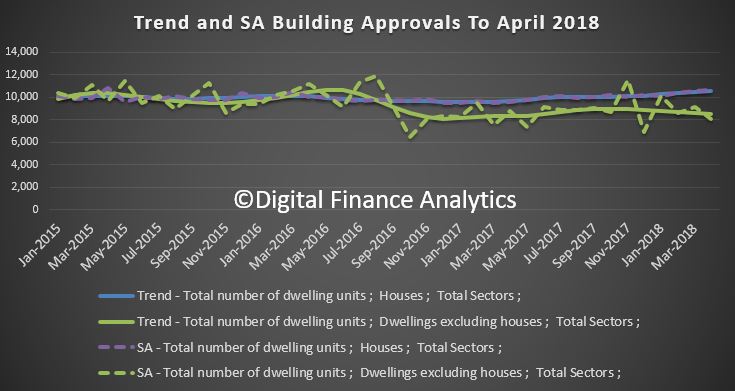
“The total dwellings series has been relatively stable for the past eight months, with around 19,000 dwellings approved per month,” said Justin Lokhorst, Director of Construction Statistics at the ABS. “The strength in approvals for houses is being offset by weakness in semi-detached and attached dwelling approvals.”
Among the states and territories, dwelling approvals fell in April in Tasmania (3.7 per cent), Victoria (2.3 per cent) and Western Australia (2.2 per cent) in trend terms.
Dwelling approvals rose in trend terms in the Australian Capital Territory (14.8 per cent), the Northern Territory (6.7 per cent), South Australia (1.7 per cent), New South Wales (0.9 per cent) and Queensland (0.7 per cent).
In trend terms, approvals for private sector houses rose 0.9 per cent in April. Private sector house approvals rose in Queensland (1.6 per cent), Victoria (1.5 per cent) and New South Wales (0.6 per cent), but fell in Western Australia (0.9 per cent) and South Australia (0.4 per cent).
In seasonally adjusted terms, total dwellings fell by 5.0 per cent in April, driven by a 11.5 per cent decrease in private sector dwellings excluding houses. Private sector houses rose 0.1 per cent in seasonally adjusted terms.
The value of total building approved fell 0.7 per cent in April, in trend terms, and has fallen for six months. The value of residential building fell 0.5 per cent while non-residential building fell 1.0 per cent.
The HIA managed to put a positive spin on the results saying “Detached House Approvals Strongest in 15 Years”.
The performance of the detached house building market is remarkable. The volume of house approvals during the three months to April was 9.9 per cent higher than a year ago – a time when it was already elevated,” said Shane Garrett, HIA’s Senior Economist.
Strong demand for new houses is being sustained by healthy rates of population growth – itself a product of robust labour markets in Australia’s largest cities. While it’s a virtuous circle for detached house building at the moment, there are risks on the horizon.
The ABS released their building approvals data to end March 2018.
The number of dwellings approved in Australia rose in March 2018 in trend terms, with a 0.2 per cent rise.
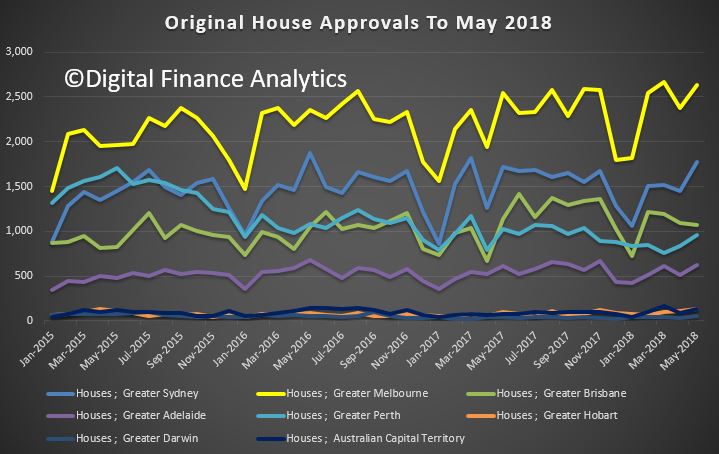
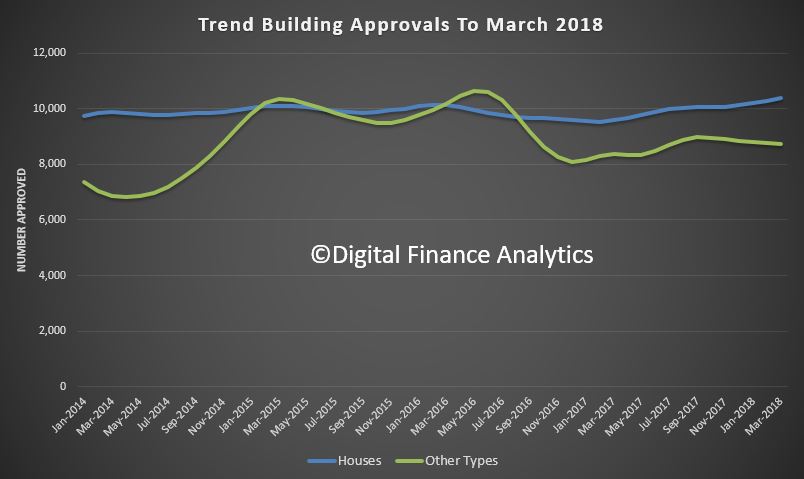 This is being driven by approvals for private sector houses, which have now risen for 13 consecutive months. They are now at their highest level since 2003, in trend terms.
Approvals for private sector houses rose 0.8 per cent in March. Private sector house approvals rose in Victoria (1.8 per cent) and Queensland (1.5 per cent), but fell in Western Australia (2.1 per cent) and New South Wales (0.2 per cent). Private house approvals were flat in South Australia.
But units continue to fall, so overall the biggest trend increase in dwelling approvals in March was in the Australian Capital Territory (28.0 per cent), followed by the Northern Territory (5.3 per cent) and Queensland (2.3 per cent).
There were falls in trend terms in Western Australia (6.7 per cent), Tasmania (4.8 per cent), Victoria (0.5 per cent), New South Wales (0.2 per cent) and South Australia (0.1 per cent).
In seasonally adjusted terms, total dwellings rose by 2.6 per cent in March, driven by a 6.1 per cent increase in private sector dwellings excluding houses. Private sector houses rose 1.1 per cent in seasonally adjusted terms.
The value of total building approved fell 0.6 per cent in March, in trend terms, and has fallen for six months. The value of residential building rose 0.4 per cent while non-residential building fell 2.5 per cent.
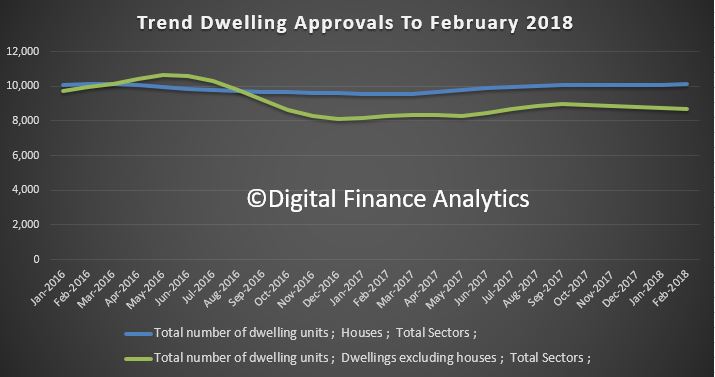
The latest ABS data on residential building approvals were released today.
The number of dwellings approved in Australia fell for the fifth straight month in February 2018 in trend terms with a 0.1 per cent decline.
Approvals for private sector houses have remained stable at around 10,000 for a number of months. But unit approvals have fallen for five months.
Overall, building activity continues to slow from its record high in 2016. And the sizeable fall in the number of apartments and high density dwellings being approved comes at a time when a near record volume are currently under construction. If you assume 18-24 months between approval and completion, then we still have 150,000 or more units, mainly in the eastern urban centres to come on stream. More downward pressure on home prices.
This helps to explain the rise in 100% loans on offer via some developers plus additional incentives to try to shift already built, or under construction property.
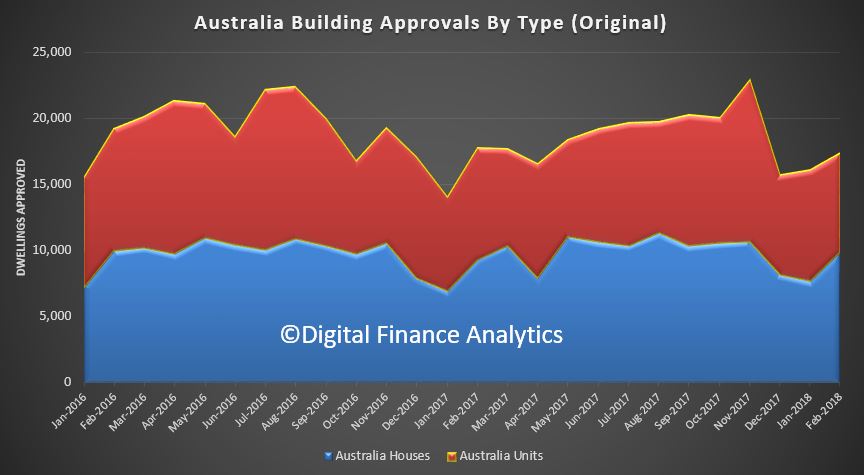
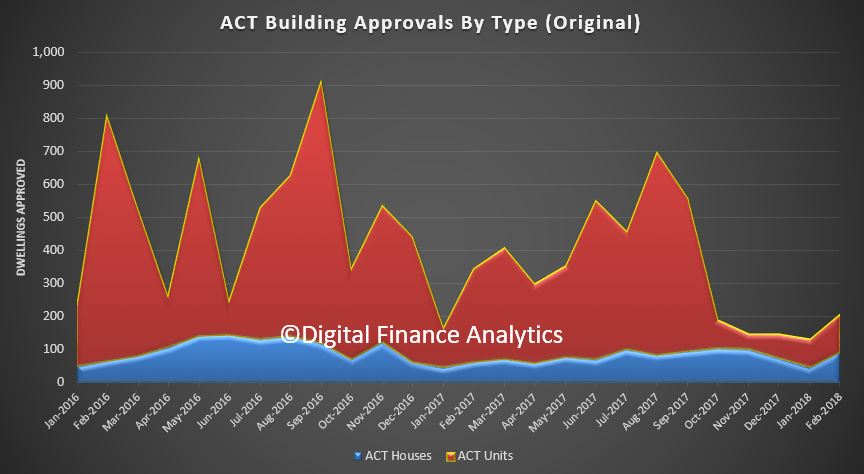
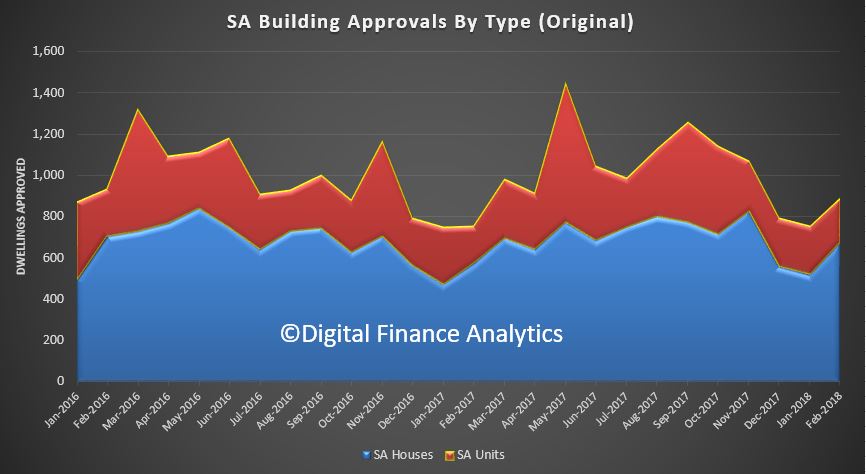
 Here is the data displayed in original terms. Whilst house approvals remains relatively stable, unit approvals are more volatile. This is explained by the changing demand profile as overseas investors and local investment property purchasers retreat. As we discussed recently, this is thanks to tighter lending standards making mortgages more difficult to come by, lower capital growth making investment property less attractive, and stronger controls on overseas investors, both in terms of moving capital to purchase, and local regulations and tighter supervision.
 We can then look across the individual states, as there are significant variations. Among the states and territories, the biggest trend decrease in dwelling approvals in February was the Australian Capital Territory down 18.7 per cent,
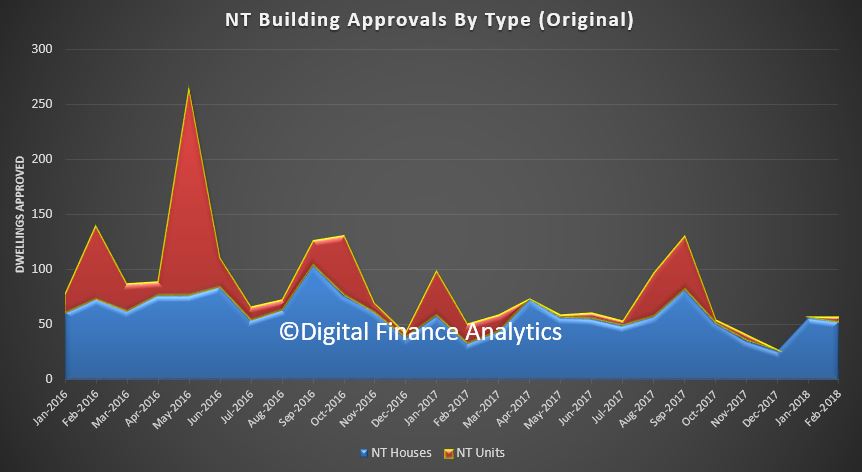
 followed by the Northern Territory (down 7.2 per cent),
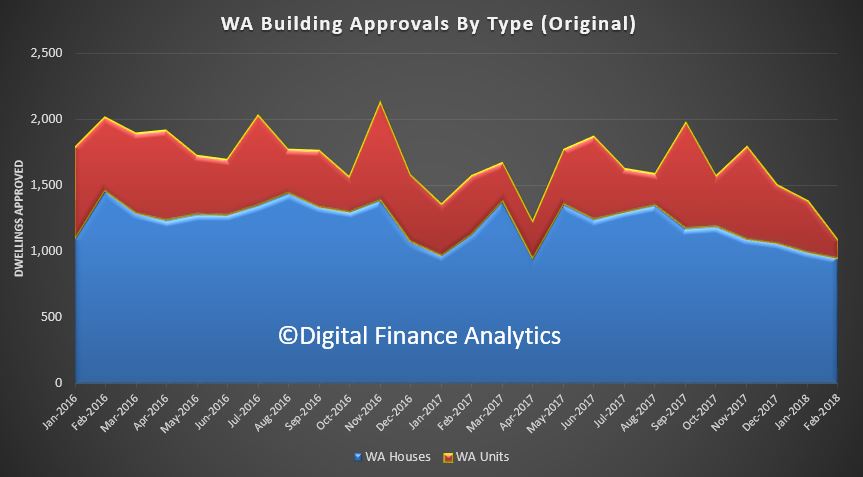
 Western Australia (down 4.4 per cent),
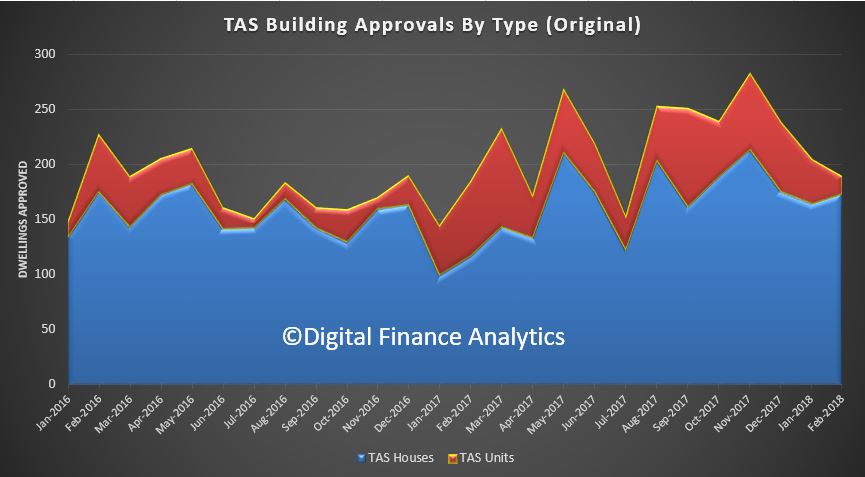
 Tasmania (down 3.4 per cent)
 and South Australia (down 1.2 per cent).
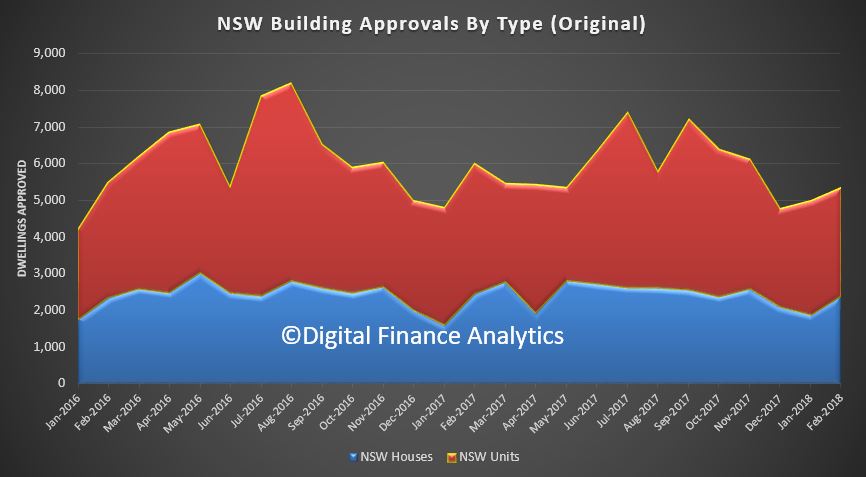
 There were small increases in trend terms in New South Wales (1.0 per cent),
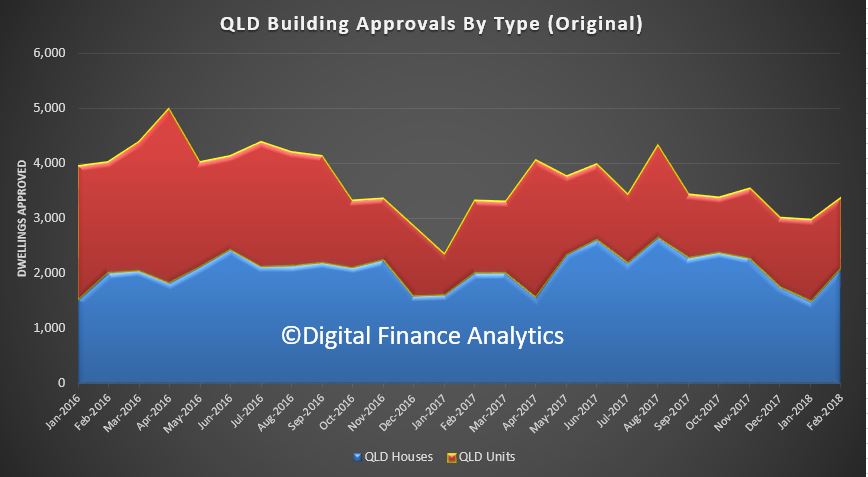
 Queensland (0.9 per cent)
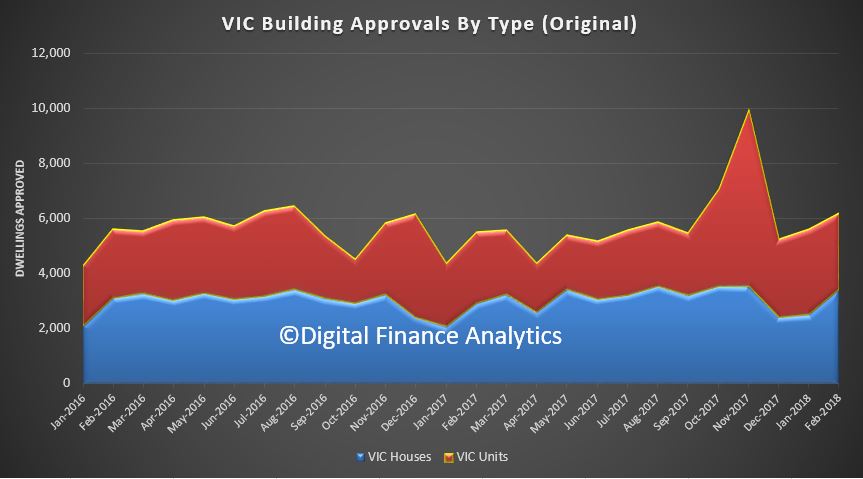
 and Victoria (0.1 per cent).
 Approvals for private sector houses rose 0.2 per cent in trend terms in February. Private sector house approvals rose in Victoria (1.1 per cent) and New South Wales (0.8 per cent), but fell in Queensland (1.1 per cent), South Australia (1.1 per cent) and Western Australia (0.5 per cent).
The value of total building approved fell 1.1 per cent in February, in trend terms, and has fallen for five months. The value of residential building fell 0.1 per cent while non-residential building fell 2.9 per cent.
The number of dwellings approved rose 0.1 per cent in January 2018, in trend terms, after falling for the previous three months, according to data released by the Australian Bureau of Statistics (ABS) today.

“Dwelling approvals rose in January, driven by a large increase in private dwellings excluding houses,” said Justin Lokhorst, Director of Construction Statistics at the ABS. “Approvals for private sector houses have remained stable.”
Dwelling approvals increased in Victoria (2.6 per cent), Tasmania (2.0 per cent), Queensland (1.1 per cent) and Western Australia (0.5 per cent), but decreased in the Australian Capital Territory (32.6 per cent), the Northern Territory (9.3 per cent), South Australia (3.2 per cent) and New South Wales (2.3 per cent) in trend terms.
In trend terms, approvals for private sector houses fell 0.1 per cent in January. Private sector house approvals fell in Queensland (1.6 per cent) and South Australia (1.4 per cent), but rose in New South Wales (0.7 per cent), Victoria (0.3 per cent) and Western Australia (0.3 per cent).
The value of total building approved fell 1.4 per cent in January, in trend terms, and has now fallen for four months. The value of residential building rose 0.5 per cent while non-residential building fell 4.7 per cent.
The ABS released the latest dwelling approvals to December 2017.
The number of dwellings approved fell 1.7 per cent in December 2017, in trend terms, and has fallen for three months.
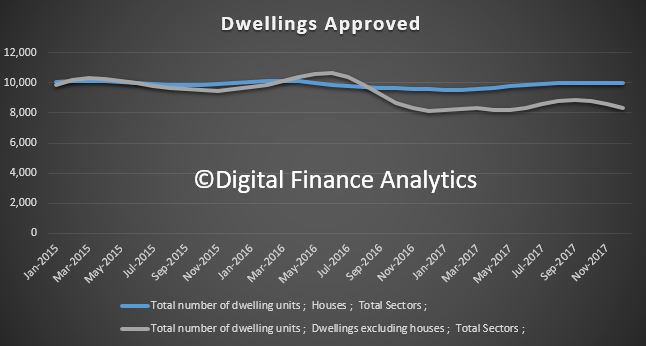 Approvals for private sector houses have remained stable, with just under 10,000 houses approved in December 2017, but the fall was in apartments.
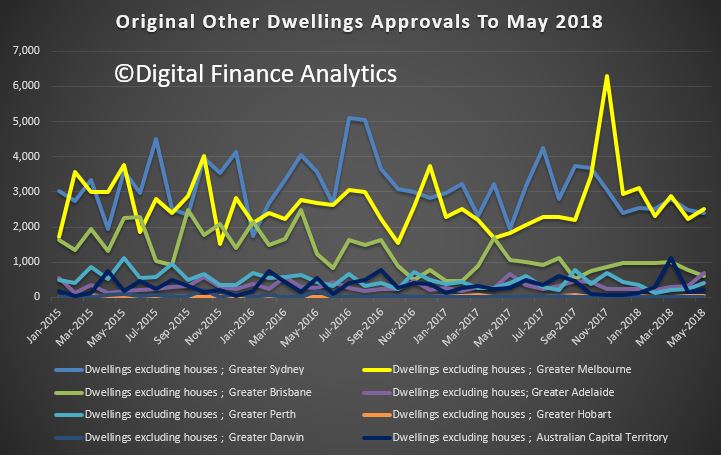
In trend terms, approvals for private sector houses fell 0.2 per cent in December. Private sector house approvals fell in South Australia (1.5 per cent), Western Australia (0.9 per cent) and New South Wales (0.2 per cent) but rose in Queensland (0.4 per cent). Private house approvals were flat in Victoria. But it is the trends in unit approvals which show the most significant variations.
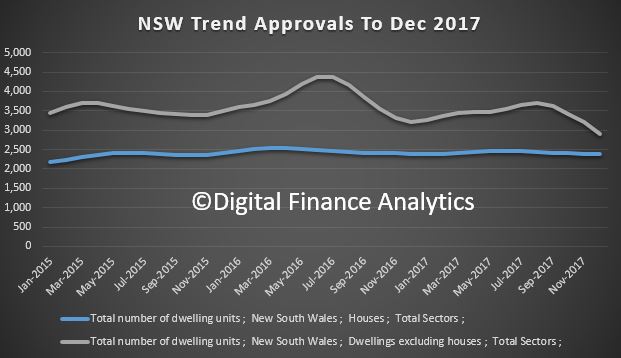
NSW is leading the way down from a high in May 2016.
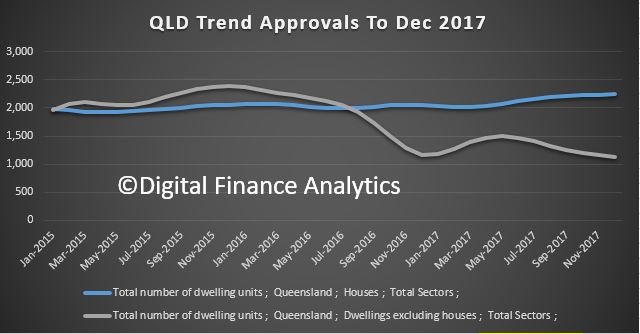
 QLD continues to slow, from a peak in November 2015.
 WA is moving up, just a little, from a low in May 2017.
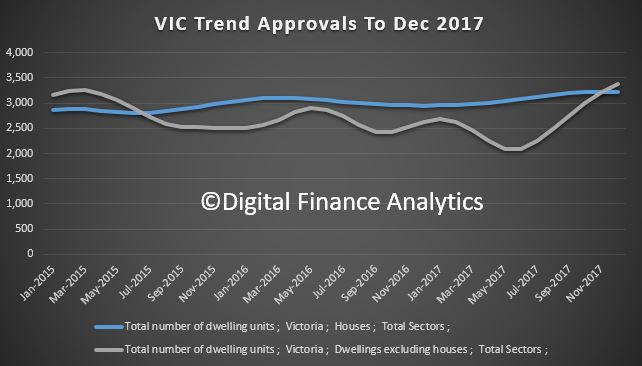
 VIC is bucking the trend, with a significant rise since May 2017, but we wonder for how long, as supply is already taking the heat out of new unit sales.
The value of total building approved fell 0.3 per cent in December, in trend terms, after rising for 11 months. The value of residential building fell 0.2 per cent while non-residential building fell 0.4 per cent.
The number of dwellings approved rose 0.9 per cent in November 2017, in trend terms, and has risen for 10 months, according to data released by the Australian Bureau of Statistics (ABS) today.
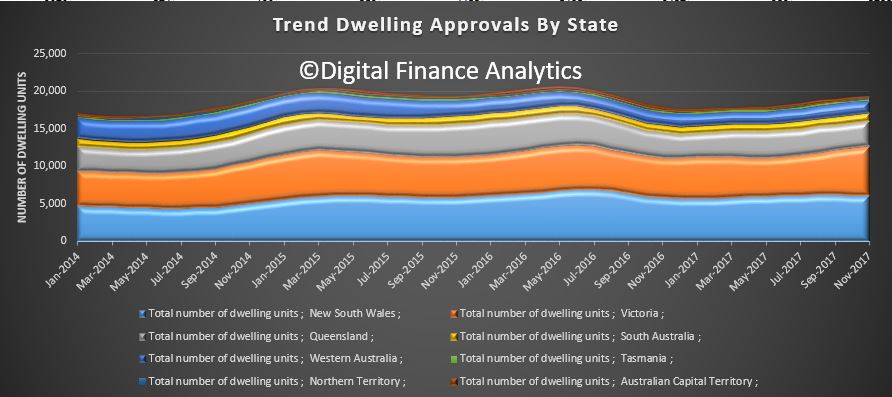
“Dwelling approvals have continued to rise in recent months, which has been driven by renewed strength in approvals for apartments,” said Justin Lokhorst, Director of Construction Statistics at the ABS. “Approvals for private sector houses have remained stable, with just under 10,000 houses approved in November 2017.”
Dwelling approvals increased in November in Victoria (5.6 per cent), Tasmania (3.1 per cent) and South Australia (0.1 per cent), but decreased in the Australian Capital Territory (21.9 per cent), Northern Territory (3.8 per cent), Queensland (1.2 per cent), New South Wales (0.9 per cent) and Western Australia (0.6 per cent) in trend terms.
In trend terms, approvals for private sector houses fell 0.1 per cent in November. Private sector house approvals fell in Western Australia (3.3 per cent), New South Wales (0.8 per cent) and Queensland (0.4 per cent), but rose in South Australia (1.3 per cent) and Victoria (1.1 per cent).
In seasonally adjusted terms, dwelling approvals increased by 11.7 per cent in November, driven by a rise in private dwellings excluding houses (30.6 per cent), while private house approvals fell 2.0 per cent.
The value of total building approved rose 1.5 per cent in November, in trend terms, and has risen for 11 months. The value of residential building rose 2.3 per cent while non-residential building rose 0.2 per cent.