UK’s Financial Policy Committee’s Framework for the Systemic Risk Buffer (SRB)

As part of the legislative package implementing the recommendations of the Independent Commission on Banking in the UK, the Financial Policy Committee (FPC) is required to produce a framework for a systemic risk buffer (SRB) for ring-fenced banks and large building societies.

The SRB is one of the elements of the overall capital framework for UK banks and building societies as set out by the FPC in its publication ‘The framework of capital requirements for UK banks’, which was published alongside the December 2015 Financial Stability Report.

The SRB will be applied to individual institutions by the Prudential Regulation Authority (PRA) and will be introduced, like the ring-fencing rules, from 2019.
Deputy Governor, Financial Stability, Jon Cunliffe said:

“These new rules will mean that large UK banks and building societies are more resilient to adverse shocks, enabling them to continue to lend to households and businesses even in times of stress.  The financial crisis demonstrated the long-lasting damage that can be caused when large banks become distressed and have to cut back lending to the economy.  These proposals are intended to reduce the risk of this happening again.”

Summary of the proposals

It is proposed that those banks and building societies with total assets above £175bn will be set progressively higher SRB rates as total assets increase through defined buckets (see table below). HM Government required the FPC to produce a framework for the SRB at rates between 0% and 3% of risk-weighted assets (RWAs). Under the FPC’s proposals, ring-fenced bank sub-groups and large building societies in scope with total assets below £175bn will be subject to a 0% SRB.

Based on current information, under these proposals the FPC expects the largest ring-fenced bank in 2019 to have a 2.5% SRB. In line with the FPC’s previous announcement on the leverage ratio framework, those institutions subject to the SRB will also be set a 3% minimum leverage ratio requirement, together with an additional leverage ratio buffer calculated at 35% of the applicable SRB rate. For example, an institution with an SRB rate of 1% would have an additional leverage ratio buffer of 0.35%.

As stated in the FPC’s capital framework document in December, the proposed calibration is expected to add around an aggregate 0.5 percentage points of risk-weighted assets to equity requirements of the system in aggregate.

Total Assets (£bns)​ ​
​Risk weighted
SRB rate
Lower threshold Upper threshold​
​0% ​- <175
​1% ​175 <320​
​1.5% ​320 <465​
​2% ​465 <610​
​2.5% ​610 <755​
3%​ ≥755​

The consultation will close on 22 April and the FPC intends to finalise the framework by 31 May 2016. The buffer will apply from 2019.

SME Deposits and Basel

APRA has today written to ADIs about best practices in assessing SME deposits accounts. Essentially, in a recent review of 14 institutions, they found significant inconsistencies, based on how individual ADI’s were choosing to flag balances as a “stable deposit”, whether the customer was in a “stable relationship” with the ADI, and which types of account – especially internet based account should be considered “less stable deposits”. In addition “heavily rate driven deposits” need to be correctly classified.

This complexity is a result of the Basel Committee who  introduced a globally harmonised liquidity framework by developing two minimum standards with the objective of promoting short-term and long-term resilience. The Liquidity Coverage Ratio (LCR) and the Net Stable Funding Ratio (NSFR) were developed to fulfil these objectives and to also enable regulators and investors to make meaningful comparisons between banks. APRA’s expectation is that ADIs with similar business models, balance sheets and customer groups would generate similar cash outflows under the LCR.

The net effect may well be to change the relative attractiveness of rates offered by banks, especially for call deposits offered on line, as they will cost the banks more. On the other hand, deposits, held as part of a longer relationship, with notice periods attached could become more attractive.

Finally, APRA noted that few ADIs benchmarked their offered rates against rates offered by peer competitors for the purposes of this classification and suggests that such benchmarking would constitute good practice.

DFA looked at SME savings balances in our recent report. SME’s have deposits in total worth more than $107bn. The distribution of deposits varies with size. Nearly half is held by the largest firms, and holdings decrease as we look across the smaller-sized firms. The average savings balance varies also between firms which are credit avoiders, and those who are not.


Major Banks’ Shareholders Highly Leveraged; Profits $37bn, Up 10%

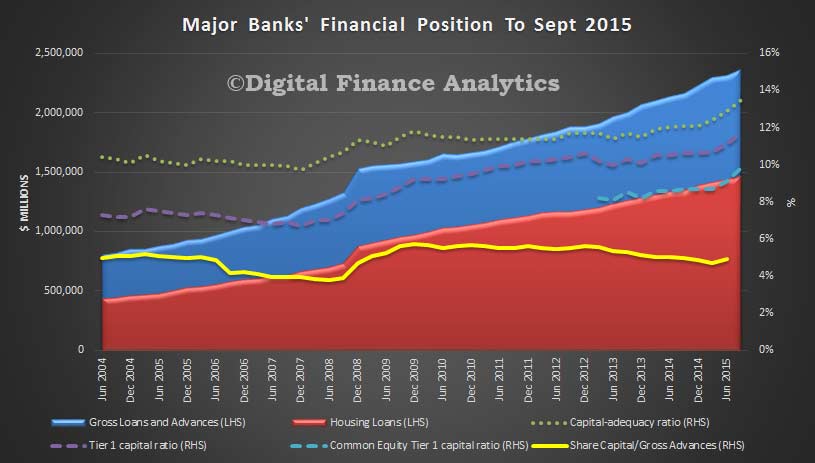
The recently released APRA quarterly banking performance statistics to September 2015 tells an interesting story. We have charted data for the major Australian banks which shows continued housing loan growth, and considerable lifts in the capital ratios in 2015.

However, looking directly at the ratio of gross advances to share capital (ignoring reserves and other factors), we still see the shareholders are highly leveraged, at 4.9% (up from a recent all-time low of 4.7% in June). This is a function of having an ever greater share of home loans in the portfolio, (with lower risk weights). It shows how reliant the banks are on expanding their mortgage books (so directly linked to rising house prices etc.).

Major-Banks-Financals-Sept-2015More broadly, looking at all the ADI’s, on a consolidated group basis, there were 159 firms operating in Australia. The net profit after tax for all ADIs was $37.0 billion for the year ending 30 September 2015. This is an increase of $3.5 billion (10.3 per cent) on the year ending 30 September 2014.

The return on equity for all ADIs was 14.1 per cent for the year ending 30 September 2015, compared to 14.2 per cent for the year ending 30 September 201.

The total assets for all ADIs was $4.58 trillion at 30 September 2015. This is an increase of $420.9 billion (10.1 per cent) on 30 September 2014.

The total gross loans and advances for all ADIs was $2.91 trillion as at 30 September 2015. This is an increase of $237.7 billion (8.9 per cent) on 30 September 2014.

The total capital ratio for all ADIs was 13.7 per cent at 30 September 2015, an increase from 12.4 per cent on 30 September 2014.

The common equity tier 1 ratio for all ADIs was 10.1 per cent at 30 September 2015, an increase from 9.2 per cent on 30 September 2014.

The risk-weighted assets (RWA) for all ADIs was $1.86 trillion at 30 September 2015, an increase of $157.0 billion (9.2 per cent) on 30 September 2014.

Impaired facilities and past due items as a proportion of gross loans and advances was 0.87 per cent at 30 September 2015, a decrease from 1.09 per cent at 30 September 2014. Specific provisions as a proportion of gross loans and advances was 0.22 per cent at 30 September 2015, a decrease from 0.28 per cent at 30 September 2014.

APRA Declares Countercyclical Buffer Rate Is Zero

APRA has today announced that the countercyclical capital buffer applying to the Australian exposures of authorised deposit-taking institutions (ADIs) from 1 January 2016 will be set at zero per cent.

The countercyclical buffer was included within the ADI capital framework as part of the Basel III reforms that were introduced by APRA in 2013. Although the minimum Basel III requirements were implemented from 1 January 2013, the buffer component of the framework will take effect from 1 January 2016.

The capital framework requires ADIs to hold a buffer of Common Equity Tier 1 (CET1) capital, over and above each ADI’s minimum requirement, comprised of three components:

  • a capital conservation buffer, applicable at all times and equal to 2.5 per cent of risk-weighted assets (unless determined otherwise by APRA);
  • an additional capital buffer applicable to any ADI designated by APRA as a domestic systemically important bank (D-SIB), currently set to 1.0 per cent of risk-weighted assets; and
  • a countercyclical buffer which may vary over time in response to market conditions. This buffer may range between zero and 2.5 per cent of risk-weighted assets.

The role of the countercyclical buffer within the Basel III reforms is to ensure that banking sector capital requirements take account of the macro-financial environment in which ADIs operate. It can be deployed by national jurisdictions when excess aggregate credit growth is judged to be associated with a build-up of system-wide risk to ensure the banking system has a buffer of capital to protect it against future potential losses. The buffer can be reduced or removed when system-wide risk crystallises or dissipates. For an ADI with international exposures, the countercyclical buffer applicable to its business will be the weighted average of the countercyclical buffers applied by the jurisdictions in which it operates.

APRA Chairman Wayne Byres noted the decision to set the countercyclical buffer for Australian exposures at zero per cent of risk-weighted assets was made following consultation with the Council of Financial Regulators.

‘Based on APRA’s assessment of current levels of systemic risk, including credit growth, asset prices and lending standards, APRA did not see a case for imposing a countercyclical buffer for Australian exposures at this point in time,’ Mr Byres said. ‘APRA will continue to monitor developments in a range of financial risk indicators, and will revise the determination if conditions warrant it in future.’

The consequence of this decision is that ADIs will generally be required, from 1 January 2016, to maintain a minimum CET1 ratio of 4.5 per cent, plus a 2.5 per cent capital conservation buffer (3.5 per cent for D-SIBs) and a buffer for international exposures in jurisdictions that have set a non-zero countercyclical capital buffer rate. For some ADIs, additional capital requirements are also applied via Pillar 2 (i.e. in response to institution-specific risks and issues). All Australian ADIs currently report CET1 ratios above these requirements: the aggregate CET1 ratio for the banking system as at end September 2015 was 10.1 per cent.

Where an individual ADI does not hold sufficient capital to meet its aggregate buffer requirement, the ADI would be subject to constraints on its ability to make capital and bonus distributions. The distribution constraints imposed on an ADI when its capital levels fall into the buffer range increase as the ADI’s capital level approaches the minimum requirements. This encourages ADIs to maintain a sound capital buffer and provides a mechanism to ensure ADIs conserve capital, and have a strong incentive to restore their capital strength, after a period of loss.

In addition to today’s announcement on the size of the buffer, APRA has also released today:

  • an information paper, The countercyclical capital buffer in Australia, setting out APRA’s approach to assessing the appropriate settings for the countercyclical buffer;
  • a revised and final version of Prudential Standard APS 110 Capital Adequacy (APS 110) that clarifies operational aspects of the countercyclical capital buffer, following consultation earlier this year; and
  • a draft version of Prudential Practice Guide APG 110 Capital Buffers (APG 110) for consultation. The draft APG110 provides additional guidance on the operation of the capital buffers, including some worked examples.

APRA has also informed the Basel Committee on Banking Supervision of the Australian countercyclical capital buffer rate so it can be added to the list of jurisdictions’ buffers that are maintained on the Bank for International Settlements’ website.

The countercyclical buffer information paper, the draft prudential practice guide on capital buffers, and the revised prudential standard APS 110 can be viewed on APRA’s website.

BIS Capital Proposals Revised Again, LVR’s and Investment Loans Significantly Impacted

The second consultative document on Revisions to the Standardised Approach for credit risk has been released for discussion.

There are a number of significant changes to residential property risk calculations . These guidelines will eventually become part of “Basel III/IV”, and will apply to banks not using their internal assessments (which are also being reviewed separately).

First, risk will be assessed by loan to value ratios, with higher LVR’s having higher risk weights. Second, investment property will have a separate a higher set of LVR related risk-weights. Third, debt servicing ratios will not directly be used for risk weights, but will still figure in the underwriting assessments.

There are also tweaks to loans to SME’s.

These proposals differ in several ways from an initial set of proposals published by the Committee in December 2014. That earlier proposal set out an approach that removed all references to external credit ratings and assigned risk weights based on a limited number of alternative risk drivers. Respondents to the first consultative document expressed concerns, suggesting that the complete removal of references to ratings was unnecessary and undesirable. The Committee has decided to reintroduce the use of ratings, in a non-mechanistic manner, for exposures to banks and corporates. The revised proposal also includes alternative approaches for jurisdictions that do not allow the use of external ratings for regulatory purposes.

The proposed risk weighting of real estate loans has also been modified, with the loan-to-value ratio as the main risk driver. The Committee has decided not to use a debt service coverage ratio as a risk driver given the challenges of defining and calibrating a global measure that can be consistently applied across jurisdictions. The Committee instead proposes requiring the assessment of a borrower’s ability to pay as a key underwriting criterion. It also proposes to categorise all exposures related to real estate, including specialised lending exposures, under the same asset class, and apply higher risk weights to real estate exposures where repayment is materially dependent on the cash flows generated by the property securing the exposure.

This consultative document also includes proposals for exposures to multilateral development banks, retail and defaulted exposures, and off-balance sheet items.The credit risk standardised approach treatment for sovereigns, central banks and public sector entities are not within the scope of these proposals. The Committee is considering these exposures as part of a broader and holistic review of sovereign-related risks.

Comments on the proposals should be made by Friday 11 March 2016.

Looking in more detail at the property-related proposals, the following risk weights will be applied to loans against real property:

  • which are finished properties
  • covered by a legal mortgage
  • with a valid claim over the property in case of default
  • where the borrower has proven ability to repay – including defined DSR’s
  • with a prudent valuation (and in a falling market, a revised valuation), to derive a valid LVR
  • all documentation held

If all criteria a met the following risk weights are proposed.

BIS-Dec-12-01For residential real estate exposures to individuals with an LTV ratio higher than 100% the risk weight applied will be 75%. For residential real estate exposures to SMEs with an LTV ratio higher than 100% the risk weight applied will be 85%. If criteria are not met, then 150% will apply.

Turning to investment property, where cash flow from the property is the primary source of income to service the loan

BIS-Sec-12-02Commercial property will have different ratios, based on counter party risk weight.

BIS-Dec-12-03 But again, those properties serviced by cash flow have higher weightings.

BIS-Dec-15-04Development projects will be rated at 150%.

Bearing in mind that residential property today has a standard weight of 35%, it is clear that more capital will be required for high LVR and investment loans. As a result, if these proposals were to be adopted, then borrowers can expect to pay more for investment loans, and higher LVR loans.

It will also increase the burden of compliance on banks, and this will  likely increase underwriting costs. Finally, whilst ongoing data on DSR will not be required, there is still a need to market-to-market in a falling market to ensure the LVR’s are up to date. This means, that if property valuations fall significantly, higher risk weights will start to apply, the further they fall, the larger the risk weights.

Finally, it continues the divergence between the relative risks of investment and owner occupied loans, the former demanding more capital, thus increasing the differential pricing of investment loans.

The Committee notes that the SA is a global minimum standard and that it is not possible to take into account all national characteristics in a simple approach. As such, national supervisors should require a more conservative treatment if they consider it necessary to reflect jurisdictional specificities. Furthermore, the SA is a methodology for calculating minimum risk-based capital requirements and should in no way be seen as a substitute for prudent risk management by banks.

Now, some will argue that in Australia, this will not impact the market much, as the major banks use their own internal models, however, as these are under review (with the intent of closing the gap somewhat with the standard methods used by the smaller players) expect the standard models to inform potential changes in the IRB set. Also, it is not clear yet whether banks who use lenders mortgage insurance for loans above 80% will be protected from the higher capital bands, though we suspect they may not. Non-bank lenders may well benefit as they are not caught by the rules, although capital market pricing may well change, and impact them at a second order level. We will be interested to see how local regulators handle the situation where an investment loan is partly serviced by income from rentals, and partly from direct income, which rules should apply – how will “materially dependent” be interpreted?

 

No Change in UK Bank Capital Plans Following Stress Tests

Fitch Rating. says that after its latest stress tests, the Bank of England’s (BoE) assessment is that the UK banking sector is adequately capitalised and the results will not force any capital planning revisions. Further sector-wide capital step-ups are unlikely in future.

Capital ratios are likely to remain stable, held up by the BoE’s increased use of countercyclical buffers. These will be built up as lending growth accelerates and will be released when the cycle turns. The BoE’s intention is that banks’ capital planning should become more efficient and flexible. The BoE’s Financial Policy Committee indicated that it considers a Tier 1 capital adequacy ratio of 11% to be appropriate for the sector. Fitch expect banks to set their internal buffers relative to this level and plan their capital needs relative to the level of sensitivity to stress test inputs.

Results from yesterday’s stress test show that, under the baseline scenario, the seven participating banks are improving their capital positions. But the Royal Bank of Scotland Group (RBS; BBB+/Stable) and Standard Chartered (A+/Negative) did not meet the BoE’s capital requirements under the stress scenario. Both banks have taken, or are taking steps this year to address capitalisation.

The regulator will use future stress test results to assess individual banks’ capital requirements. Fitch expects the tests to become more sophisticated and more qualitative in nature. This is already the case in the US where the Federal Reserve’s annual Comprehensive Capital Analysis and Review plays an important role in how the country’s leading banks assess their capital planning exercises.

In the UK, annual cyclical tests will be run to capture risks from financial cycles, with the severity of scenarios increasing as risks build up. This should produce more rounded stressed results. Latent risks not captured by the annual cyclical scenario will be introduced every other year when the BoE will run a biannual stress test. Fitch thinks the banks should, over time, be able to anticipate broad movements in the annual cyclical scenario, making it easier for them to set internal buffers above minimum regulatory requirements, based on their expected sensitivity to the regulatory stress test.

The 2015 stress test hurdles – a 4.5% common equity tier 1 (CET1) ratio and a 3% leverage ratio – were not particularly onerous. All participating banks met these. But hurdle rates will evolve and banks will need to meet their Pillar 1 minimum CET1 ratios under stressed scenarios, plus any additional requirements set by the regulators under Pillar 2A and buffers for systemically important banks.

Why Lifting Capital Ratios Is Not Enough

Regulators here and overseas are forcing banks to hold more capital in order to make the banking system “more secure”. In Australia, because of the lack of true competition, this will in practice mean the banks passing additional costs through to borrowers, thus maintaining the high (on an international basis) shareholder returns. Higher capital means higher priced bank products.

However, continuing to lift capital ratios will not alone make banks more secure. There are other strategies which we need to consider if we are truly to have undoubtedly strong banks.  We need, in effect, to broaden the debate.

First, one of the main drivers of higher capital is to ensure that banks, should they get into trouble, would not be bailed out by tax payers via government intervention. In 2007, the UK the government became the major shareholder in a number of banks, which were on the brink. This led in turn to significant public debt, which has yet to be repaid. The FSI estimated that the economic cost of a severe financial sector crisis is around 158 per cent of annual GDP. For Australia, this is around $2.4 trillion. And this is just the annual cost. The question becomes how to handle banks that are too big to fail and get into difficulty. It should be essential for banks to think the unthinkable, and have in the bottom draw a secure exit plan should they get into difficulty, and this resolution plan has to be approved by the banking regulator. It should not simply be “raise more capital”, because as the APRA stress tests highlighted recently, individual banks assumed they could top up their reserves in a crisis, but did not consider the fact that everyone might be trying to do this at the same time (because of a broader crisis) as so might not be successful.

Second, and connected to the work-out plans, we think there is a case to ring-fence the retail bank operations of these large financial conglomerates, from their other operations. Risks in the treasury, wealth management, insurance, and international trade areas are potentially higher than in core retail banking. At the moment, it is all scrambled. The UK for example, to working towards adequate risk separation of core banking operations and the other elements within financial conglomerates. Whilst implementation needs to take account of the structure of individual entities, we think this is important.

Third, the obligations of the top managers in the banks with regards to complying with regulation should be clearly stated and enforced. We have seen  some banks essentially flex lending standards to maintain market share. APRA and ASIC have both highlighted these shortcomings and the RBA have admitted risks were higher than initially thought because of loose lending criteria. The obligations on top managers should have legal force, and in severe cases of non-compliance, regulators should be more overtly holding them to account personally. More broadly, this speaks to the cultural norms within the banks, and the incentives in place. It also balances the obligations of regulators and those managing the banks – at the moment, it appears the onus is too much on the regulators to try and “catch” bad behaviour, rather than having the right behaviours championed by the banks themselves. This balance needs to be recast.

Fourth, we need stronger, real competition in the banking sector, not the faux competition where everyone marches to the same tune, and follows each other with rate rises and falls. We have some of the most profitable banks in the world, thanks to weak competition, not brilliant management, or super efficiency. Regulators are more concerned with financial stability than competition, though moving the dial on IRB banks from 15-17 to 25 is a starting point, tweaking capital is not sufficient. With so many regulatory authorities involved, from ACCC, APRA, ASIC and RBA, the onus of driving real competition falls through the cracks, at the expense of Australia Inc. The FSI recommended ASIC be given a specific competition mandate.

We should not become myopic about more capital being the total solution to fixing the banking system. Structure, culture, competition and governance must all be on the table.

Financial Stability Review Says Housing Risks Higher Than Thought

The RBA released their latest Financial Stability Review today. It is worth reading through the 66 pages, because there are a number of important themes, relating to housing. Underlying this though is a beat which could be interpreted as the RBA admitting they have misread the housing sector.

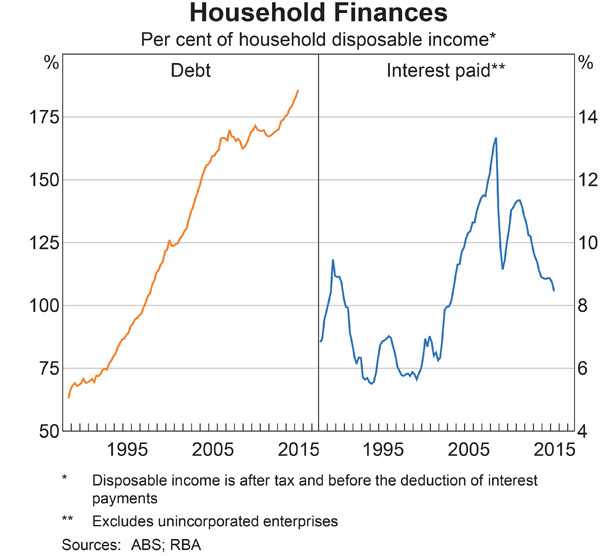
In summary, they recognise that underwriting standards were not as good as initially thought, the investment loan and interest only loan sectors carry potentially higher risks, and the changes to capital and regulatory standards will have a mitigating impact, over the medium term. That said, households remain well placed (despite the highest ever debt at lowest ever interest rates).

6tl-hhfinThey are however concerned about the impact of the current residential construction boom.

They also highlight risks from lending by banks to the commercial property sector, and the ongoing use of SMSF’s to invest in property.

There is also a section of the capital ratios for the banks, both under then IRB and standard approaches to capital ratios. Of particular note is for banks using the standard approach, they show how the presence of Lender Mortgage Insurance (LMI) and different LVR’s impact the capital weights. Despite the upcoming move from 17 to 25 basis points for banks under the advanced IRB approach, banks with the standard approach remain at a competitive disadvantage.

Australian Bank Capital Journey Is Far From Over

‘In Search Of …. Unquestionably Strong’ was the title of a speech given by APRA Chairman Wayne Byres. It is he highlights that there is an ongoing journey towards building greater capital ratios for the banks.

He makes two points of note. First banks around the world are on the same journey, so it must continue, and second, what ‘unquestionably strong’ meant precisely was largely left for APRA to determine. Its not a matter of mechanically moving in step with international benchmarks to maintain top quartile position.

He went ahead to reinforce the point that top quartile positioning is just one means of looking at the issue, and certainly not the only one to use;  highlighted that there are many unknowns about the way capital adequacy will be measured in future, so it is not the end of the story; and that capital is just one measure of the strength of an ADI, and ideally we should think about ‘unquestionably strong’ with a broader perspective.

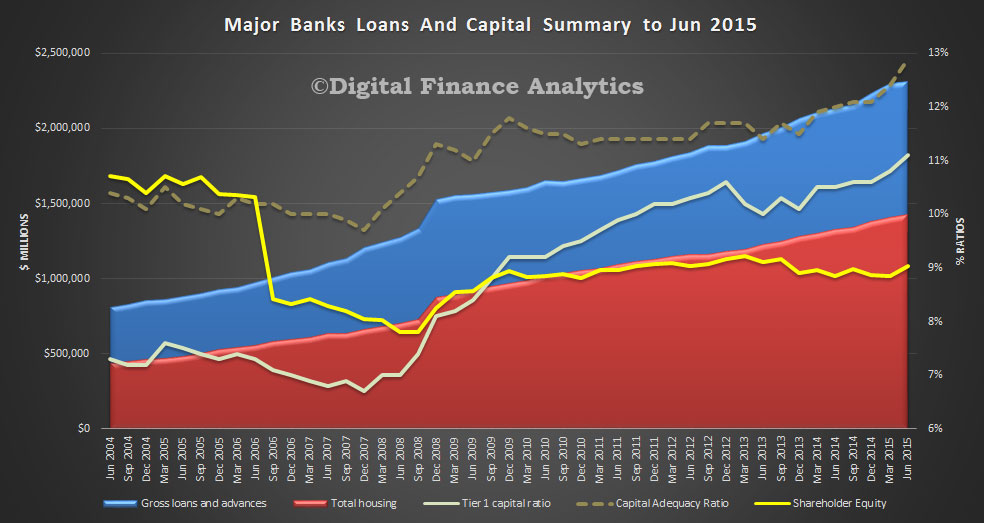
Using the data from the quarterly performance statistics he compared the capital ratios again CET1 and other measures. We have highlighted the fact that the ratio of loans to shareholder capital has not improved and concluded “We also see the capital adequacy ratio and tier 1 ratios rising. However, the ratio of loans to shareholder equity is just 4.7% now. This should rise a bit in the next quarter reflecting recent capital raisings, but this ratio is LOWER than in 2009. This is a reflection of the greater proportion of home lending, and the more generous risk weightings which are applied under APRA’s regulatory framework. It also shows how leveraged the majors are, and that the bulk of the risk in the system sits with borrowers, including mortgage holders. No surprise then that capital ratios are being tweaked by the regulator, better late then never”.

APRA-Major-ADI-Ratios-and-Loans-June-2015He concluded that APRA was still thinking about how to define ‘unquestionably strong’ and the role of top quartile positioning and made five closing points.

  1. we have a soundly capitalised banking system overall in Australia;
  2. with the aid of recent capital raisings, the initial 70 basis point CET1 gap to the top quartile that we identified is likely to have been substantially closed;
  3. higher capital ratios are likely to be needed if current relative positioning is to be retained and enhanced, particularly if measures beyond CET1 are examined;
  4. by quickly moving on the FSI recommendation regarding mortgage risk weights, APRA has created time to consider international developments emerging over the next year or so; and
  5. given where we are today, APRA and the banking industry have time to manage any transition to higher capital requirements in an orderly fashion.

We would observe that the first two statements seem contradictory – if we are so well capitalised, why the lift in capital by 70 basis points? Why also are regulators all round the world desperately lifting ratio? The short answer is because they let the ratios get too lean and mean – as demonstrated by the GFC. This has to be addressed.

So, in short, the journey lays ahead. Then of course Basel IV is just round the corner. Australian banks are likely to find the costs of doing business will continue to rise. with consequences for loan pricing, loan availability and bank profitability.

Latest Global Basel III Monitoring Results Announced Today

The Bank for International Settlements has just released its latest Basel III Monitoring Report.  This included five banks from Australia, four group one, and one group two bank. This report presents the results of the Basel Committee’s latest Basel III monitoring exercise. The study is based on the rigorous reporting process set up by the Committee to periodically review the implications of the Basel III standards for banks. The results of previous exercises in this series were published in March 2015, September 2014, March 2014, September 2013, March 2013, September 2012 and April 2012.

Data have been provided for a total of 221 banks, comprising 100 large internationally active banks (“Group 1 banks”, defined as internationally active banks that have Tier 1 capital of more than €3 billion) and 121 Group 2 banks (ie representative of all other banks).

The results of the monitoring exercise assume that the final Basel III package is fully in force, based on data as of 31 December 2014. That is, they do not take account of the transitional arrangements set out in the Basel III framework, such as the gradual phase-in of deductions from regulatory capital. No assumptions were made about bank profitability or behavioural responses, such as changes in bank capital or balance sheet composition. For that reason, the results of the study are not comparable to industry estimates.

Data as of 31 December 2014 show that all large internationally active banks meet the Basel III risk-based capital minimum requirements as well as the Common Equity Tier 1 (CET1) target level of 7.0% (plus the surcharges on global systemically important banks – G-SIBs – as applicable). Between 30 June and 31 December 2014, Group 1 banks reduced their capital shortfalls relative to the higher Tier 1 and total capital target levels; the additional Tier 1 capital shortfall has decreased from €18.6 billion to €6.5 billion and the Tier 2 capital shortfall has decreased from €78.6 billion to €40.6 billion. As a point of reference, the sum of after-tax profits prior to distributions across the same sample of Group 1 banks for the six-month period ending 31 December 2014 was €228.1 billion.

Under the same assumptions, there is no capital shortfall for Group 2 banks included in the sample for the CET1 minimum of 4.5%. For a CET1 target level of 7.0%, the shortfall narrowed from €1.8 billion to €1.5 billion since the previous period.

The average CET1 capital ratios under the Basel III framework across the same sample of banks are 11.1% for Group 1 banks and 12.3% for Group 2 banks.

Basel III’s Liquidity Coverage Ratio (LCR) came into effect on 1 January 2015. The minimum requirement is set initially at 60% and will then rise in equal annual steps to reach 100% in 2019. The weighted average LCR for the Group 1 bank sample was 125% on 30 June 2014, up from 121% six months earlier. For Group 2 banks, the weighted average LCR was 144%, up from 140% six months earlier. For banks in the sample, 85% reported an LCR that met or exceeded 100%, while 98% reported an LCR at or above 60%.

Basel III also includes a longer-term structural liquidity standard – the Net Stable Funding Ratio (NSFR) – which was finalised by the Basel Committee in October 2014. The weighted average NSFR for the Group 1 bank sample was 111% while for Group 2 banks the average NSFR was 114%. As of December 2014, 75% of the Group 1 banks and 85% of the Group 2 banks in the NSFR sample reported a ratio that met or exceeded 100%, while 92% of the Group 1 banks and 93% of the Group 2 banks reported an NSFR at or above 90%.