APRA On Lending Standards And Capital

APRA’s Wayne Byres today spoke at the COBA CEO & Director Forum in Sydney. His speech was entitled ‘Sound lending standards and adequate capital: preconditions for long-term success’. He highlights some interesting behaviourial differences between banks when it comes to the appraisal of mortgage loans, and also talks (and reinforces APRA’s position) with regards to capital measures.

I’d like to use my time today to talk about two issues of relevance to all ADIs: credit risk and capital. In the world of banking supervision, these are at the heart of what we do: credit risk because it is far and away the biggest risk that ADIs take on, and capital because it is a critical form of defence for when those risks go awry. Sound lending and adequate capital do not guarantee long-run success, but they are certainly a precondition for it.

Reinforcing sound lending standards

For many of you in the room today, the largest part of your loan portfolios is lending for housing. In that, you are reflective of the broader banking system in Australia. Across all ADIs, the proportion of lending attributable to housing has increased over the past decade from (an already dominant) 55 per cent to a little under 65 per cent today. For credit unions and building societies, the trend is directionally the same, but the dominance of housing even greater (Chart 1).

Chart1: Housing loans as a share of total lending

I have made the point elsewhere that the traditionally low risk nature of Australian housing portfolios has provided important ballast for the Australian banking system – a steady income stream and low loss rates from housing loan books have helped keep the system on a reasonably even keel, despite occasional stormy seas and misadventures elsewhere1. Much of the ongoing trust and confidence in the system, by Australian depositors and international investors alike, is founded on this history of stability.

It is not something we should place at risk.

The current economic environment for housing lenders is characterised by heightened levels of risk, reflecting a combination of historically low interest rates, high household debt, subdued income growth, unemployment that has drifted higher, significant house price growth, and strong competitive pressures. Many of these features have been emerging over a number of years, and APRA’s supervision has been intensifying in response. In addition to a heightened level of supervisory activity at individual ADIs, APRA has, for example:

  • increased the level of analysis of mortgage portfolios, including regular review of detailed data on ADI underwriting policies and key risk indicators, to identify outliers;
  • written to boards of the larger lenders, seeking their written assurances with respect to their oversight of the evolving risks in residential mortgage lending;
  • issued a prudential practice guide (APG 223) on sound risk management practices for residential mortgage lending; and
  • completed a stress test of the largest ADIs, with two scenarios focussed on a severe downturn in the housing market.

Not all of you have been directly involved with every one of these initiatives, but I’m sure you will have felt APRA’s presence in some shape or form.

We see this increasing intensity as an example of APRA’s risk-based approach to supervision. As housing-related risks have potentially grown, we have sought to ‘turn up the dial’ of our supervisory scrutiny and, importantly, ensure that Boards and management of ADIs are doing likewise.

Our most recent turning up of the dial was the letter sent to all ADIs in December last year regarding our plans to reinforce sound lending standards2. The letter, beyond expressing some of the general concerns I have just touched upon, also set out some more specific areas that APRA supervisors would be focussing on, and how we would respond if we felt our concerns were not being addressed. Similar sentiments have also been included in more recent letters sent to smaller ADIs.

There are a number of additional regulatory and supervisory tools that APRA has available to address emerging risks: additional supervisory monitoring and oversight, supervisory actions involving Pillar 2 capital requirements for individual ADIs, and higher regulatory capital requirements at a system-wide level. Beyond this, there are more direct controls that are increasingly being used in other jurisdictions, such as limits on particular types of lending – what are commonly referred to as macro-prudential controls.

Up to this point, we have opted to stick with traditional micro-prudential tools targeted at individual ADIs and their specific practices, albeit with an eye to financial stability risks as well as the safety and soundness of individual entities. We are not seeking to determine an appropriate level of house prices, or a particular level of household debt. That is beyond our mandate. Our goal is simpler: reinforcing sound lending standards, which is the ‘bread and butter’ work of a banking supervisor.

Credit assessments – room for improvement

Accurately assessing a borrower’s ability to service and ultimately to repay a loan without undue hardship, including under periods of economic stress, is an inherent component of sound credit risk management, particularly for residential mortgage lending.3

One of the interesting challenges of assessing serviceability practices has been that, just as the vast majority of motor vehicle drivers believe they are above average in driving ability, ADIs invariably claim their lending standards are at the more conservative end of the spectrum, and that it is their competitors that are the source of poor practices. As with everyone claiming to be an above-average driver, not every ADI can be right.

To help us get to the bottom of this, we recently undertook a small hypothetical borrower survey. We asked a number of the larger housing lenders (including a few mutuals) to provide their serviceability assessments for four hypothetical borrowers that we invented (two owner-occupiers, and two investors). The outcomes for these hypothetical borrowers helped to put the spotlight on differences in credit assessments and lending standards. The outcomes were quite enlightening for us – and, to be frank, a little disconcerting in places.

Mortgage lending is often thought of as a fairly commoditised product, but in reality there are wide differences in how lenders assessed the risk of a given borrower. The first surprising result from our review was the very wide range of loan amounts that, hypothetically, were offered to our borrowers. It was not uncommon to find the most generous ADI was prepared to lend in the order of 50 per cent more than the most conservative ADI.

More importantly, the exercise also allowed us to explore the key drivers of difference in risk assessments across lenders. Serviceability is obviously multi-dimensional; it depends on how big a loan is extended, relative to a borrower’s income (and the reliability of the various components of that income) and the nature and extent of non-housing obligations that a borrower needs to meet.

One significant factor behind differences in serviceability assessments, particularly for owner occupiers, was how ADIs measured the borrower’s living expenses (Chart 2a and 2b). As a regulator, it is hard to understand the rationale for large differences in what should be a relatively objective, and extremely critical, metric.4

Chart 2a: Minimum living expense assumptions shows percentage of owner-occupier borrower pre-tax salary income between 20%-35%
Chart 2b: Minimum living expense assumptions shows percentage of investor borrower pre-tax salary income between 0%-25%

Of major concern were a few ADIs who opted to make their credit assessment based on a lower level of living expenses than that declared by the borrower. That is obviously a practice that should not continue, and ADIs should be making reasonable inquiries about a borrower’s living expenses. In fact, best practice (and intuition) would be to apply minimum living expense assumptions that increase with borrower incomes; this was a practice adopted by only a minority of ADIs in our survey.

The treatment of other income sources (such as bonuses, overtime and investment earnings) also played a large role in credit decisions (Chart 3). Common sense would suggest it is prudent to apply a discount or haircut to these types of income, reflecting the fact they are often less reliable means of meeting regular loan repayments. Unfortunately, common sense was sometimes absent.

Chart 3: Income recognised (less tax and haircuts) shows percentage of investor borrower gross pre-tax income

Another area of interest was the discount or ‘haircut’ applied to declared rental income on an investment property. The norm in the ADI industry seems to be a 20% haircut, but we noted in our exercise that some ADIs based their serviceability assessment on smaller, or even zero, haircuts. Bearing in mind that the cost of real estate fees, strata fees, rates and maintenance can easily account for a significant part of expected rental income, and this does not take into account potential periods of vacancy, the 20% norm itself does not seem particularly conservative. We also came across a few instances in which ADIs were relying on anticipated future tax benefits from negative gearing to get a borrower over the line for a mortgage.

Variations in assessments were also driven by the size of interest-rate buffers applied to the new loan (Chart 4) – something we flagged in our December letter as an area of particular importance. For investor lending, this issue was more pronounced: a major driver of differences across ADIs was whether an interest-rate buffer was applied to both the investor’s existing debts (such as loans outstanding on existing owner-occupied or investment properties), as well as to the proposed new loan. As of earlier this year when the survey was conducted, only about half of the surveyed ADIs applied such a buffer to existing debts (all applied some form of buffer to new debts). I confess to struggling to see the logic of such an approach – after all, any rise in interest rates will at some point in time affect the borrower’s other debts just as they will for the new loan being sought.

Chart 4: Existing mortgage debt shows interest rate used in investor serviceability assessment between 4%-9%

The final area I would highlight were differences in the treatment of interest only loans. Our test included one borrower seeking a 30-year loan, with the first 5 years on an interest-only basis. Only a minority of surveyed ADIs calculated the ability to service principal and interest (P&I) repayments over the residual 25 year term. Despite the contractual terms, the majority assumed P&I repayments over the full 30-year term, and hence were able to inflate the hypothetical borrower’s apparent surplus income by, in our particular example, around 5 per cent.

So there is no confusion, let me be clear that Australian ADIs are thankfully well away from the types of subprime lending that have caused so many problems elsewhere (eg lending with an LVR in excess of 100 per cent, at teaser rates, to borrowers with no real capacity to repay). Nevertheless, our overall conclusion from this hypothetical borrower exercise was that there were clearly examples of practice that were less than prudent. As a result, we have shown ADIs that participated in the exercise how they compare to their peers and where their serviceability assessments could be strengthened: in all of the examples above, we expect to see changes to practices across a range of ADIs.

In doing so, we have been asked whether APRA is trying to standardise mortgage risk assessments or impose a common ‘risk appetite’ across the industry. In fact, we do think it important that ADIs adhere to some minimum expectations with respect to, for example, interest-rate buffers and floors, and adopt prudent estimates of borrower’s likely income and expenses. In that regard, to the extent we are reinforcing a healthy dose of common sense in lending standards, greater convergence is probably warranted.

At the same time, we certainly want to see competition between lenders and fully accept that different ADIs can have different risk appetites. And we are not seeking to interfere in ADIs’ ability to compete on price, service standards or other aspects of the customer experience. However, making overly optimistic assessments of a borrower’s capacity to repay does not seem a sensible or sustainable basis on which to attract new customers or retain existing ones. It also runs the risk of adverse selection and an accumulation of higher risk customers who (perhaps quite justifiably) cannot get finance elsewhere. To go back to my opening remarks, it does not fulfil the precondition for long-term success.

I have mentioned all of this for two reasons:

  • First, because what at first glance might seem prudent practice is not always so. When our December letter was issued, a number of ADIs were quick to point out they were already utilising a floor rate of 7 per cent and a buffer of 2 per cent within their serviceability assessments. Leaving aside that our letter suggested it would be good practice to operate comfortably above those levels, if the buffers are being applied to overly optimistic assessments of income, or only to part of the borrower’s debts, they do not serve their purpose.
  • Second, because much of the attention given to our December letter has focussed on the 10 per cent benchmark for growth in investor lending. I want to emphasise that our analysis goes much broader than just investor lending growth, and captures ADIs’ lending standards and risk profile across the board. Investor lending aspirations will only be one factor in our consideration of the need for further supervisory action.

This work on lending standards has been intensive and time-consuming for APRA and, no doubt, all of the ADIs involved, but has been well worth it if we have been able to reinforce sound lending standards across the industry. (If you have not yet looked at your own policies in the areas I have outlined, I would encourage you to do so as a matter of priority.) Of course, we will need to keep up our scrutiny and be alert to both subsequent policy changes, and/or substantial policy overrides (ie loan approvals outside policy). The latter will warrant particular attention by both ADIs and APRA: if policies are tightened only for overrides to correspondingly increase, we will have not achieved our objective.

That also applies to business plans and growth aspirations: where we have agreed plans with ADIs, we will obviously be monitoring closely to see that they kick into effect in the second half of the year. We recognise that it takes time for growth plans to alter course, especially given lending pipelines of pre-approved loans (there is also typically slightly stronger growth in the second quarter of the calendar year). However, ADIs have now had long enough to revise their ambitions where needed, and we will be watching carefully to see a moderation in growth in investor lending in the second half of the year as revised plans are implemented.

Developments in capital standards

Let me now turn to capital adequacy.

As most of you know, there were five recommendations from the Final Report of the Financial System Inquiry that relate to ADI capital:

  • Recommendation 1 – that we set ADI capital standards in such a manner as to ensure ADIs are ‘unquestionably strong’ (with a suggestion this could be met by having Australian banks in the top quartile when measured against the capital ratios of international peers);
  • Recommendation 2 – that we narrow the differential in risk weights on mortgages between the standardised and internal-ratings based (IRB) approaches (again, with a suggestion of a 25-30 per cent risk weight for the IRB approach);
  • Recommendation 3 – that we should implement a framework for additional loss absorbing and recapitalisation capacity in line with international practice;
  • Recommendation 4 – that we develop a reporting template that allows the capital ratios of Australian ADIs to be reported without the impact of APRA adjustments to the Basel minimums; and
  • Recommendation 8 – that we introduce a leverage ratio as a backstop to the risk-based capital framework.

In addition, the Basel Committee has work underway that will intersect with these recommendations. Most relevantly, it is currently considering:

  • responses to submissions on proposed revisions to the standardised approach, including, importantly, to housing risk weights;
  • responses to submissions on proposed revisions to the capital floor for banks using the IRB approach; and
  • how the IRB framework can be reinforced, given the increasing scepticism towards modelling approaches in light of the excessive variability in capital requirements they are producing.

To repeat what I have said previously, it is to everyone’s benefit that we approach the FSI and Basel proposals in a coordinated manner. But that does not mean waiting until every i is dotted and t is crossed.

The Basel Committee meets again in June to review the way ahead on its various proposals. I do not think it will be too long after that that we are able to announce how we will respond to those issues that are easiest to tackle sooner rather than later (particularly Recommendations 2 and 4). Other items will take a little longer to pin down the precise detail. But the direction is clear, and we fully support the FSI’s recommendation that Australian ADIs should be unquestionably strong. So it also makes sense to start early and move forward in an orderly fashion wherever possible: affected ADIs should, provided they take sensible opportunities to accumulate capital, be well-placed to accommodate these changes when they occur.

What does all of it mean for customer-owned banking organisations? As this audience already knows, the capital ratios of credit unions and building societies stand, on average, well above that of the rest of the banking sector (Chart 5), providing a healthy buffer with which to accommodate any future changes. I suspect that, when looked at in aggregate, mutual ADIs will be less impacted by the collective set of changes to regulatory requirements than other parts of the ADI sector. Of course, within the sector, there are differences from ADI to ADI, so I am wary of making sweeping statements. But there is no doubt that mutual ADIs generally start with high capital ratios vis-à-vis many of their larger competitors, and the impact of changes are likely to be felt more acutely elsewhere.

That said – and I wouldn’t be true to my role as a prudential supervisor if I did not sound a note of caution before I conclude – it doesn’t mean the changes won’t be felt at all, or that changes in the competitive landscape will provide a panacea to the strategic challenges that face smaller organisations in a more demanding environment. Long-standing issues of scale, geographic concentration, technological capacity, and more mobile and demanding customers will not be diminished by regulatory changes. The only suggestion I would offer on these today is that the challenges will be more likely to be overcome if, consistent with the mutual ethos that underpins COBA and its members, the mutual sector works cooperatively together to address them.

Concluding remarks

I opened by setting out two necessary – but not sufficient – preconditions for long-term success: sound lending standards and adequate capital.

Lending standards are important for the stability of the Australian banking system, and given the importance of housing-related lending, it should not be surprising that APRA supervisors are increasingly vigilant on the risks this lending presents. Put simply, if all our eggs are increasingly being placed in one basket, we need to make sure the basket isn’t dropped. ADIs that have continued to adopt sensible practices and prudent credit assessments should welcome this approach, as it strengthens their capacity to compete without being reckless. On the other hand, ADIs with more aggressive practices should fully expect to find APRA increasingly at their doorstep.

When it comes to capital, we will have more to say shortly. But my message today is that we will respond to all of the FSI’s recommendations as soon as we can, bearing in mind the need for a coordinated approach that factors in international work that is still in the pipeline. No one disputes the benefits of having an unquestionably strong banking sector, so where it makes sense to move ahead, we will get on with it. ADIs should adopt a similar approach in their capital planning: to the extent further capital accumulation is needed, there is little to be lost from starting early.

1 Seeking Strength in Adversity, AB+F Randstad Leaders Lecture Series, 7 November 2014

2 Reinforcing Sound Residential Mortgage Lending Practices, 9 December 2014

3 APG223, Residential Mortgage Lending, November 2014. See also Financial Stability Board, Sound Residential Mortgage Underwriting Practices, April 2012.

4 Estimated living expenses between the most conservative and the least conservative ADI varied by at least 30 per cent, and in some cases significantly more (depending on the borrower’s characteristics).

APRA Finalises New Disclosure Requirements for ADIs

The Australian Prudential Regulation Authority (APRA) has today released a response to submissions paper and final versions of Prudential Standard APS 110 Capital Adequacy and Prudential Standard APS 330 Public Disclosure, which incorporate new disclosure requirements for a limited number of authorised deposit-taking institutions (ADIs). These standards take effect from 1 July 2015. In most cases, the first set of disclosures will be based on September 2015 reporting dates.

With regard to capital, the Prudential Standard requires an authorised deposit-taking institution (ADI) to maintain adequate capital, on both a Level 1 and Level 2 basis, to act as a buffer against the risk associated with its activities. An ADI must have an Internal Capital Adequacy Assessment Process (ICAAP) that must: (a) be adequately documented, with the documentation made available to APRA on request; and (b) be approved by the Board initially, and when significant changes are made.

An ADI must, on an annual basis, provide a report on the implementation of its ICAAP to APRA (ICAAP report). A copy of the ICAAP report must be provided to APRA no later than three months from the date on which the report has been prepared.

APRA will determine prudential capital requirements (PCRs) for an ADI. The PCRs, expressed as a percentage of total risk-weighted assets, will be set by reference to Common Equity Tier 1 Capital, Tier 1 Capital and Total Capital. PCRs may be determined at Level 1, Level 2 or both.

The minimum PCRs that an ADI must maintain at all times are:

(a) a Common Equity Tier 1 Capital ratio of 4.5 per cent;
(b) a Tier 1 Capital ratio of 6.0 per cent; and
(c) a Total Capital ratio of 8.0 per cent.

APRA may determine higher PCRs for an ADI and may change an ADI’s PCRs at any time.

From 1 January 2016, an ADI must hold a capital conservation buffer above the PCR for Common Equity Tier 1 Capital. The capital conservation buffer is 2.5 per cent of the ADI’s total risk-weighted assets, unless determined otherwise by APRA. The sum of the Common Equity Tier 1 PCR plus the capital conservation buffer determined by APRA will be no less than 7.0 per cent of the ADI’s total risk-weighted assets. Any amount of Common Equity Tier 1 Capital required to meet an ADI’s PCRs for Tier 1 Capital or Total Capital, above the amount required to meet the PCR for Common Equity Tier 1 Capital, is not eligible to be included in the capital conservation buffer.

From 1 January 2016, APRA may require an ADI to hold additional Common Equity Tier 1 Capital, of between zero and 2.5 per cent of total risk-weighted assets, as a countercyclical capital buffer. An ADI with credit exposures in geographic locations outside Australia must calculate any countercyclical capital buffer requirement as the weighted average of the buffers that are applied by the regulatory authorities in jurisdictions in which the ADI has exposures. APRA will inform ADIs of any decision to set, or increase, the level of the countercyclical capital buffer up to 12 months before the date from which it applies. Any decision by APRA to decrease the level of a countercyclical capital buffer will take effect immediately.

An ADI or authorised NOHC (as applicable) must obtain APRA’s written approval prior to making any planned reduction in capital, whether at Level 1 or Level 2.

An ADI or an authorised NOHC (as applicable) must notify APRA, in accordance with section 62A of the Banking Act, of any breach or prospective breach of the capital requirements contained in this Prudential Standard and inform APRA of any remedial actions taken or planned to deal with the breach.


What Does The Fed’s Bank Stress Tests Tell Us?

Last month the results from the latest Dodd-Frank Act Stress Tests were released. Unlike the APRA tests the outcomes of which (other than high-level general comments), are totally secret; the results for individual banks are disclosed, allowing comparisons to be made. In addition, there is real focus on capital ratios, which in Australia according to the Murray report should be lifted here, because currently our banks are supported by an implicit government guarantee.  Looking at the US regime provides insights into how banking supervision works.

By way of background, in the wake of the recent financial crisis, under the DoddFrank Act, the US Federal Reserve is required to conduct an annual stress test of banks with total consolidated assets of $50 billion or more as well as designated nonbank financial companies. The tests are designed to see if these banks have appropriate capital adequacy processes and capital to absorb losses during stressful conditions, whilst meeting obligations to creditors and counterparties and continuing to serve as credit intermediaries.

There are two elements to the tests, first examining a banks capital adequacy, capital adequacy process, and planned capital distributions, such as dividend payments and common stock repurchases – Comprehensive Capital Analysis and Review (CCAR), and second a forward-looking quantitative evaluation of the impact of stressful economic and financial market conditions – Dodd-Frank Act Stress Test (DFAST). The scenarios are not disclosed prior to testing, so to an extent, the banks are not able to dress up their results.

This is the fifth round of stress tests led by the Federal Reserve since 2009 and the third round required by the Dodd-Frank Act. The 31 firms tested represent more than 80 percent of domestic banking assets. The Federal Reserve uses its own independent projections of losses and incomes for each firm.

Moreover, the banks have to pass the tests in order to pay out rewards to its investors, so it is much more than a mathematical academic exercise. The Fed is more and more focussing on the culture of the organisations and some banks failed the qualitative assessment. As the testing has evolved, this activity has become more are more part of normal supervisory activities, rather than a once a year proof.

Overall, the Fed’s judgment is that American banks carry enough cash and have strong enough internal risk management systems to weather a severe economic downturn. 28 of 31 financial institutions tested had adequately balanced capital and risk in hypothetical downturn, allowing them to return cash to shareholders as planned.

We look at the work in more detail.

The Scenario Modelling, (DFAST).

The Federal Reserve’s projections of revenue, expenses, and various types of losses and provisions that flow into pre-tax net income are based on data provided by the 31 banks participating in the test and on models developed or selected by Federal Reserve staff and reviewed by an independent group of Federal Reserve economists and analysts. The models are intended to capture how the balance sheet, RWAs, and net income of each BHC are affected by the macroeconomic and financial conditions described in the supervisory scenarios, given the characteristics of the banks loans and securities portfolios; trading, private equity, and counterparty exposures from derivatives; business activities; and other relevant factors.

The adverse and severely adverse supervisory scenarios used this year feature U.S. and global recessions. In particular, the severely adverse scenario is characterized by a substantial global weakening in economic activity, including a severe recession in the United States, large reductions in asset prices, significant widening of corporate bond spreads, and a sharp increase in equity market volatility. The adverse scenario is characterized by a global weakening in economic activity and an increase in U.S. inflationary pressures that, overall, result in a rapid increase in both short- and long-term U.S. Treasury rates.

The Severely Adverse Scenario

The severely adverse scenario for the United States is characterized by a deep and prolonged recession in which the unemployment rate increases by 4 percentage points from its level in the third quarter of 2014, peaking at 10 percent in the middle of 2016. By the end of 2015, the level of real GDP is approximately 4.5 percent lower than its level in the third quarter of 2014; it begins to recover thereafter. Despite this decline in real activity, higher oil prices cause the annualized rate of change in the Consumer Price Index (CPI) to reach 4.3 percent in the near term, before subsequently falling back. In response to this economic contraction—and despite the higher near-term path of CPI inflation, short-term interest rates remain near zero through 2017; long-term Treasury yields drop to 1 percent in the fourth quarter of 2014 and then edge up slowly over the remainder of the scenario period.  Consistent with these developments, asset prices contract sharply in the scenario. Driven by an assumed decline in U.S. corporate credit quality, spreads on investment-grade corporate bonds jump from about 170 basis points to 500 basis points at their peak.

Equity prices fall approximately 60 percent from the third quarter of 2014 through the fourth quarter of 2015, and equity market volatility increases sharply. House prices decline approximately 25 percent during the scenario period relative to their level in the third quarter of 2014.

The international component of the severely adverse scenario features severe recessions in the euro area, the United Kingdom, and Japan, and below-trend growth in developing Asia. For economies that are heavily dependent on imported oil—including developing Asia, Japan, and the euro area—this economic weakness is exacerbated by the rise in oil prices featured in this scenario. Reflecting flight-to-safety capital flows associated with the scenario’s global recession, the U.S. dollar is assumed to appreciate strongly against the euro and the currencies of developing Asia and to appreciate more modestly against the pound sterling. The dollar is assumed to depreciate modestly against the yen, also reflecting flight-tosafety capital flows.

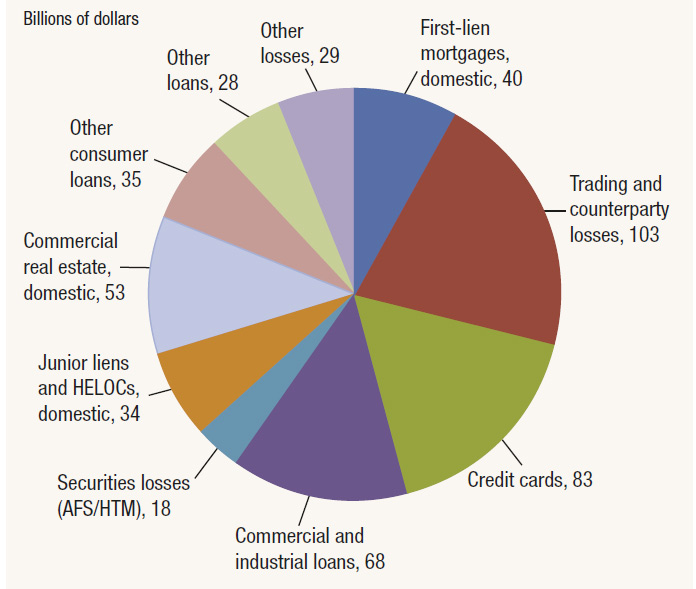
In this severely adverse scenario, Over the nine quarters of the planning horizon, losses at the 31 BHCs under the severely adverse scenario are projected to be $490 billion.

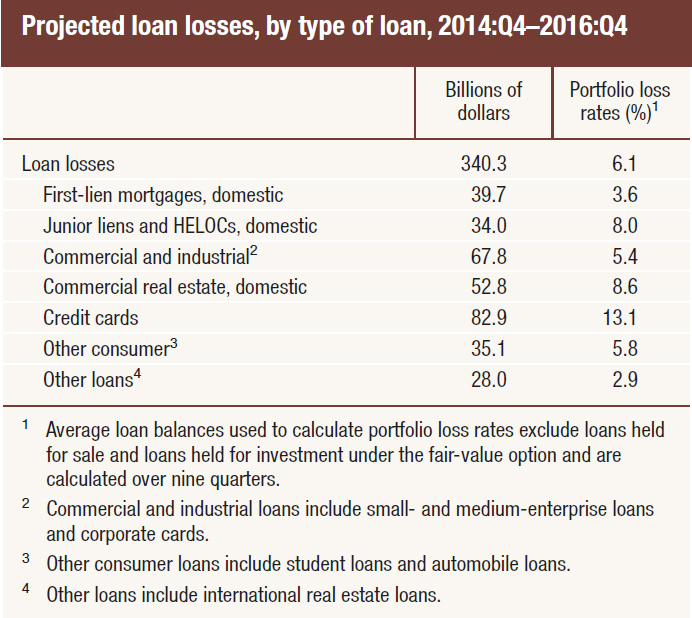
LossesByLoanTypeDoddThis includes losses across loan portfolios, losses from credit impairment on securities held in the BHCs’ investment portfolios, trading and counterparty credit losses from a global market shock, and other losses.  SevereLossesDoddProjected net revenue before provisions for loan and lease losses (pre-provision net revenue, or PPNR) is $310 billion, and net income before taxes is projected to be –$222 billion.  There are significant differences across banks in the projected loan loss rates for similar types of loans. For example, while the median projected loss rate on domestic first-lien residential mortgages is 3.5 percent, the rates among banks with first-lien mortgage portfolios vary from a low of 0.9 percent to a high of 12.5 percent. Similarly, for commercial and industrial loans, the range of projected loss rates is from 3.0 percent to 14.0 percent, with a median of 4.8 percent. Differences in projected loss rates across BHCs primarily reflect differences in loan and borrower characteristics.

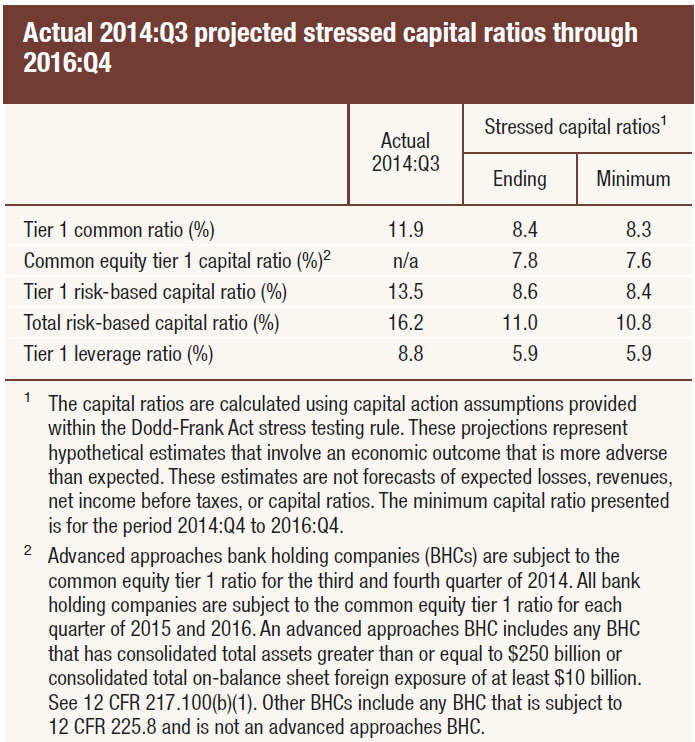
The aggregate tier 1 common capital ratio would fall from an actual 11.9 percent in the third quarter of 2014 to a post-stress level of 8.4 percent in the fourth quarter of 2016.

CapitalRatiosDoddThe Adverse Scenario

In the adverse scenario, the United States experiences a mild recession that begins in the fourth quarter of 2014 and lasts through the second quarter of 2015. During this period, the level of real GDP falls approximately 0.5 percent relative to its level in the third quarter of 2014, and the unemployment rate increases to just over 7 percent. At the same time, the U.S. economy experiences a considerable rise in core inflation that results in a headline CPI inflation rate of 4 percent by the third quarter of 2015; headline inflation remains elevated thereafter. Short-term interest rates rise quickly as a result, reaching a little over 2.5 percent by the end of 2015 and 5.3 percent by the end of 2017. Longer-term Treasury yields increase by less. The recovery that begins in the second half of 2015 is quite sluggish, and the unemployment rate continues to increase, reaching 8 percent in the fourth quarter of 2016, and flattens thereafter. Equity prices fall both during and after the recession and by the end of the scenario are about 25 percent lower than in the third quarter of 2014. House prices and commercial real estate prices decline by approximately 13 and 16 percent, respectively, relative to their level in the third quarter of 2014.

In the adverse scenario, projected losses, PPNR, and net income before taxes are $314 billion, $501 billion, and $178 billion, respectively. The accrual loan portfolio is the largest source of losses in the adverse scenario, accounting for $235 billion of projected losses for the 31 BHCs. The lower peak unemployment rate and more moderate residential and commercial real estate price declines in the adverse scenario result in lower projected accrual loan losses on consumer and real estate-related loans. The ninequarter loan loss rate of 4.1 percent is below the peak industry-level rate reached during the recent financial crisis but still higher than the rate during any other period since the Great Depression of the 1930s. As in the severely adverse scenario results, there is considerable diversity across firms in projected loan loss rates, both in the aggregate and by loan type. The aggregate tier 1 common capital ratio under the adverse scenario would fall 110 basis points to its minimum over the planning horizon of 10.8 percent before rising to 11.7 percent in the fourth quarter of 2016.

Standing back, a few observations are worth thinking about, courtesy of the The Harvard Law School Forum on Corporate Governance and Financial Regulation.

1. More post-stress capital exists today than did pre-stress capital during the financial crisis: The 31 banks’ post-stress Tier 1 Common ratio (T1C) average 8.2% under the severely adverse scenario, which is higher than the same banks’ pre-stress T1C average of 5.5% at the beginning of 2009. Average pre-stress T1C is also up again this year from last year (11.9% versus 11.5%) as is post-stress T1C (8.2% versus 7.6%).

2. Industry capital ratios improve faster overall than at the largest banks: The six largest banks accounted for about half of the total increase in industry Tier 1 common equity. However, these institutions make up 70% of industry-wide RWA, demonstrating that the other 25 banks are disproportionately accounting for the increase in industry-wide capital.

3. Leverage ratio appears binding for many of the largest banks: The leverage ratio is the binding constraint for many large banks as they remain close to the 4% minimum. The leverage ratio is particularly punitive for banks with significant capital markets activities. However, as the proposed G-SIB capital surcharge comes into play, these banks will further increase their common equity, lessening the impact of the leverage ratio in the future.

4. Fed models seem to be maturing and becoming more predictable: For the first time, the Fed disclosed the degree to which its stress models have changed, indicating that there were only incremental changes to most models. This model stability (and the fact that the Fed’s economic scenarios have been held fairly constant over time) should allow banks to better anticipate the Fed’s projected capital losses in the future. Banks can integrate this information into their future capital distribution plans in order to maximize their distributions to shareholder without having to raise regulatory flags by taking the mulligan.

5. Loan loss rates improve due to fewer legacy problem portfolios and improved underwriting standards: Total loan loss rates continued their march downward, reaching 6.1% under the severely adverse scenario (down from 6.9% in 2014 and 7.5% in 2013). This decline is driven by improvements in first lien loans, junior liens, and credit cards, as legacy problem portfolios are being removed from balance sheets and improved underwriting standards are taking hold (as alluded to above, Fed models and scenarios in these areas have remained stable). First lien and junior lien loss rate declines are particularly impactful, with decreases of 2.1 and 1.6 percentage points respectively. Commercial and industrial loan loss rates remained stable from last year, but were generally higher for banks with significant leveraged lending businesses (which the Fed has been expressing concern about in recent years).

6. Banks overall are positioned well under the adverse scenario’s rising interest rate environment: Firms have generally prepared for the prospect of rising rates, as reflected in the adverse scenario results that show 27 of the 31 firms posting a pre-tax profit over the nine quarters. The average T1C falls only 110 bps from start to minimum, and 80 bps of that erosion is recouped by the end of the nine quarters through an increase in PPNR for these banks, largely due to asset-sensitive balance sheets more than offsetting unrealized AFS losses over time.

7. Minimum capital ratios look worse than reality: A few banks that heavily trade in the capital markets have post-stress minimum capital ratios close to the 8% requirement. However, we do not believe these banks will be as constrained in their capital distributions as it may appear. The trough in their ratios comes very early in the nine-quarter stress horizon, due to the market shock component which disproportionately impacts these firms, but rises in subsequent quarters.

8. DFAST (and CCAR) will likely be tougher in the future: The Fed indicated late last year that it may add all or a portion of the proposed G-SIB capital surcharge to post-stress capital ratios. Although we would not expect a proposed rule in this regard until at earliest the second half of this year, it is possible that such a rule could be finalized in time for DFAST 2016 given that stress testing deadlines will occur three months later. Timing aside, in our view the G-SIB capital surcharge will ultimately factor into stress testing. At a minimum for 2016, Fed expectations will be higher as a result of the extra three months for banks to prepare.

The Comprehensive Capital Analysis and Review (CCAR)

In November 2011, the Federal Reserve issued the capital plan rule and began requiring Bank Holding Companies (BHCs) with consolidated assets of $50 billion or more to submit annual capital plans to the Federal Reserve for review. For the CCAR 2015 exercise, the Federal Reserve issued instructions on October 17, 2014, and received capital plans from 31 BHCs on January 5, 2015. The capital plan rule specifies four mandatory elements of a capital plan:

  1. an assessment of the expected uses and sources of capital over the planning horizon that reflects the BHC’s size, complexity, risk profile, and scope of operations, assuming both expected and stressful conditions, including estimates of projected revenues, losses,reserves, and pro forma capital levels and capital ratios (including the minimum regulatory capital ratios and the tier 1 common ratio) over the planning horizon under baseline conditions, supervisory stress scenarios,and at least one stress scenario developed by the BHC appropriate to its business model and portfolios;. a discussion of how the company will maintain all minimum regulatory capital ratios and a pro forma tier 1 common ratio above 5 percent under expected conditions and the stressed scenarios; a discussion of the results of the stress tests required by law or regulation, and an explanation of how the capital plan takes these results into account; and a description of all planned capital actions over the planning horizon;
  2. a detailed description of the BHC’s process for assessing capital adequacy;
  3. the BHC’s capital policy; and
  4. a discussion of any baseline changes to the BHC’s business plan that are likely to have a material impact on the BHC’s capital adequacyor liquidity.

When the Federal Reserve objects to a BHC’s capital plan, the BHC may not make any capital distribution unless the Federal Reserve indicates in writing that it does not object to the distribution.

CCAR differs from DFAST by incorporating the 31 participating bank holding companies’ (“BHC” or “bank”) proposed capital actions and the Fed’s qualitative assessment of BHCs’ capital planning processes. When the CCAR was subsequently released, some banks came close to failing the tests. The Fed objected to two foreign BHCs’ capital plans and one US BHC received a “conditional non-objection,” all due to qualitative issues. Bank of America received the only sanction among U.S. firms and the bank is to resubmit its capital plan due to weaknesses in its modeling practices and internal controls. Bank of America’s conditional failure means it will have to shelve plans to increase dividends and issue stock buybacks until the Fed reviews its updated submission in six months. Santander and Deutsche Bank will also have to put investor payouts on hold. It was widely expected that the two banks would trip up on the stress tests, which have proven difficult for foreign-based banks. Santander failed its first test last year, while this was Deutsche Bank’s first attempt.

Looking at the CCAR, here are some further key points:

1. Capital planning process enhancements pay off: The fact that only two plans were rejected indicates that BHCs’ investments in quality processes have been worthwhile, most recently at Citi. Banks now have more room to make the CCAR exercise more sustainable by reducing costs and integrating with financial planning for better strategic decision making.

2. No amount of capital can make up for deficient processes: In objecting to the capital plans, the Fed cited foundational risk management issues such as risk identification and modeling quality. The press leak of this year’s rejections could have been an intentional effort to avoid an overreaction to last week’s positive quantitative-only DFAST results (avoiding confusion from prior years).

3. Return of the “conditional non-objection”: The Fed reintroduced the conditional non-objection in CCAR 2015 for one US BHC, Bank of America, after a one-year hiatus. Under this qualified pass, the Fed is requiring the bank to fix issues related to its loss and revenue modeling and internal controls, and to resubmit its capital plan by the end of the third quarter of 2015. Although matters requiring immediate attention (“MRIAs”) generally must be remediated within one CCAR cycle, conditional passes seem to operate as super-MRIAs by giving the Fed teeth to require remediation within six months (which may be particularly important this year, given the three month extended CCAR cycle for 2016). However, BHCs receiving this pass have ultimately been able to follow through on their proposed capital distributions, so the return of the conditional pass may be more of a broad message from the Fed: even though all US BHCs passed this year, their CCAR processes must continue to improve.

4. Large banks see little downside to taking the mulligan, so are being more aggressive with planned capital actions: Three of the largest US BHCs exercised the option to adjust their planned capital distributions downward, after receiving last week’s DFAST results indicating their initial plans distributed too much capital. The use of this “mulligan” continues to be limited to the largest institutions with the most sophisticated capital planning processes, and is increasingly being taken as they attempt to pay out more to shareholders. However, the Fed may look unfavorably on this development if viewed as a sign of weak capital planning capabilities (and may rethink stress testing guidelines in the future).

5. Fed and BHC loan loss modeling differences are converging, but the gap remains wide: Continuing the previous two years’ trend, the gap between Fed and BHC loan loss rate projections has again shrank this year—by about 30% across loan-types driven mostly by residential loan loss projections. This convergence will likely help management better align its proposed capital actions with the Fed’s views and more precisely assess the risk of taking the mulligan. However, the gap remains wide, at over 140 basis points across loan categories, including about 440 basis points for CRE loans. While the Fed’s projected loan loss rates have been declining rapidly under the severely adverse scenario (reaching a 6.1% average this year, down from 6.9% in 2014 and 7.5% in 2013), BHCs’ projections have been declining more slowly.

6. Fed asset growth projections continue to exert downward pressure on stressed Tier 1 common ratios: CCAR 2014 marked the first time that the Fed projected banks’ growth in risk-weighted assets, which significantly reduced stressed Tier 1 common ratios. This year Fed projections again exceed BHC projections, this time by about 10% under Basel I (versus about 12% last year) under the severely adverse scenario. As a result, banks’ stressed Tier 1 common ratios are about 90 basis points lower on average than they would have been under the Fed’s 2013 approach.

7. Caution signs line the road ahead for new CCAR entrants: As part of last year’s CCAR, the Fed noted that the 12 then-new CCAR entrants would not be held to the same high standards applicable to the largest BHCs. This year, in contrast, the Fed made clear that this grading curve does not apply to new entrants that are supervised by the Fed’s Large Institution Supervision Coordinating Committee (“LISCC”). Therefore, large intermediate holding companies and certain nonbanks deemed systemically important should take notice that the Fed’s heightened standard for LISCC firms will likely apply to them when they enter CCAR down the road.

8. Proving comprehensive risk identification will be one of the biggest challenges for CCAR 2016: A new expectation for 2015 required banks to prove (rather than simply describe) the comprehensiveness of their risk identification process and its linkage to capital planning and scenario generation. Given the experienced challenges in doing so this year, expect this area to be an important Fed focus for CCAR 2016.

9. Binding constraints on capital will evolve: The Tier 1 leverage ratio continues to be a binding constraint, especially among the BHCs with the largest capital markets businesses. However, as the proposed G-SIB capital surcharge is implemented, these banks will further increase their common equity which will lessen the impact of the leverage ratio. The binding constraint will remain a moving target as banks seek to optimize their capital holdings given the phase-in of the G-SIB capital surcharge (along with expected short-term funding capital penalties and long-term debt requirements) and the upcoming implementation of the supplementary leverage ratio (“SLR”).

10. CCAR is bigger than stress testing: The Fed explicitly stated this year that outstanding supervisory issues, beyond capital planning, may result in a qualitative objection to a BHC’s capital plan. This statement clarifies that matters outside of capital planning, such as regulatory reporting (beyond the FR Y-14 and FR Y-9C series), enterprise risk management, and governance may lead to the Fed halting additional capital distributions to shareholders.

A Quick Look At Individual Banks

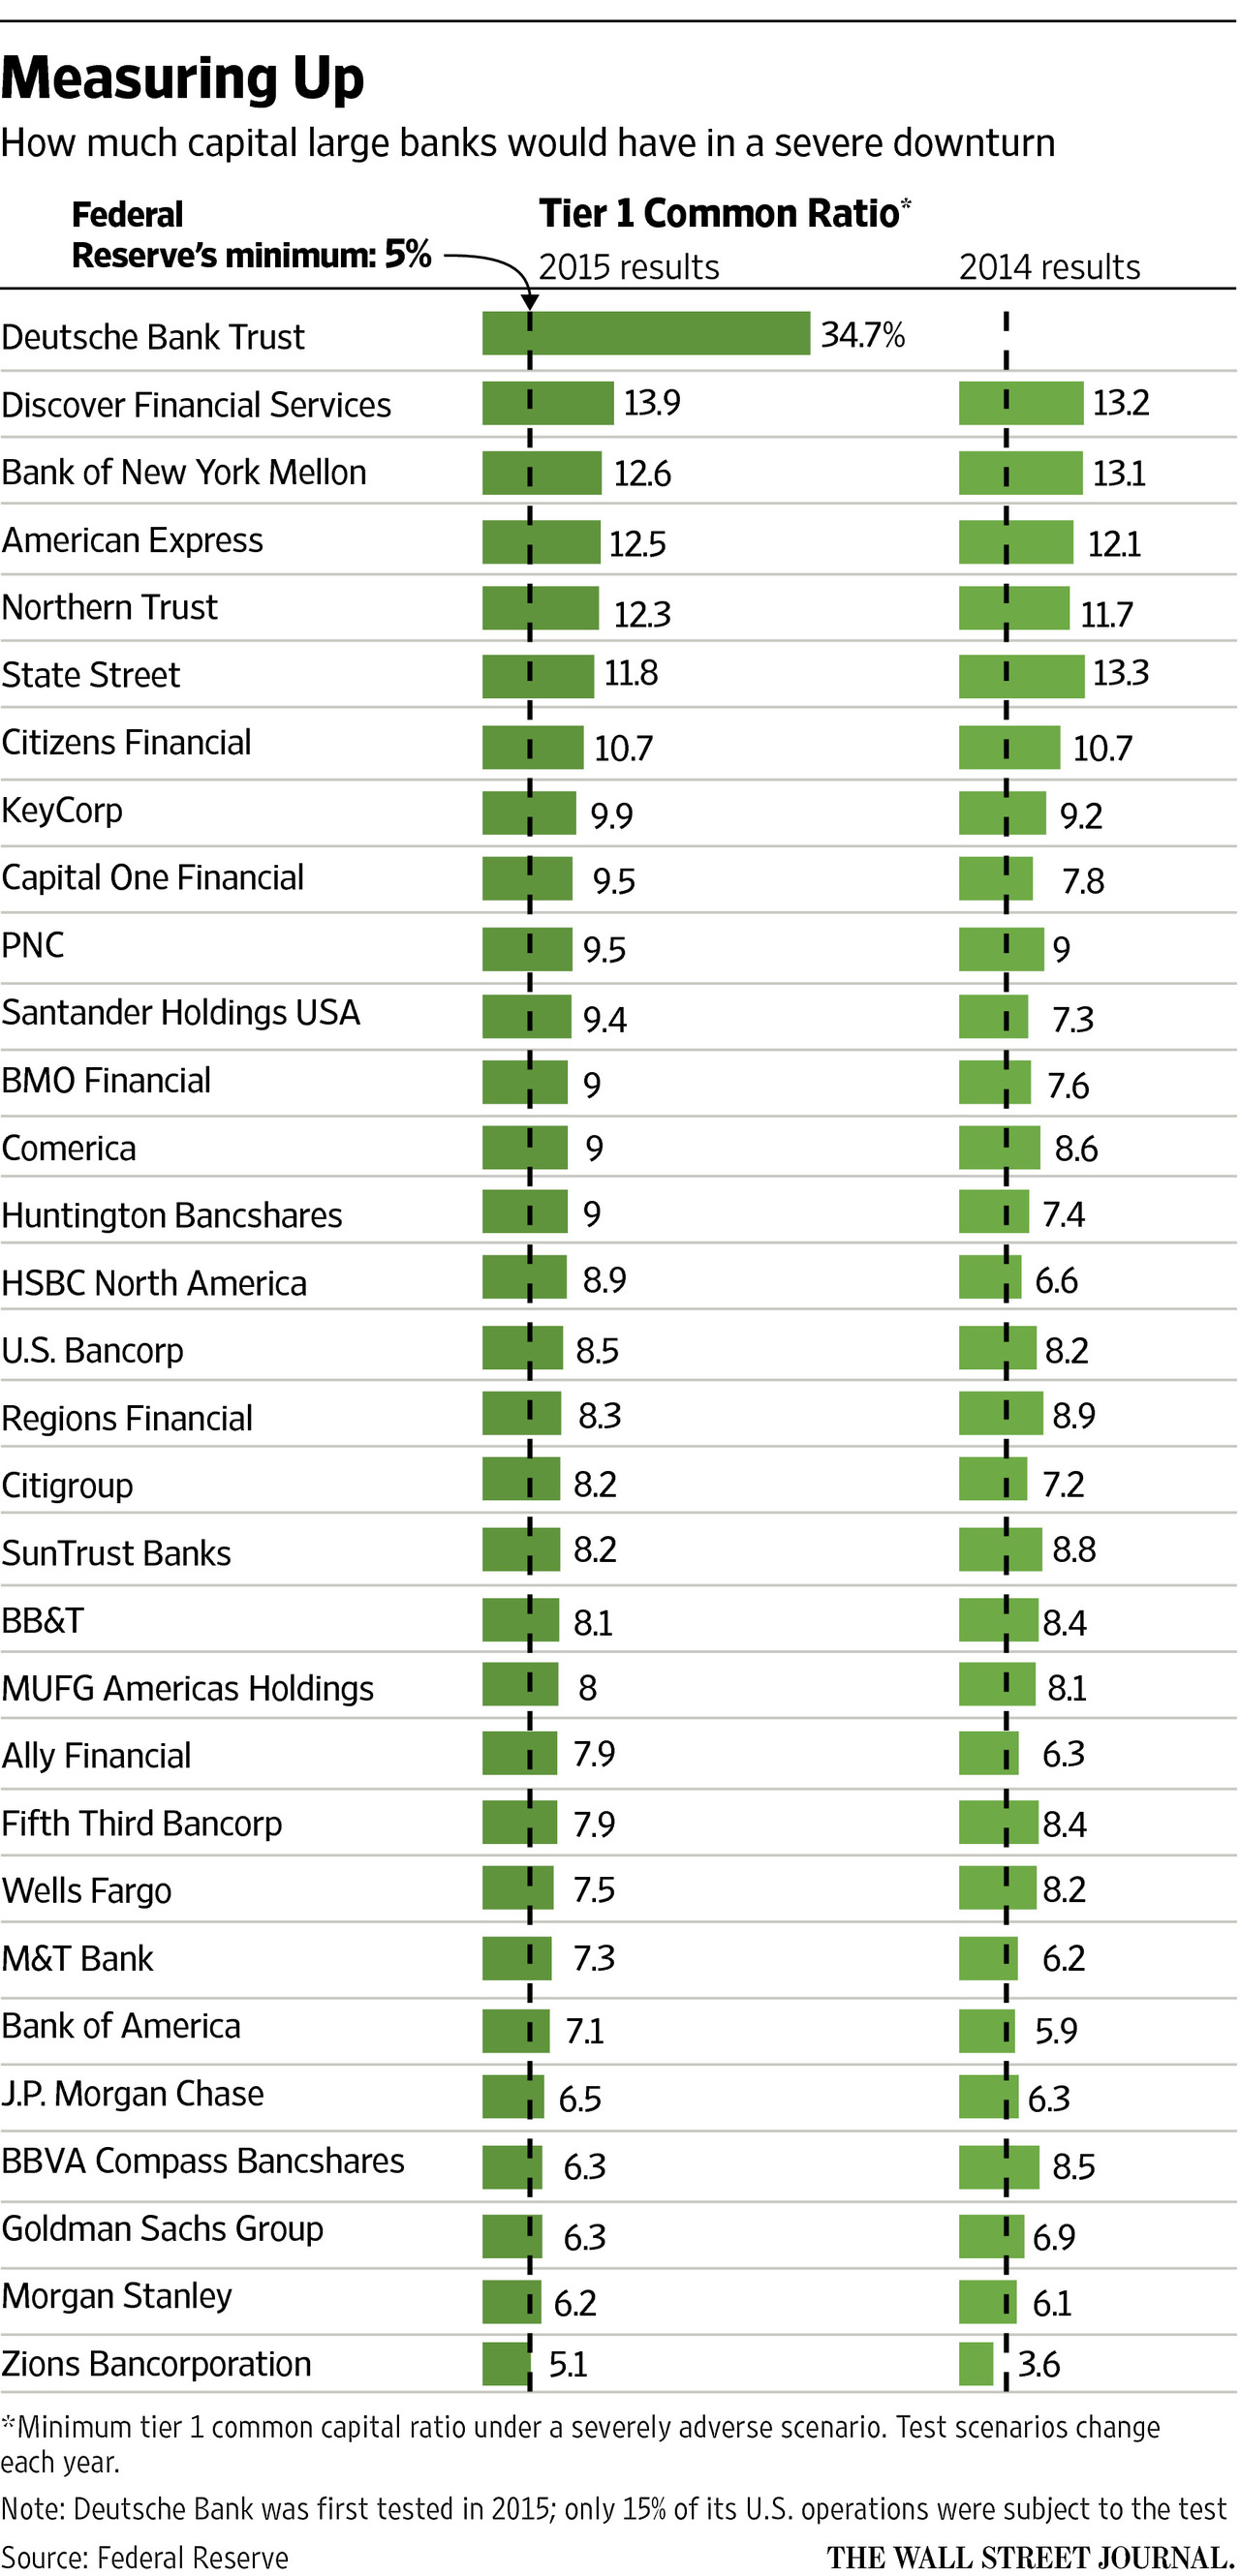
The individual bank data is interesting.  You can read the details in the reports via the links above. However, here is the list of players assessed, sorted by the minimum tier 1 common ratio under the severely adverse scenario, which the WSJ reproduced from the report. Note the 5% hurdle rate which is becoming a critical lens to assess the true position of the banks, rather than the complexity of internal models.

DoddGoing Forward

The Federal Reserve evaluates planned capital actions for the full nine-quarter planning horizon to better understand each BHC’s longer-term capital management strategy and to assess post-stress capital levels over the full planning horizon.  While the nine-quarter planning horizon reflected in the 2015 capital plans extends through the end of 2016, the Federal Reserve’s decision to object or not object to BHCs’ planned capital actions is carried out annually and typically applies only to the four quarters following the disclosure of results. However, starting in 2016, the stress testing and capital planning schedules will begin in January of a given year, rather than October, resulting in a transition quarter before the next CCAR exercise. As a result, the Federal Reserve’s decisions with regard to planned capital distributions in CCAR 2015 will span five quarters and apply from the beginning of the second quarter of 2015 through the end of the second quarter of 2016.

It seems to me that Australia really needs to step up its focus on capital regulation, and simply waiting for the next Basel dictates will not cut the mustard. I think we need a massive lift in disclosure here, and the Dodd-Frank model points a potential path.

Perspectives On Capital

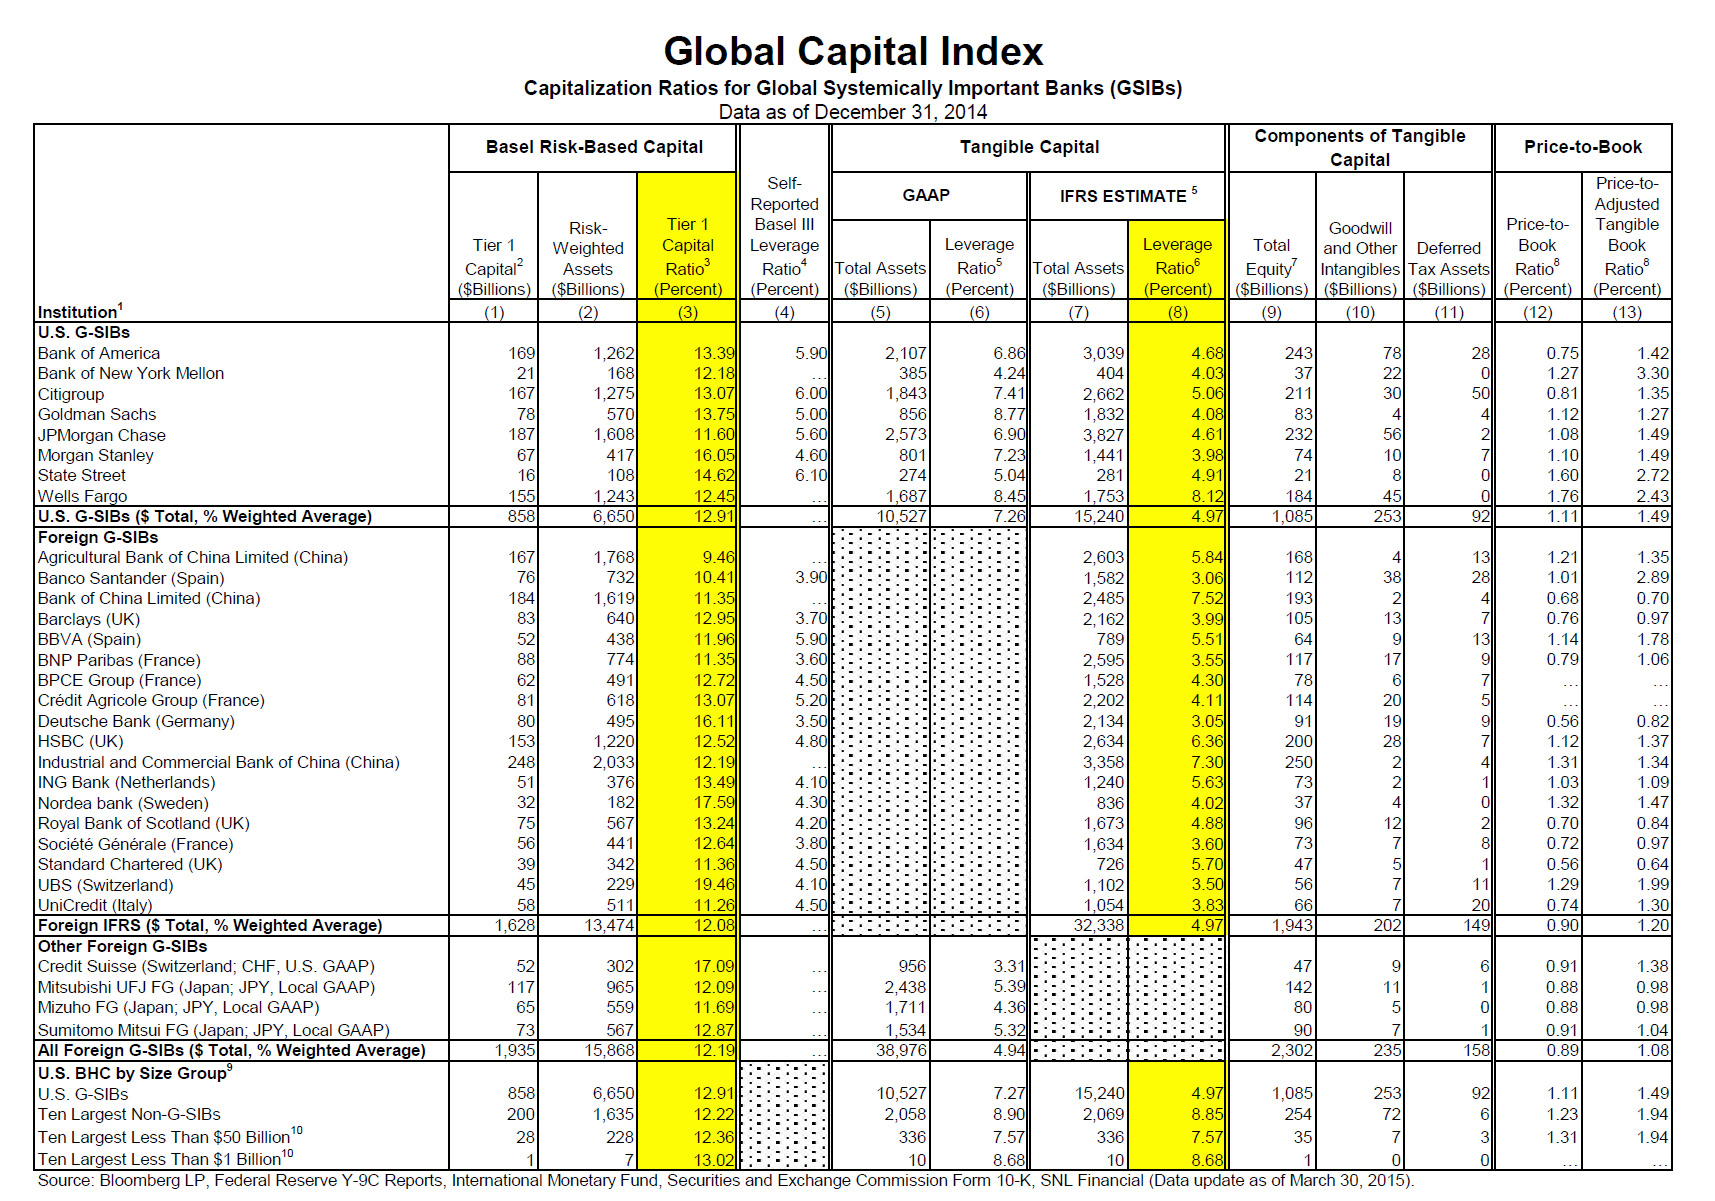
The question of how much capital should a bank hold is running hot these days. To illustrate the point, lets look at the commentary surrounding the the semi-annual update of the Global Capital Index, which show the capital ratios for Global Systemically Important Banks, and which was released in early April by FDIC Vice Chairman Hoenig. The Federal Deposit Insurance Corporation (FDIC) preserves and promotes public confidence in the U.S. financial system by insuring depositors for at least $250,000 per insured bank; by identifying, monitoring and addressing risks to the deposit insurance funds; and by limiting the effect on the economy and the financial system when a bank or thrift institution fails. So what they say in significant.

Among the data in the report:

  • For the largest U.S. banking firms, the average tangible equity capital ratio – known inversely as the leverage ratio – is 4.97 percent. In other words, each dollar of assets is funded with 95 cents of borrowed money.
  • The largest regional and community banks, have tangible capital ratios ranging from 7.57 to 8.85 percent.  That is, they operate with between 1.5 and 1.7 times more funding from their ownership than G-SIBs do.

“The Global Capital Index illustrates how financial resiliency is still sorely lacking,” Vice Chairman Hoenig said. “The sector of the financial industry with the greatest concentration of assets is the least well capitalized. Plainly put, it operates with the largest amount of borrowed, or as we say, leveraged funding, and thus it is the least well prepared to absorb loss. Yet the primary measure of capital – the risk weighted measure — makes the largest firms appear relatively more stable than they really are. The reality is that with too little owner equity funding individual firms, the industry as a whole also is undercapitalized and should one firm fail, the industry continues to be vulnerable to contagion and systemic crisis. It follows that the lack of adequate tangible capital remains among the greatest impediments to successful bankruptcy and resolution.”

The Global Capital Index uses estimates of International Financial Reporting Standards (IFRS) to measure a firm’s tangible equity (loss-absorbing capital) against on- and off-balance sheet assets, as shown in column 8 of the table. The tangible capital measurement includes derivatives and other assets that are off-balance-sheet in US Generally Accepted Accounting Principles (GAAP) and Basel calculations. It is calculated by comparing equity capital to total assets, deducting goodwill, other intangibles, and deferred tax assets from both equity and total assets.

The tangible leverage ratio measures funds available to absorb loss against total balance sheet and some off-balance sheet assets. It does not attempt to predict or assign relative risk weights among asset classes. “It is more difficult to game, and it provides the most clear and complete picture of a banking firm’s ability to absorb loss regardless of source,” Vice Chairman Hoenig said.

In contrast, the ratios of Tier I capital to risk-weighted assets for all banks, largest to smallest, are above 10 percent and some of the largest have ratios of more than 15 percent. “This higher capital ratio is achieved by reducing on-balance sheet assets by a pre-assigned risk weight and excluding off-balance sheet assets, such as derivatives. This measure is misleading and overstates the strength of these firms’ balance sheets. No other industry is allowed to make these kinds of adjustments,” Vice Chairman Hoenig said. “The tangible leverage ratio provides a more accurate measure of assets and risks than the balance sheet reported under either GAAP or Basel.”

Global-Capitall-Index


NZ Reserve Bank Consulting On Property Investor Loans

The Reserve Bank of New Zealand is consulting on a new asset class treatment for mortgage loans to residential property investors within its capital adequacy requirements. They propose to separate investment and owner occupied loans from a capital perspective, (once loan types are defined), and apply different capital treatments, requiring more capital for investment loans, reflecting potential higher risk. This would be applied to both standards and advanced IRB banks, and they would allow a period of transition to the new arrangements, commencing 1 July 2015. The net impact would be to increase the capital costs to lenders of making investment mortgages, and potentially slowing momentum in this sector. RBA please note!

The Reserve Bank’s analysis shows that residential property investor loans are a sufficiently distinct category of loans and that by grouping them with other residential mortgage loans one is not in a position adequately to measure their risk as a separate group of loans. This can have negative consequences for a bank’s awareness of the proper risk associated with those loans and lead to insufficient levels of capital being allocated to them. The Reserve Bank therefore proposes that all locally incorporated banks hold residential property investment loans in a separate asset or sub-asset class. In addition, a primary purpose of the consultation is to seek views on how to best define a property investment loan.

Consultation closes on 7 April and once the Reserve Bank has settled upon a definition, it proposes to amend existing rules by requiring all locally incorporated banks to include residential property investment mortgage loans in a specific asset sub-class, and hold appropriate regulatory capital for those loans.

Reserve Bank Head of Prudential Supervision Toby Fiennes said: “International evidence suggests that default rates and loss rates experienced during sharp housing market downturns tend to be higher for residential property investment loans than for loans to owner occupiers.

“The proposal would bring the Reserve Bank’s framework more into line with the international Basel standards for bank capital. The proposed rule amendment is designed to ensure that banks hold adequate capital for the risks that they face from investment property lending.”

The Reserve Bank has previously consulted on a possible definition that would have seen loans to borrowers with five or more residential properties classified as loans to residential property investors. Partly as a result of submissions received, the Bank has reconsidered the definition, and is now consulting on three possible alternative ways to define loans to residential property investors:

  • if the mortgaged property is not owner-occupied; or
  • if servicing of the mortgage loan is primarily reliant on rental income; or
  • if servicing of the mortgage loan is at all reliant on rental income.

The proposed new rule would apply to all locally incorporated banks.

While the current proposal is not a macro-prudential policy proposal, creating consistent asset class groupings to be used by all banks would help the Reserve Bank to implement targeted macro-prudential policies in the future, should that become necessary.

Looking at the proposals in more detail:

They propose that residential property lending should be grouped in a separate asset class because the risk profile of these loans is observably different from owner-occupier mortgage loans, particularly in a severe downturn. The capital requirements that apply to IRB banks require long run PDs to be estimated on the basis of data that includes a severe downturn or, where that is not possible, to include an appropriate degree of additional conservatism.

Fortunately in New Zealand, we have not had a severe housing downturn in recent decades. But this also means that we do not have information on the difference in terms to default rates between residential property investors and owner-occupiers in such a scenario.

Based on the information available from other countries that have had a severe housing downturn, there is evidence to suggest that property investor loans are more strongly correlated with systemic risk factors than owner-occupier loans. This would point to a higher correlation factor in the Basel capital equation than the one that is currently used for all residential property loans. Moreover, although minimum downturn LGDs are prescribed within BS2B, they are effectively calibrated to owner-occupiers. It is therefore likely that the estimated risk weights that banks currently use for residential investor loans are too low and do not adequately reflect the risk that these loans represent.

The higher risk associated with residential property investment loans does not only apply to IRB banks. A residential property investment loan made by a bank operating on the standardised approach is equally a higher risk loan compared to a loan to an owner-occupier. The Basel approach seems to deal with this by recommending higher average risk weights for all residential property loans under the standardised approach.

In New Zealand, this has been implemented by allocating risk weights to residential mortgage loans that range from 35 to 100 percent, depending on a loan’s LVR and the availability of lender’s mortgage insurance.5 However, housing loans are a crucial area for maintaining financial stability in New Zealand and these risk weights do not adequately capture the higher risk associated with residential property investment loans.

The Reserve Bank believes that in this area, there are good reasons why a consistent conceptual approach across standardised and IRB banks makes sense. In addition, the Reserve Bank has a suite of macro-prudential tools available to help address financial stability concerns in certain circumstances. Having the same asset class groupings across all banks would help the Reserve Bank to implement targeted macro-prudential policies if that becomes necessary. Contrary to previous consultation papers on this subject therefore, the Reserve Bank now proposes to include a new asset class for residential property investors within the standardised approach, i.e. BS2A. This new asset class would also have separate, prescribed, risk weights from those that apply to non-residential property investment loans.

It is necessary to define what constitutes an investment loan. The first and in some ways simplest option would be to restrict the current retail residential mortgage asset class to owner-occupiers only. Any mortgage on a residential property that is not owner-occupied would be classified as a residential property investment loan and grouped in a new asset class.

Banks would have to verify the use of a property under this option. This information is already being collected at loan origination to some degree. Possible ways of identifying whether a property is owner-occupied or not include checking the borrower’s residential address and
whether the property generates any rental income. Other possible indicators could include eligibility for tax deductibility of the mortgage servicing costs on the property. The Reserve Bank appreciates that there could be cases where a borrower has more than one owner-occupied residential property and splits his or her time between those addresses. An example could be if a borrower uses one address during the week for work purposes and another on the weekends when he or she is with the family. Another case might be a bach that is not permanently occupied but also does not generate any rental income. The information the Reserve Bank collects from banks on new commitments already distinguishes between owner-occupiers and residential property investors while allowing for owner-occupiers to occupy more than one residential address. The same or a very similar definition could be used to distinguish between second and more properties that are still owner-occupied and properties that are used as residential properties, subject to considering adequate safeguards to ensure that this is not used as an avoidance mechanism.

The Reserve Bank also appreciates that there could be challenges for banks to monitor how a property is being used. A second flat that is used as a second residence by the owner-occupier when the loan is taken out could at some point be let out. While the Reserve Bank does not expect banks to regularly seek confirmation form borrowers as to the use of a property, it is expected that reasonable steps are taken to maintain up to date information. This could mean updating important information when there is a credit event.

An alternative option would be to use mortgage servicing costs as an indicator. If mortgage servicing are predominantly reliant on the rental income the property generates, then that loan should be classified as a residential property investment loan. Predominantly was defined as more than fifty percent. In other words, if a borrower’s other sources of income minus the bank’s usual allowances for living expenses, other loan servicing obligations and so on are sufficient to cover more than fifty percent of the loan servicing obligation of the residential property, that is interest as well as repayment of principal, then the loan continues to be classified as a residential mortgage loan in the retail asset class. This test would only apply to investment properties. Owner-occupied properties would be exempt from this requirement and continue to be classified as residential mortgage loans. There is, however, a question as to the point at which the reliance on the property’s rental income separates that loan from loans to owner-occupiers. The Reserve Bank has previously consulted on a threshold of 50 percent. But this still leaves plenty of scope for borrowers to acquire a small portfolio of investment properties without those mortgages being classified as residential property investment loans. A stricter definition would be to make it dependent on any rental income.

Irrespective of which definition and asset class treatment is decided on, banks are likely to require some time to implement the new requirements. For example, banks will have to assess which of their existing exposures are caught by the residential property investment loan definition, make changes to their information capture and IT systems and retrain staff. This will take some time. The Reserve Bank is therefore currently minded to phase the new requirement in over a period of nine months.

IRB banks may also have to develop new models for their residential property investment loan portfolio, although that is not necessarily the case and existing PD models would form a good basis on which to build residential property investor specific models. IRB banks, however, would have to amend their capital engines for residential investor loans to use the proposed LGDs and correlation factors.

It is proposed that IRB banks operate under the same risk weight requirements as standardised banks until their new models have been approved by the Reserve Bank. Furthermore, it is proposed that the new asset classification for residential property investors takes effect from 01 July 2015.

They are also proposing changes to capital requirements for reverse mortgages. Managing a portfolio of reverse mortgages requires long term assumptions to be made concerning a number of factors. If those assumptions turn out to be wrong, the risk to a lender could be significantly affected. For example, advances in geriatric healthcare might mean that people stay longer in their houses than currently anticipated. That could increase the risk of incurring a loss on a portfolio of reverse mortgages due to compound interest, the possibility of the borrower being granted further top ups and the difficulty of predicted house prices years and decades ahead.

While arrangements whereby the reverse mortgage has to be repaid after a certain period of time or stay below a set LVR are theoretically possible, they are not the norm and would most likely be to the disadvantage of the borrower, and thus undermine the attractiveness of a reverse mortgage.

To emphasise, one way in which the risk profile of a reverse mortgages differs from a normal mortgage is in the time dimension. Whereas a normal mortgage loan decreases over time, the opposite is the case for a reverse mortgage.

Finally, the Reserve Bank considers it more appropriate group credit card and revolving retail loans in the “other retail category and to remove QRRE as an option from its capital requirements for IRB banks. This would improve clarity within BS2B while having no direct impact on banks since no bank has been given approval to use the QRRE option.

Basel II framework for IRB banks introduced the concept of a ‘Qualifying Revolving Retail Exposure’ as one of three categories of retail loans. The other two categories are residential mortgages and other retail, a catch all for retail loans other than residential mortgages. The QRRE category is intended to be used for short-term unsecured revolving lines of credit, e.g. credit cards and certain overdraft facilities. In New Zealand credit card loans account for approximately 1 to 3 percent of banks’ total lending portfolios. Compared to the other two categories, the capital requirement for QRRE loans is generally lower (except for some very high probability of default (PD) buckets).

In line with Basel II, the Reserve Bank’s capital adequacy requirements provide for the use of the QRRE category. However, use of the QRRE classification is subject to Reserve Bank approval and no bank has been granted approval as yet. The Reserve Bank is concerned that some of the underlying assumptions of the QRRE category do not apply in the New Zealand context. The evidence supplied by banks when seeking approval for QRRE use has not able to demonstrate the validity of those assumptions in New Zealand.


New Zealand’s Potential New Capital Rules on Investor Mortgages are Credit-Positive – Fitch

Fitch Ratings views positively the Reserve Bank of New Zealand’s (RBNZ) consultation on the capital treatment for mortgages to residential property investors. Higher capital requirements for investor loans combined with the existing loan to value ratio (LVR) limit could help protect banks against material losses in the event of a property price correction.

The RBNZ proposes to modify existing capital rules by requiring banks to include investor mortgages in a specific asset sub-class, and hold appropriate regulatory capital for those assets. Investor mortgages in New Zealand have performed similarly to owner-occupied mortgages but the experience in other markets has shown weaker asset quality performance in a downturn. The consultation paper seeks to define the terminology of investor mortgages in order to make policy decisions by end-April 2015. Currently investor mortgages are treated the same as owner-occupier mortgages for regulatory capital purposes in New Zealand.

The introduction of higher capital rules for investor mortgages may also slow the growth rates of property prices, particularly in Auckland. Increased investor demand and a rise in investor mortgages appear to be a contributor to this strong growth, and the RBNZ’s proposed limit could address some of the risks associated with these loans. The agency expects banks to charge higher interest rates on investor mortgages to offset the higher capital requirements which may deter some of the more marginal investment activity in the market. Price rises in Auckland have exceeded 10% per annum over the last 24 months which is unlikely to be sustainable in the long-term.

Investor mortgages typically have lower LVRs relative to owner-occupier loans and therefore are less susceptible to the RBNZ’s existing LVR restrictions, introduced in October 2013. Banks are only allowed to underwrite a maximum of 10% of new mortgages with an LVR in excess of 80% which has reduced some potential risk in the banks’ mortgage portfolios.

The new measures could also indirectly help to limit growth in household indebtedness by reducing house price appreciation closer to income growth. New Zealand’s household debt, measured as a percentage of disposable income stood at 156% at end-September-2014, which is high relative to many peer countries and has increased by 5pp since 2012. Although interest rates are still low compared to the historical long-term average, a rise in the official cash rate could place borrowers at risk of being unable to service their mortgages, and may eventually lead to asset quality problems for the banks. However, this risk is partly mitigated through bank affordability testing, which includes adding a buffer above the prevailing market interest rate when assessing serviceability.


The Post-Crisis Bank Capital Framework

David Rule, Executive Director, Prudential Policy at the Bank of England gave a good summary of the current issues surrounding capital, and commented specifically on issues surrounding internal (advanced) methods.

Six and half years after the depths of the Great Financial Crisis, we know the shape of the future global bank capital framework. But important questions do remain. Today I want to focus on how regulators should measure risk in order to set capital requirements, with some final remarks on the particular case of securitisation. To start, though, a reminder of the key elements of the post-crisis, internationally-agreed framework:

  • Banks have minimum requirements for at least 4.5% of risk-weighted assets (RWAs) in core equity and 6% of RWAs in going concern Tier 1 capital, including for the purpose of absorbing losses in insolvency or resolution. Basel III tightened the definition of capital significantly.
  • Systemically-important banks have further loss absorbing capacity so that they can be recapitalised in resolution without taxpayer support, ensuring the continuity of critical functions and minimising damage to financial stability.
  • In November 2014, the Financial Stability Board (FSB) proposed that total loss absorbing capacity (TLAC) for globally systemically-important banks (G-SIBs) should comprise at least 16-20% RWAs.
  • Core equity buffers sit on top of this TLAC so that the banking system can weather an economic downturn without unduly restricting lending to the real economy; the Basel III capital conservation buffer for all banks is sized at 2.5% of RWAs.
    o Systemically-important banks hold higher buffers; and
    o Buffers can also be increased counter-cyclically when national authorities identify higher systemic risks.

The new bank capital framework will cause banks to hold significantly more capital than the pre-crisis regime. Major UK bank capital requirements and buffers have increased at least seven-fold once you take account of the higher required quality of capital, regulatory adjustments to asset valuations and higher risk weights as well as the more obvious increases in headline ratio requirements and buffers. Small banks have seen a lesser increase than systemically-important banks, reflecting the important new emphasis since the crisis on setting capital buffers and TLAC in proportion to the impact of a bank’s distress or failure on the wider financial system and economy. In sum, the framework is now impact- as well as risk-adjusted. From a PRA perspective, this is consistent with our secondary objective to facilitate effective competition.

We are currently in transition to the final standards, with full implementation not due until 2019. Although the broad shape is clear, I want to highlight four areas where questions remain:

First, the overall calibration of TLAC. The FSB will finalize its ‘term sheet’ that specifies the TLAC standard for G-SIBs in light of a public consultation and findings from a quantitative impact study and market survey. It will submit a final version to the G-20 by the 2015 Summit. National authorities will also need to consider loss absorbing capacity requirements for banks other than G-SIBs. In the United Kingdom, the Financial Policy Committee (FPC) will this year consider the overall calibration of UK bank capital requirements and gone-concern loss absorbing capacity.

Second, the appropriate level of capital buffers, including how and by how much they increase as banks are more systemically important. The Basel Committee has published a method for bucketing G-SIBs by their global systemic importance, a mapping of buckets to buffer add-ons and a list of G-SIBs by bucket. This will be reviewed in 2017. Separately the US authorities have proposed somewhat higher add-ons. National authorities also have to decide buffer frameworks for domestically systemically-important banks or D-SIBs. In the UK, the FPC plans to consult on a proposal for UK D-SIBs in the second half of this year.

Third, the location of capital buffers, requirements and loss absorbing capacity within international banking groups. A number of such groups are moving towards ‘sibling’ structures in which operating banks are owned by a common holding company. This has advantages for resolution: first, loss absorbing capacity can be issued from a holding company so that statutory resolution tools only have to be applied to this ‘resolution entity’ – the operating subsidiaries that conduct the critical economic functions can be kept as going concerns; and second, the operating banks can be more easily separated in recovery or post-resolution restructuring. It also fits with legislation in countries such as the UK requiring ring fencing of core retail banking activities and the US requiring a foreign banking organization with a significant U.S. presence an to establish intermediate holding company over U.S. subsidiaries. A ‘single point of entry’ approach to resolution might involve all external equity to meet buffers and external equity and debt included in TLAC being issued from the top-level holding company. An important question then is to what extent and on what terms that equity and debt is downstreamed from the top-level holding company to any intermediate holding companies and the operating subsidiaries. This will also be influenced by the final TLAC standard that includes requirements on these intragroup arrangements.

Finally, I would like to spend more time on my fourth issue: how to measure a bank’s risk exposures in order to set TLAC and buffers – or, in other words, determining the denominator of the capital ratio. Here regulators have to balance multiple objectives:

  • An approach that is simple and produces consistent outcomes across banks. Basel I, based entirely on standardised regulatory estimates of credit risk, met this test.
  • An approach that is risk sensitive and minimises undesirable incentives that may distort market outcomes. Whether we like it or not, banks will evaluate their activities based on return on regulatory capital requirements. So if those requirements diverge from banks’ own assessments of risk, regulation will change market behaviour. Sometimes that may be intended and desirable. But often it will not be. Basel I, for example, led to distortions in markets like the growth of commercial paperback-up lines because under-one-year commitments had a zero capital requirement. Subsequent developments of the Basel capital framework sought to close the gap between regulatory estimates of risk and firms’ estimates of risk by allowing use of internal models for market, operational and credit risk.
  • An approach that is robust in the face of uncertainty about the future. Estimates of risk based on past outcomes may prove unreliable. We should be wary of very low capital requirements on the basis that assets are nearly risk free. And behavioural responses to the capital framework may change relative risks endogenously. For example, before the crisis, banks became dangerously over-exposed to AAA-rated senior tranches of asset backed securities partly because, wrongly, they saw the risks as very low and partly because the capital requirements were vanishingly small.

Ideally regulators would design a framework for measuring risk exposures that maximises each of these objectives. But trade-offs are likely to be necessary and, in my view, the rank ordering of objectives should be robustness followed by risk sensitivity and simplicity. Prioritising robustness points to combining different approaches in case any single one proves to be flawed. So the PRA uses three ways of measuring risk: risk weightings, leverage and stress testing. By weighting all assets equally regardless of risk, the leverage exposure measure provides a cross check on the possibility that risk weights or stress testing require too little capital against risks judged very low but which subsequently materialise.

In the United Kingdom, the FPC’s view is that leverage ratio should be set at 35% of a bank’s applicable risk-weighted requirements and buffers.1 This is simple to understand and can be seen as setting a minimum average risk weight of 35%. So, for non-systemic banks with risk-weighted requirements and buffers of 8.5%, the minimum leverage ratio would be 3%. But a G-SIB, with a risk-weighted buffer add-on of, say, two percentage points, would a have an additional leverage buffer of 0.7 percentage points. And all firms would be subject to a leverage buffer equal to 35% of any risk-weighted counter-cyclical buffer. Another key advantage of using the same scaling factor and mirroring the different elements of the risk-weighted framework is that it creates consistent incentives for different types of banks and over time. By contrast, for example, setting the same leverage ratio for all firms would amount to setting a lower minimum average risk weight for systemically-important banks than other banks.

Stress testing complements risk weighted and leverage approaches by considering the impact of extreme but plausible forward-looking macroeconomic scenarios of current concern to policymakers. Because buffers are intended to absorb losses in an economic downturn, the natural role of stress testing in the capital framework is to assess the adequacy of the buffers based on the Basel risk-weighted and leverage measures. If an individual bank is shown to be an outlier in a stress test, with a particularly large deterioration in its capital position, supervisors may use Pillar II to increase its capital buffers. The PRA is currently consulting on its approach to Pillar II, including a ‘PRA buffer’ that would be used in this way to address individual bank risks. An advantage of concurrent stress testing across major banks is that policymakers can consider the wider systemic impact of the scenario. They can also test whether buffers are sufficient even if regulators prevent banks from modelling management actions that would be harmful to the wider economy: for example, if banks propose to reduce new lending in order to conserve capital. Used in this way, stress testing may inform calibration of the system-wide, countercyclical buffer if macro-prudential policymakers identify elevated systemic risks.

Leverage and stress testing are best seen as complements rather than alternatives to risk-weighted measures of capital, producing a more robust overall framework. Risk weightings will likely remain the binding constraint for most banks most of the time. A central priority of the Basel Committee over the next year or so is to restore confidence in risk weightings by designing a system that balances most effectively the three objectives of robustness, risk sensitivity and simplicity.

Risk sensitivity points to a continuing role for firms’ internal estimates and models. But that depends on finding solutions for problems with them. First, various studies by the Basel Committee have shown material variations in risk weights between banks for reasons other than differences in the riskiness of portfolios. Models appear to be producing excessive variability in capital outputs, undermining confidence in risk-weighted capital ratios and raising questions about gaming. Second, some models may produce low risk weights because the data underpinning them do not include stress events in the tail of the distribution. This is a particular concern in portfolios where the typical level of defaults is low but defaults may correlate in a systemic crisis: for example, exposures to other banks or high quality mortgages. For major global firms, average risk weights fell almost continuously from around 70% in 1993 to below 40% in 2008, since when they have remained around that level. Third, modelled capital requirements can be procyclical. For example, last year’s concurrent stress test of major UK banks by the Bank of England showed that some banks’ mortgage risk weights increased significantly in the test, particularly where banks took a ‘point in time’ approach whereby probability of default was estimated as a function of prevailing economic and financial conditions.

One solution would be to abandon use of banks own estimates and models entirely and use standardised regulatory risk weights. But standardised approaches have their own weaknesses. For example, finding simple and consistent techniques for measuring risk by asset class that work well across countries with different market structures and risk environments is not straightforward. Regulators typically face a trade-off between simplicity and risk sensitivity. An alternative approach is to find solutions for the problems with models. Some possible ideas might include:

  • Requiring banks to provide more transparency about their risk estimates and models. The work of the Enhanced Disclosure Task Force and Basel’s revised Pillar III templates are steps in this direction. Regular hypothetical portfolio exercises by supervisors can identify banks with more aggressive approaches.
  • Being more selective about where it makes sense to allow internal models and where standardised approaches may be more effective. In the case of credit risk, for example, models may be more robust in asset classes with longer and richer histories of default data; and the value-added of models for risk sensitivity is likely to be greater in asset classes where banks have significant private information about differences in risk.
  • Changing the specification of models to take greater account of potential losses if tail risks crystallise. The Basel Committee has already agreed to move from a value-at-risk to an expected shortfall approach to estimating market risk. For credit risk, increasing the implied correlation of default in the model might be a simple way to produce higher risk weights in asset classes where banks are estimating low probabilities of default but regulators are concerned about tail risks.
  • Broadening the use of so-called ‘slotting’ approaches in which banks use their own estimates to rank order risks but regulators determine the risk weights for each ‘slot’. Slotting makes use of the better information banks have about relative risk within an asset class. But regulators decide the level of capital requirements. Slotting was one of the options considered when regulators first started thinking about use of internal models in the capital framework in the 1990s.
  • Putting floors on the level of modelled capital requirements. The Basel Committee has recently consulted on the design of a floor based on standardised risk weights to replace the existing transitional capital floor based on the Basel I framework. But it has not taken decisions on calibration: in other words, how often the floors would ‘bite’.

The Basel Committee has said that it will consider the calibration of standardised floors alongside its work on finalising revised standardised approaches to credit risk, market risk and operational risk, and as part of a range of policy and supervisory measures that aim to enhance the reliability and comparability of risk-weighted capital ratios. Restoring confidence in risk weights will form a major part of the Committee’s agenda over the next year or so. Meanwhile, at a national level, supervisors can use Pillar II to address risks not adequately captured under internationally-standardised risk weightings. The PRA uses Pillar II actively to ensure banks have adequate capital to support all the risks in their businesses and has recently set out in a transparent way for consultation the methodologies it proposes using to inform its setting of Pillar II capital requirements.

Finally, I want to speak briefly about securitisation as an example of an area where regulators find it hard to measure risk. One reason is that part of the securitisation market grew up in order to exploit weaknesses in risk weightings by allowing banks to maximise reduction in capital requirements while minimising decreases in revenue. A lesson from the past is that the risk of unintended market consequences is high. Risk weighting approaches for securitisation have relied either on external tranche ratings or on regulatory formulae. Both have problems. Formulae may not include all the key dimensions of risk. Ratings agencies can. But their track record in the financial crisis was poor and authorities globally are seeking – and in the US case are required by law – to reduce reliance on rating agencies.

As well as the micro-prudential goal to ensure that banks measure securitisation risks appropriately and hold adequate capital against them, we also have a macro-prudential goal that the securitisation market develops in a sustainable way. These goals are aligned because, as we saw in the crisis, a market that develops in an unhealthy way can mean unexpectedly greater risks for banks. What are the characteristics of a sustainable securitisation market? One in which:

  • banks and other issuers can use securitisation to transfer risk and raise funding but not to manage capital requirements artificially;
  • investors are diverse and predominantly ‘real money’ as opposed to the fragile base of leveraged funds and bank treasuries that collapsed in Europe during the crisis;
  • issuers’ incentives are adequately aligned with those of investors; and
  • investors have the information they need to understand the risks they are taking.

If structured soundly in this way, securitisation markets can be an important channel for diversifying funding sources and allocating risk more efficiently. Overall, the development of a carefully structured securitisation market could enable a broader distribution of financial sector risk, allow institutional investors to diversify their portfolios and banks to obtain funding and potentially remove part of the risk from banks’ balance sheets to free up balance sheet capacity for further lending to the economy.

The Basel Committee published a revised securitisation framework in December last year. Jointly with IOSCO, it also published for consultation a set of criteria to help identify simple, transparent and comparable (STC) securitisation. This year, the Committee will consider how to incorporate such criteria into the securitisation capital framework. In my view, incorporating the STC criteria will serve both micro-prudential and macro-prudential objectives. First, it will add a measure of ‘structure’ risk into the capital framework complementing existing inputs such as the underlying risk weights on the securitised portfolio, maturity and tranche seniority. That should improve risk sensitivity. And more transparency will help regulators as well as investors to measure risk. Second, such criteria will encourage securitisation market to develop in a more healthy and sustainable way. Finally, and returning to my main theme, I conclude that the post-crisis capital regulation for banks globally should be based on different ways of assessing risk, with leverage and stress testing complementing risk-weighted measures within an integrated framework. Such an approach is most likely to achieve the objectives of robustness followed by risk sensitivity and simplicity.

90% of additional Tier 1 instruments issued by banks globally in 4Q14 were for large Chinese banks

According to Fitch, nearly 90% of additional Tier 1 (AT1) instruments issued by banks globally in 4Q14 were issued by large Chinese banks. This resulted in Chinese banks, which were not present in the growing AT1 market before 4Q14 becoming the third-largest issuers of AT1 instruments behind UK and Swiss banks and accounting for around 20% of the USD131bn AT1 and other capital-trigger instruments.

Overall, banks issued around USD29bn in AT1 bonds in 4Q14, the second-strongest quarter after 2Q14. Fitch expects issuance volumes in 1H15 to remain dominated by Chinese banks which are likely to issue around USD50bn AT1 instruments in the short-term, mostly in local currency in their domestic market.

However, with the year-end results season under way and following tax status clarifications of AT1 instruments in several European countries, issuance from European banks will also likely remain solid, provided market conditions are conducive. This was evidenced by a EUR1.5bn issue by Netherlands-based Rabobank Group in January 2015.

Overall coupon omission and write-down/conversion risk in the AT1 market remained broadly stable in 4Q14. The write-down/conversion TDA (the issue size-weighted distance between the applicable common equity Tier 1 ratio of the issuer and the contractual write-down or conversion trigger) increased by a negligible 14bps to 679bps at end-4Q14, indicating marginally lower average write-down/conversion risk. In absolute terms, the write-down/conversion TDA widened to USD39.2bn at end-4Q14 from USD26.5bn at end-3Q14 largely as a result of the above-average size (in absolute terms) of the new Chinese issuers.


UK PRA Releases Consultation Paper On Pillar 2 Capital Requirements

The UK Prudential Regulation Authority (PRA) today released a consultation paper which sets out proposed changes to the PRA’s Pillar 2 framework for the UK banking sector, including changes to rules and supervisory statements. Under the Pillar 2 framework, the PRA assesses those risks either not adequately covered, or not covered at all, under Pillar 1 capital requirements, as well as seeking to ensure that firms can continue to meet their minimum capital requirements throughout a stress. It also introduces the content of a proposed new statement of policy: The PRA’s methodologies to setting Pillar 2 capital. This sets out the methodologies that the PRA proposes to inform its setting of firms’ Pillar 2A capital requirements.

The proposed policy is intended to ensure that firms have adequate capital to support the relevant risks in their business and that they have appropriate processes to ensure compliance with the Capital Requirements Regulation (CRR) and Capital Requirements Directive (CRD). It is also intended to encourage firms to develop and use better risk management techniques in monitoring and managing their risks. Pillar 2 therefore acts to further the safety and soundness of firms, in line with the PRA’s objectives. The PRA intends that the publication of its proposed methodologies to set Pillar 2 capital will help firms to understand the rationale for the PRA’s decisions and plan capital accordingly.

This consultation is relevant to banks, building societies and PRA-designated investment firms (‘firms’). The paper includes:

  • Overview and background on the proposed Pillar 2 framework.
  • Pillar 2A methodologies, including the proposed new approaches the PRA will use for assessing Pillar 2A capital for credit risk, operational risk, credit concentration risk and pension obligation risk, alongside the existing approaches for market risk, counterparty credit risk and interest rate risk in the non-trading book (usually referred to as interest rate risk in the banking book (IRRBB)). It also details the proposed associated data requirements.
  • The PRA buffer and how the PRA proposes to operate this new buffer regime.
  • Governance and risk management, including proposals to tackle significantly weak governance and risk management under Pillar 2.
  • Disclosure, including the impact of the proposed Pillar 2 reforms on capital disclosure and proposals for a more transparent regime.
  • Analysis on the impact of the proposed reforms.

The paper provides an excellent summary of the current thinking in terms of pillar 2 regulation, and it will further increase the capital required to be held by UK banks. There are implications for financial services companies and regulators in other jurisdictions. We discussed the implications of these capital changes recently.

The UK consultation closes on Friday 17 April 2015.