Sydney Home Prices Wobble

From Business Insider.

Sydney home values remained unchanged in April, adding to a string of a data that points to a slowdown in property prices in the Australia’s largest city.

The April results mark the weakest monthly change in dwelling values in Sydney since December 2015 had a 1.2% fall, data from research firm CoreLogic showed today.

Apartment values fell 1.2% in Sydney last month. Melbourne values inched up 0.5%, while the increase across all capital cities was a mere 0.1%, the slowest pace in 15 months, the data showed.

The latest figures add to tentative signs of easing in Sydney, where prices have more than doubled since January 2009, prompting the Reserve Bank of Australia to voice concerns of financial stability risks and the banking regulator to tighten lending norms.

While the weekend’s new figures will be released later today, auction clearance rates in Sydney slipped last week, while growth in investor home loans, the primary drivers of the market, climbed at the slowest pace in six months.

This table shows the changes in dwelling values

“The softer results should also be viewed against a backdrop of an ever evolving regulatory landscape s which is firmly aimed at slowing investment and interest-only mortgage lending,” Tim Lawless, head of research at CoreLogic said. “The higher cost of debt, as well as stricter lending and servicing criteria, has likely dented investment demand over recent months.”

And this one points to the housing boom in Sydney and Melbourne

The Australian Prudential Regulation Authority last month directed banks to limit the flow of new interest-only lending to 30% of total new residential mortgage lending, as well as placing strict internal limits on the volume of interest-only lending loan-to-value ratios. It also urged banks to to restrain lending growth in higher risk segments and apply prudent buffers in assessing loan eligibility.

The 30% limit on interest-only loans, which are favoured by investors, compares to about 40% of all new mortgages now, a level that APRA said was quite high by international and historical standards.

While tighter lending can dent demand in Sydney, where more than half the new mortgage demand is from investors, CoreLogic cautioned against calling a peak after just a month of “soft results.”

“April, in particular, coincides with seasonal factors including Easter, school holidays and ANZAC day long weekend,” Lawless said.

Preliminary Auction Clearance Rate Stronger This Week

From CoreLogic.

The combined capital city preliminary clearance rate rose to 76.9 per cent this week, increasing from last week, when final results saw the clearance rate fall to 69.8 per cent after 10 consecutive weeks remaining in the mid-70 per cent range.  The rebound in the preliminary clearance rate has occurred against a backdrop of higher auction volumes, with 2,347 properties taken to auction across the combined capital cities, up from last week’s 1,751, however lower than one year ago (2,675). The higher clearance rate and increase in volumes this week were attributable to stronger results across the two larger auction markets of Melbourne and Sydney, with performance across the remaining capitals remaining varied over the week.

Considering the slowdown in auction markets over previous weeks as well as widespread speculation that the housing market is moving through its peak, the final auction clearance rate, published by CoreLogic on Thursday, will be an important follow up to this strong preliminary result.

Don’t bet the house on a property market correction

From The New Daily.

Experts have warned against predicting that property prices have peaked just yet.

A flurry of headlines this week generated by UBS analysts, Australian Financial Review columnists and others all warned that Sydney and possible Melbourne prices had peaked and we should brace for a correction.

Most were based on slower price growth in Sydney dwelling values and slight reductions in auction clearance rates compiled by CoreLogic, a property data firm.

However, CoreLogic director of research Tim Lawless cautioned against reading into the results (especially dwelling values, which are yet to be officially released for April) because April and May are generally weaker periods.

“Potentially there is some seasonality creeping into these numbers and that’s one of the reasons why I would probably suggest caution calling the peak right now before we see a few more months and see if the trend actually develops,” Mr Lawless told The New Daily.

“When we look at, say, a year ago or any sort of seasonality in the marketplace, yeah, we do generally see some easing in our reading around April and May.”

A further complication is that CoreLogic adjusted how it calculated dwelling values in May 2016 to account for seasonality. The result, according to Mr Lawless, is that “technically speaking, there are some challenges and complexities making a year-to-year comparison”, although he said the adjustments were “quite minor” and values could still be compared.

The change sparked a scandal last year, with the Reserve Bank ditching the company as its preferred data source after claiming it had overstated dwelling values in April and May.

Despite this, CoreLogic remains the most widely cited property data source because it reports dwelling values daily. But the most authoritative is the Australian Bureau Statistics, which has measured similar quarter-on-quarter falls in the past, especially between the December and June quarters. And yet, the trend has been ever upwards.

IFM chief economist Dr Alex Joiner agreed we shouldn’t jump to conclusions based on the latest statistics.

“I wouldn’t suggest that anyone looks at any month-to-month data in Australia and makes firm conclusions from it,” Dr Joiner told The New Daily.

“People might want to rush to call the top, but the trends are for gradually decelerating growth, and I think that’s about right.”

But if this is not the peak, the market is “very much approaching it” because the Reserve Bank and the banks are likely to lift interest rates even as wage growth stays low, Dr Joiner said.

“When that actually decelerates price growth, whether it’s this month or later in the year, I don’t know. But we’re certainly eeking out the very last stages of price growth in the property market.”

Sydney property prices down: CoreLogic

From The Real Estate Conversation.

CoreLogic has revealed the property market has been largely flat during the month of April, ahead of the release of its end-of-month numbers on Monday.

CoreLogic’s hedonic home value index for Australia’s top five property markets held virtually steady in the first 27 days of the month, indicating that the current cycle could be moving through its peak.

Sydney prices recorded a “subtle” decline, according to CoreLogic, a dramatic though welcome turnaround from the blistering 18.8 per cent increase recorded in March. The five-city aggregate also recorded an exceptionally strong result in March, rising 12.9 per cent despite a 4.7 per cent decline in Perth prices.

Leeanne Pilkington, deputy president of the Real Estate Institute of New South Wales, says the April decline in Sydney prices was only very slight, and will vary from suburb to suburb.

“None of my agents are telling me they’re worried about prices going down,” she said.

However, Pilkington said her agents are saying there a lower numbers at open houses, which means there could be less competition in the market between buyers.

“We’ve seen that [trend] with the lower clearance rate last week,” she said. Pilkington said clearance rates above 80 per cent were not sustainable, and that a modest decline in clearance rates would actually be desirable.

“We really want some stability in the market,” she said.

Pilkington said April was a holiday month, containing both Easter and ANZAC day, so the numbers for the month may not reflect the true state of the market. Auction clearance rates over the weekend will provide clearer guidance, she said.

Tim Lawless, head of research Asia Pacific with CoreLogic, attributes the flat overall result to recent regulatory changes which have led to higher mortgage rates and weaker investment demand, causing a “dampening” effect on the property market.

Short Supply Forces Land Prices to Rise Again – HIA

Australia’s residential land market showed signs of increased supply pressures during the closing quarter of 2016 according to the latest HIA-CoreLogic Residential Land Report published today by the Housing Industry Association and CoreLogic.

According to the latest HIA-CoreLogic Residential Land Report, the weighted median land lot price rose by 4.8 per cent to $254,406 during the December 2016 quarter – 9.3 per cent higher than a year earlier. Today’s report also indicates that the estimated number of land lot sales across Australia totalled 10,756 during the final quarter of 2016 – down by 22.7 per cent compared with the previous quarter and 39.5 per cent lower than a year earlier.

Based on land transactions during the December 2016 quarter, the annual pace of residential land price growth was strongest in Melbourne (+16.3 per cent), followed by Sydney (+10.7 per cent) and Adelaide (+10.3 per cent). Over the same period, Perth’s residential land market experienced the weakest price growth (+0.9 per cent) with modest land price increases affecting Brisbane (+5.4 per cent) and Hobart (+3.1 per cent).

“The volume of residential lot transactions appears to have dipped sharply during the December 2016 quarter, placing pressure on land prices,” remarked HIA Senior Economist, Shane Garrett.

“With land being such a crucial ingredient in new home supply more challenging cost conditions in the market for residential land in 2017 will make the battle to improve housing affordability more difficult.

“We need to make it easier and less costly to deliver additional stocks of shovel-ready residential land to market. This can only be done by tackling planning delays in zoning and subdivision, releasing government-held land and improving funding mechanisms for housing infrastructure,” concluded Shane Garrett.

According to Eliza Owen, CoreLogic’sCommercial Research Analyst, “The continued fall of sales volumes against sustained value increases suggests demand is outstripping the available supply of vacant residential lots. This is particularly evident in Melbourne, where the value of lots experienced the highest growth of all capital cities in the year to December (16.3 per cent). Sales volumes in the city fell 15.2 per cent in the six months to December 2016.

“The median lot value in Melbourne is still lower than Sydney, which has consistently maintained the highest median lot price of the capital city markets. With a median vacant lot price of $455,000 this accounts for approximately 45 per cent of the median Sydney house price at the December quarter, assuming the median house was on the median lot. This median lot value has increased a staggering 65 per cent over the last five years.

“With housing affordability high on all government’s agenda, and an increasing concern for households, particularly in Sydney and Melbourne, more attention must be paid to how increased supply of residential land could help ease demand,” concluded Eliza Owen.

Auction Activity Rose Last Week

From Core Logic.

Auction activity increased significantly across the combined capital cities this week after last week’s Easter period slowdown, with 1,732 homes taken to market and a preliminary clearance rate of 72.1 per cent, down from 73.9 per cent last week across fewer auctions (493).  Melbourne saw the most significant increase in activity, with volumes increasing from 102 last week to 823 this week, also returning the highest clearance rate of all the capital cities (76.8 per cent). Both clearance rate and volumes are higher than what was seen over the corresponding week last year, when 69.7 per cent of the 1,565 auctions cleared.

Easter long weekend returns a rise in capital city clearance rate

From CoreLogic.

Across the combined capital cities, the auction clearance rate rose to 78.8 per cent last week, from 74.8 per cent the previous week. The number of homes taken to auction, however, fell to just 487 across the capital city markets, with Sydney host to the majority of auctions last week (275). Preliminary results for Sydney show that 82.4 per cent of reported auctions (187) were successful, the strongest clearance rate for the city this year; however it is likely that this will revise down as further results are captured over the coming days. In Melbourne, traditionally the country’s largest auction market, there were just 99 auctions held last week, with 55 results reported so far and a clearance rate of 85.5 per cent so it will be interesting to see what happens when the remaining results are obtained.

Strong Auction Clearances Continue

From CoreLogic.

Auction activity ramped up across the combined capital cities this week in the lead up to Easter, with 3,424 homes taken to auction this week, recording the highest volume of auctions year-to-date. The preliminary clearance rate remains strong despite the increase in volumes over the week, with 77.6 per cent of auctions reporting as successful. This week’s results are higher than both last week’s 75.9 per cent across 2,657 auctions and the same time last year when 67.1 per cent of the 1,831 auctions were cleared.  However, if we compare to the pre-Easter weekend in March last year, volume’s reached their highest level for 2016, with 3,540 auctions held.

Home Prices Through The Roof

From Business Insider.

Australian house prices continued to soar in March, and not just in Sydney and Melbourne.

According to the latest Hedonic Home Value Index released by CoreLogic earlier today, capital city house prices rose by a weighted average of 1.4% last month, leaving the increase on a year earlier at 12.9%, the fastest seen since May 2010.

And while prices in Sydney and Melbourne, the epicentre of Australia’s housing affordability debate, logged hefty increases of 1.4% and 1.9%, they were actually outpaced by gains in several other capitals during the month.

This table from CoreLogic shows how prices in individual capital cities fared in March.

Source: CoreLogic


At 3.1% apiece, prices in Hobart and Darwin recorded the strongest growth in prices, while those in Canberra and Perth logged gains of 1.4% and 1.0% respectively.

Adelaide and Brisbane recorded more modest increases of 0.4% and 0.2%.

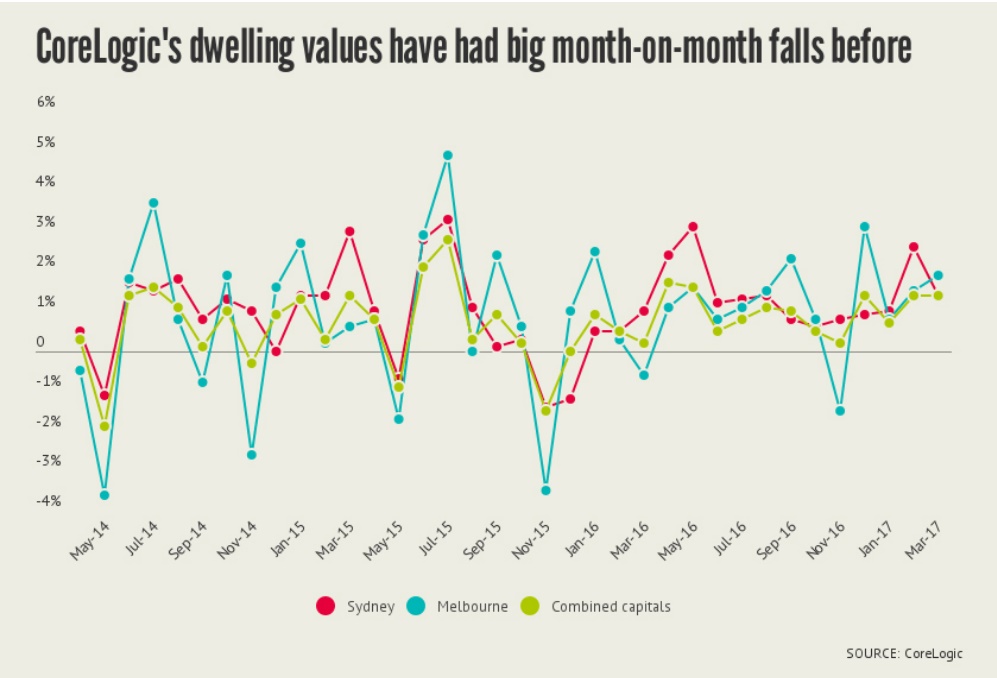
While the price growth was uneven across the capitals, with all capitals recording an increase in prices over the month, it suggests that the strength in the Sydney and Melbourne markets are now spreading across the country.

For the quarter, prices rose by over 5% in Sydney, Hobart and Canberra, and in excess of 4% in Melbourne.

Adelaide, at 1.6%, was the only other capital to register an increase. Elsewhere, prices were flat in Brisbane but fell in Perth and Darwin.

In weighted terms, and largely reflective of ongoing strength in Sydney and Melbourne prices, prices across the nation’s capitals rose by 3.5% over the quarter.

A huge increase, and one that suggests demand for property remains as strong as ever despite out-of-cycle mortgage rate increases from lenders and the threat of tighter lending restrictions, and potential changes to the tax treatment of housing, from Australian policymakers.

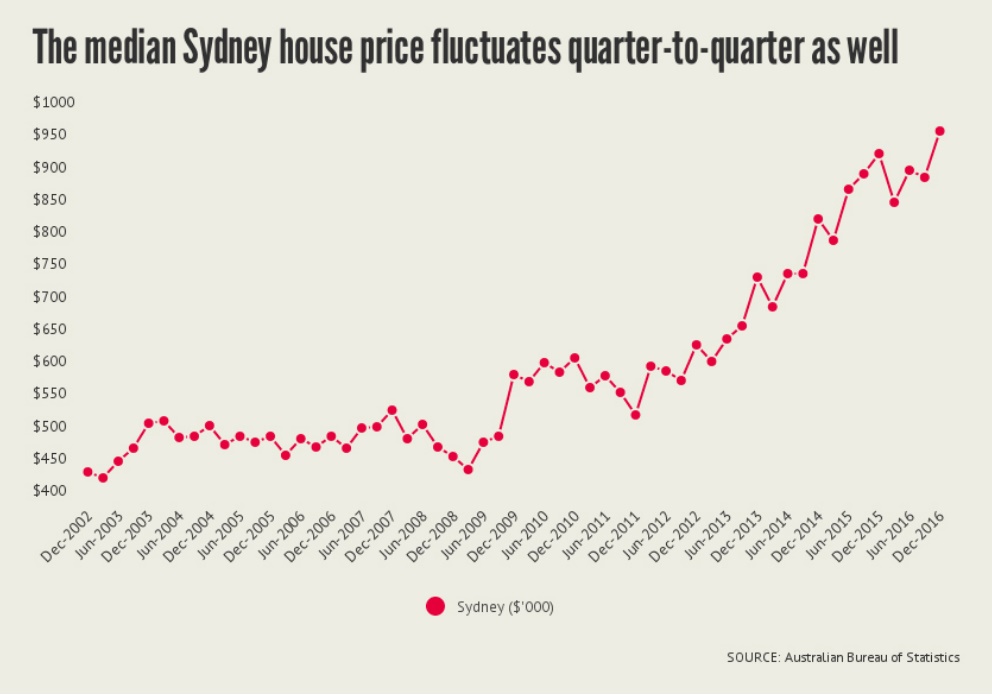
As a result of the enormous increases registered in the quarter in Sydney, the median dwelling price in the city surged to $805,000, up 18.9% on a year earlier.

CoreLogic said that was the fastest annual rate of growth recorded since November 2002.

Prices in Melbourne rose by 15.9% over the same period, and by over 10% in Canberra and Hobart.

Prices in Brisbane and Adelaide rose by a smaller 3.7% and 3.4% over the past 12 months while those in Perth and Darwin — most exposed to the mining sector — fell by over 4%. This result is largely reflective of weaker economic conditions, increased supply and population trends across the country.

The variance in prices across the country in the past year underlines the multi-speed housing market we’re seeing at present, and underscores why the most acute concerns over financial stability risks and housing affordability are centred around Sydney and Melbourne.

As this chart from CoreLogic reveals, the median dwelling price in Sydney has now increased by 109.2% since January 2009. Prices in Melbourne, at 92.4%, have also risen substantially over the same period.


Source: CoreLogic


By type of dwelling, CoreLogic said that in combined weighted terms, house values were 13.4% higher over the past twelve months compared with a 9.8% rise in units.

Commenting on the March result, Tim Lawless, head of research at CoreLogic, said that the strength in house prices — particularly in Sydney and Melbourne — reflect not only strong demand but also lower-than-usual supply for sale.

“Low listing numbers continue to create urgency for buyers with the number of properties being advertised for sale remaining low,” says Lawless.

“Nationally, the number of residential properties advertised for sale was 6.9% lower than a year ago in March, and total listing numbers were 4.0% lower across the capital cities.”

Lawless says that every capital city currently has fewer residential properties advertised for sale compared with a year ago, which, along with strong demand, is helping to stoke price growth even more.

“A shortage of advertised stock can contribute to upwards pressure on prices, as prospective buyers experience FOMO — the fear of missing out — which reduces a buyers ability or willingness to negotiate on prices and causes some urgency in the decision making process,” he says.

He says that strong demand can be attributed to the rising number of investors participating in the market compared with a year ago as well as the lower cash rate stimulus and population growth.

While those conditions have helped to fuel rapid price growth over the past 12 months, Lawless is not sure whether that strength will continue, particularly with Australia’s banking regulator, APRA, announcing late last week that it will now limit interest-only loans to 30% of total new mortgage lending.

“Given the recent policy announcements are aimed at dampening investment related credit demand, we can expect lending conditions for investment purposes will tighten, particularly for investors with small deposits or those applying for an interest only loan,” he says.

“Additionally, higher mortgage rates handed down by Australia’s major banks may contribute towards cooling some of the exuberance being seen in the largest capital city housing markets.”

Lawless also believes that record-low rental yields for investors due to ongoing price gains, along with affordability constraints limiting new entrants to the market and increased unit supply, are also likely to act as a brake on capital gains in the period ahead.

Preliminary clearance rate remains strong, while auction volumes fall

From CoreLogic.

The combined capital city preliminary clearance rate remains in the mid-high 70 per cent range for another week, while auction volumes decrease week-on-week. There were 2,646 properties taken to auction this week, down from 3,171 last week, when auction volumes reached their second highest level so far this year. Despite auction volumes shifting generally higher over the last few weeks, the weighted average clearance rate has remained relatively consistent, with preliminary results this week showing 78.1 per cent of the 2,121 reported auctions were successful, increasing from 74.5 per cent last week and also higher than the corresponding week last year when a 66.6 per cent clearance rate was recorded across a significantly lower volume of auctions coming out of the Easter period (1,582).