Preliminary clearance rate holds above 70% as the number of auctions held slips lower

Confirming the Domain data we reported on Saturday, CoreLogic says the first week of winter saw auction volumes fall, with 2,545 homes taken to auction, compared to 2,885 the previous week.

The preliminary clearance rate across the combined capital cities was higher (73.9 per cent) compared with last week’s finalised result, which was the third lowest clearance rate so far this year (71.3 per cent). With auction clearance rates typically revising lower as more results flow through, the final clearance rate is likely to be lower than what was recorded last week.  At the same time last year, both the combined capital city clearance rate and the number of auctions were lower, with 2,008 auctions held and 68.2 per cent reported as successful. The two largest auction markets, Melbourne and Sydney, saw their preliminary clearance rates rise compared with last weeks finalised results, with Sydney at 77.5 per cent and Melbourne at 75.4 per cent. Across the smaller capital city markets, week-on-week results show mixed results with clearance rates falling in Brisbane and Canberra.

NSW first home buyer demand set to surge post July 1

From CoreLogic.

Abolishing stamp duty for first home buyers is likely to create some headaches for eligible buyers who have recently entered into contracts. Additionally we can expect first home buyer activity to stall before surging higher on July 1 2017. The long term outcome may be self-defeating due to higher demand pushing up prices.

The decision yesterday by the News South Wales Government Premier Gladys Berejiklian to provide first home buyers with a stamp duty exemption for properties with a price tag under $650,000 is likely to boost demand for this under represented segment of the market. Based on recent Australian Bureau of Statistics (ABS) data, first home buyers comprised only 8% of owner occupier mortgage commitments in March 2017, which is only marginally higher than the record low of 7.5% recorded in September last year and well below the long term average of 17%.

According to the latest CoreLogic ‘Perceptions of Housing Affordability’ report, it highlighted that across New South Wales the largest proportion of respondents (48%) identified that stamp duty was the most significant obstacle to housing affordability. Additionally, almost three quarters of respondents (74%) felt that removing or reducing stamp duty would be an effective way to improve housing affordability in New South Wales.

Clearly the state government is responding to one of the most significant pain points for prospective buyers.

The current policy provides a stamp duty exemption to first home buyers purchasing a new home with a price tag under $550,000. The new policy has substantially broader scope, providing an exemption for both new and established housing with a price tag under $650,000 and sliding discounts up to $800,000.

To put these limits into context, over the past twelve months, 45.4% of dwellings sold across New South Wales had a price tag of $650,000 or less and 58% of dwelling sales had a price tag $800,000 or less. The proportion of properties that meet the exemption criteria falls away sharply if the analysis is confined only to the Sydney metropolitan area where 25.8% of dwelling sales over the past twelve months were at a price of $650,000 or less.

With a substantial premium on detached housing, the proportions are also substantially different between the broad product types. The past twelve months saw 20.0% of Sydney houses sell for $650,000 or less while unit sales comprised just over one third of all sales (33.5%) at or below this price.

Additionally, with investor demand likely to be slowing due to higher mortgage rates, tighter credit policies and low yields; there is the potential that a rise in first time buyer demand could fill the ‘hole’ left by fewer investors in the market and offset the recent slowdown in the pace of capital gains.

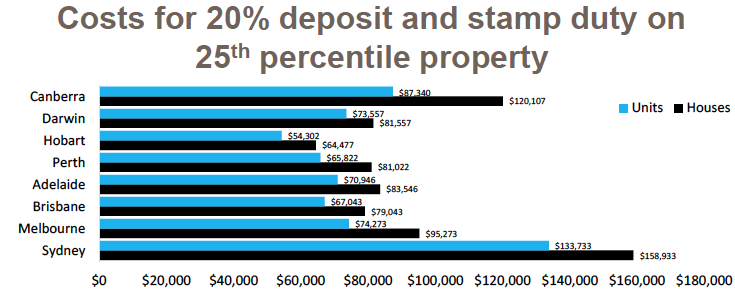
First home buyers still need to contend with the challenges of raising a deposit, which is another major barrier to market entry. Housing prices in Sydney are the highest amongst the capital cities, with the latest data from CoreLogic putting the median house price at just over $1 million and median unit price at just under $743,000. Those buyers who can’t stump up a 20% deposit have been given another leg up, with stamp duty for lenders mortgage insurance also abolished.

Stamp duty on lenders mortgage insurance is charged at 9% of the premium; so a first home buyer with a 5% deposit on a $650,000 property is likely to save themselves around $2,250 (based on a premium of $25,000).

Removing or reducing the transactional costs for first home buyers is likely to provide both positive and negative consequences across the New South Wales housing market.

From a positive sense, policies aimed at improving housing accessibility for first time home buyers are likely to be positively received. Sydney is Australia’s most unaffordable housing market by any measure, and for many buyers, the cost of entry, including stamp duty and raising a deposit, is the most significant barrier to entry. On a $650,000 dwelling purchase, a non-first home buyer would be paying stamp duty costs of around $25,000; so the exemption is a substantial cost saving for a first home buyer.

On the negative side, it’s widely accepted that policies aimed at stimulating demand tend to push prices higher; there is a possibility that the new policy could ultimately be self-defeating, increasing housing demand which could place further upwards pressure on the price of housing which will exacerbate the affordability challenges even further.

The new policy comes into effect on July 1st, so we can expect first home buyer sales to stall over the remainder of June and likely surge higher from the beginning of the new financial year. For those buyers who are potentially eligible for the new exemptions but have recently entered into contacts, there is likely to be some severe disappointment that these rules aren’t applied retrospectively.

Auction Clearance Rate Remains Strong

From CoreLogic.

The amount of auction activity across the capital cities increased slightly this week, up from 2,824 last week to 2,850 this week, while this time last year auction volumes were lower, with 2,480 homes taken to auction across the combined capital cities.

This week’s preliminary weighted average clearance rate across the combined capitals was 74.6 per cent, increasing from 73.1 per cent over the previous week and up from 67.7 per cent one year ago. Melbourne saw the highest preliminary clearance rate across the cities at 77.3 per cent, down slightly from last week, while across the remaining cities; clearance rates increased week-on week with the exception of Adelaide and Tasmania where clearance rates fell.


CoreLogic numbers dispel smashed avo theory

From The Real Estate Conversation.

The 20% deposit and stamp duty required to buy a house in Sydney is $158,933, based on new CoreLogic data. That’s equivalent to 20 years’ worth of smashed avo.

The 20 per cent deposit and stamp duty required to buy a house in Sydney is $158,933, according to new data from CoreLogic. That’s the equivalent of 7,224 serves of $22 avocado on toast – or avocado on toast every day for 20 years.

Even in the nation’s most affordable city, Hobart, buyers must accumulate $64,477 for the deposit on a house and to cover stamp duty. That’s 2,930 serves of your favourite brekkie – or avo on toast every day for eight years.

Source: CoreLogic.

The numbers put Bernard Salt’s jocular observation of young adults wasting money on smashed avo into perspective: even if young Australian do give up extravagant brunches and put the funds towards saving for a house, it will take years, even decades, to accumulate enough cash for the deposit and stamp duty on a home.

Core Logic has used house and apartment prices in the 25th percentile to compile the data, considering that first-home buyers are generally purchasing at the more affordable end of the property spectrum.

Cameron Kusher, research analyst with CoreLogic, said the research does not factor in stamp duty exemptions below a certain price threshold in some states.

Kusher also said it’s not always necessary to have the whole 20 per cent deposit, although a lesser deposit will usually mean that required lenders mortgage insurance, which is an additional cost for the home buyer.

In a paper on the research, Kusher said housing affordability is worsening as property prices soar higher as wages growth stagnates.

In the 12 months to April 2017, Sydney dwelling values increased by 16.0 per cent, and Melbourne values rose 15.3 per cent. Yet household incomes in Sydney only rose 4.6 per cent in the year to March 2017, while household incomes rose a mere 2.7 per cent in Melbourne, according to data from the Australian National University

“Entry into the housing market remains a real challenge,” said Kusher.

“Even in cheaper areas, household income growth is fairly slow which makes saving a deposit difficult,” he said.

“It is unclear as to how, absent a big fall in property prices, housing affordability for first home buyers can be greatly improved,” he said.

So eat your smashed avo and enjoy it; scrimping on brunch isn’t going to be enough to buy you a property in the current market.

Sydney and Melbourne Home Price Slide

Latest data from CoreLogic shows a continued slide in the major markets  this month. Brisbane (inc. Gold Coast) are the only positive markets.

Still too soon to know whether this is significant, (there were changes made to their index last year which may impact the results), but the annual changes are still strong in the two largest markets.


Auction activity rises week-on-week

From CoreLogic.

Auction activity across the combined capital cities increased this week, up from 2,409 auctions last week, to 2,794 this week, making it the sixth busiest week this year. This weeks weighted average clearance rate across the combined capitals was 77.2 per cent, increasing from a final clearance rate of 72.8 per cent over the previous week, while at the same time last year, both volumes (1,920) and the clearance rate (68.9 per cent) were lower.

The two largest auction markets, Melbourne and Sydney, saw their preliminary clearance rates rise, with Sydney at 80.7 per cent and Melbourne at 79.2 per cent, although Sydney, and to a lesser extent Melbourne, tend to revise down over the week when the remaining results are captured. Over the previous week, Sydney’s preliminary clearance rate of 79.4 per cent was revised down to 74.5 per cent when finalised.  Across the smaller capital city markets, Brisbane was the only city where preliminary clearance rates fell week-on-week so again it will be interesting to see how the clearance rates hold when the final figures are released on Thursday.


Fewer Buyers Results in Greater Months of Supply

From CoreLogic.

Based on the relationship between demonstrated housing demand and advertised stock levels we are seeing relatively more stock available for sale compared to demand for that stock across the capital cities at the moment.

The months of supply figure compares the number of unique properties advertised for sale to the number of transactions in the market.  The analysis provides unique insight into how long it should take to clear the volume of stock currently available for sale.  It is important to note that off-the-plan housing stock is typically not advertised for sale as individual properties and as a result is not included within this analysis.

Across the combined capital cities, there is currently 4.4 months’ worth of residential properties being advertised for sale.  As the first chart shows, the months of supply is currently higher at this point of the year than it has been each year since 2012.  The increasing months of supply is largely due to the slowing rate of transaction activity rather than a spike in properties available for sale, indicating demand has diminished relative to advertised supply levels which is pushing the figure higher.

Months of supply, combined capital cities

2017-05-15--image1

Sydney

There is currently 3.0 months of established housing supply available for sale across the city.  The city has seen consistently low months of supply over recent years however, the figure is currently at its highest level for this time of year since 2012.

2017-05-15--sydneyimg

Melbourne

Established housing stock currently sits at 4.2 months of supply for the city.  Supply levels remain quite low but are at their highest levels for this time of year in five years.

2017-05-15--melb

Auction Volumes Rebound

From CoreLogic.

Auction markets have remained resilient, with both volumes and the preliminary clearance rate rising week-on-week. The strong auction results add some complexity to speculation that the housing market is moving through its peak rate of growth.  At face value, auction markets are continuing to indicate continued strength in selling conditions across Sydney and Melbourne, however it’s harder to know whether vendors are adjusting their reserve pricing in order to clear their property. There were 2,376 auctions held across the cities this week, with a preliminary auction clearance rate of 76.2 per cent. Last week, a final clearance rate of 73.0 per cent was recorded across 1,689 auctions. Over the corresponding week last year, auction volumes were lower than this week, with 1,876 properties taken to auction and a clearance rate of 69.5 per cent. Melbourne had the highest number of auctions this week, with 1,092 properties going to market, with a lower preliminary rate of clearance week-on-week (76.8 per cent), however Sydney saw the largest increase in volumes over the week, with 938 auctions held across the city, increasing from last week’s 592.  Final auction clearance rates are published on Thursday and it will be important to monitor whether preliminary clearance rates undergo some revision as more data flows through.


Taxation Revenue From Property Continues to Climb

Nice piece from CoreLogic on the growth in property related taxes. As we pointed out before, the states are major winners when property markets rise (and would be hit badly in a slowing market).

The latest data shows that state and local governments collected 51.9% of their total taxation revenue from property, a record high proportion

The Australian Bureau of Statistics (ABS) has recently released the latest taxation statistics data for the 2015-16 financial year.  From a property perspective, taxes are largely collected from state and local governments and over the year $49.567 billion in property taxes were collected nationally.  The value of property taxes collected was 9.6% higher over the year and accounted for a historic high 51.9% of total state and local government revenue.

Total value of property taxation revenue to
state and local governments

2017-05-08--image1

Stamp duty on conveyances accounted for the largest overall proportion of property tax revenue. Over the 2015-16 financial year, state and local governments raised $20.607 billion in revenue from stamp duty, accounting for 41.6% of total property tax revenue.  The second chart highlights the value of revenue from stamp duty on conveyances and the proportion of total property tax revenue coming from stamp duty.  As a proportion of total property tax revenue, stamp duty has previously been higher however, over the past few years there has been a substantial increase in the value of revenue collected from stamp duty.

Value of stamp duty on conveyances tax
revenue and % of total property tax revenue

2017-05-08--image2

The third chart highlights the revenue collected from stamp duty across each of the major states.  It is pretty easy to see what booming housing markets do for state government coffers with the NSW and Vic governments seeing stamp duty revenues surge.  Of course, when the housing market isn’t booming it has a substantial impact on stamp duty revenue, see NSW and Vic in 2008-09 and WA more recently.  The uncertainty surrounding stamp duty and its dependence on stock turnover makes it an inefficient and volatile source of taxation revenue.  Because stamp duty is only collected from properties which transact, the state governments are relying on values and transactions rising across the 5% to 7% of properties which turnover in any given year to drive their major source of property tax revenue.

Value of stamp duty on conveyances tax
revenue across the major states

2017-05-08--image3

The final chart highlights the three largest sources of property tax revenue; land tax, municipal rates and stamp duties on conveyances.  Between them, these three sources of tax revenue accounted for 90.3% of all property related tax revenue to state and local governments in 2015-16 and 46.9% of total taxation revenue.  We already know that $20.607 billion in tax revenue came from stamp duty on conveyances, a further $7.237 billion came from land taxes and $16.924 billion came from municipal rates.

Major sources of property taxation revenue
over time

2017-05-08--image4

Land taxes and municipal rates are much more guaranteed income streams than the more volatile stamp duty on conveyances.  For this reason, it would make sense to move from stamp duty to a much more efficient, easier to collect and holistic land tax.  The reality is that any such move is unlikely to be supported by the NSW and Vic governments currently given how much revenue these states continue to rake in due to the ongoing housing booms in Sydney and Melbourne.

Auction Softening Trend

From CoreLogic

This week, 1,662 capital city auctions were held and preliminary results show that 1,365 auctions have been reported so far, with a preliminary clearance rate of 74.6 per cent, rising from a final clearance rate of 74.0 per cent last week across 2,350 auctions.  While clearance rates remain above the long term average across the largest capital cities, the rolling four week average reveals a softening trend which can be attributed to Sydney’s final clearance rate drifting lower over the past two months while the trend in Melbourne is holding firmer in the high 70.0 per cent range.  Preliminary results show that while Melbourne and Sydney maintain their place as the strongest auction markets, Adelaide and Brisbane have shown a rebound in the downwards clearance rate trend this week.  This week’s combined capital city preliminary clearance rate is stronger than one year ago, when 67.7 per cent of capital city properties cleared, however auction volumes are lower than this time last year when 2,230 homes were taken to auction across the combined capitals.