Whats In A Home Price Number?

So, we have new data from both CoreLogic and Domain on home price growth.  The problem is we are getting somewhat different results, driven presumably by their different methodologies. But is does make it hard to decode the true story in some locations.  Trends are still pointing down though.

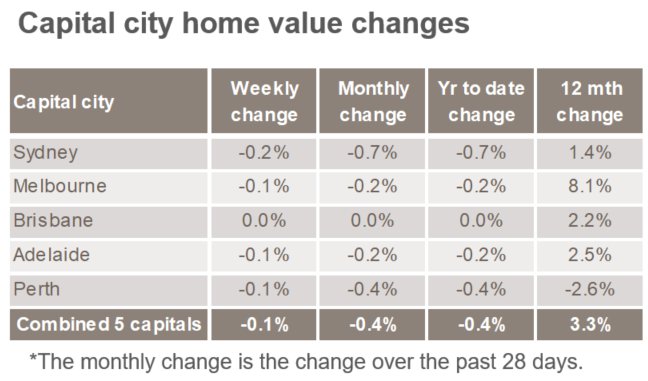
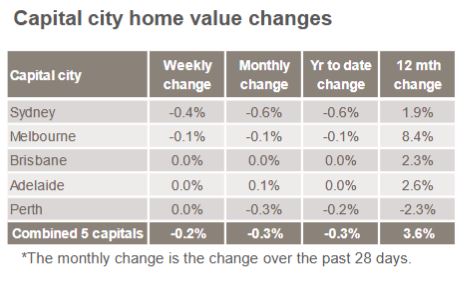
Here is a plot of changes in values over the past year, based on CoreLogic’s December 2017 and January 2018 data, and the December 2017 data from Domain.

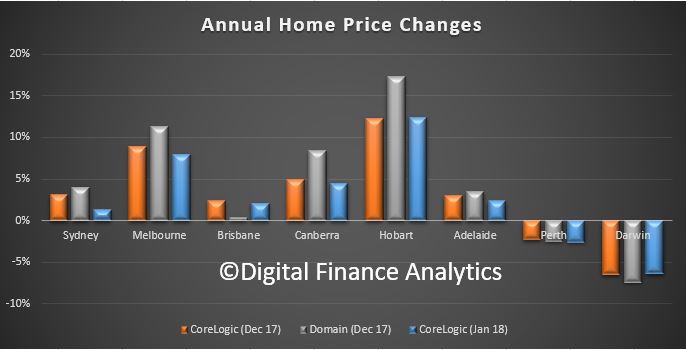
Domain looks more bullish in the eastern states, Brisbane apart. Corelogic is showing a fall between December and January in most east coast states.

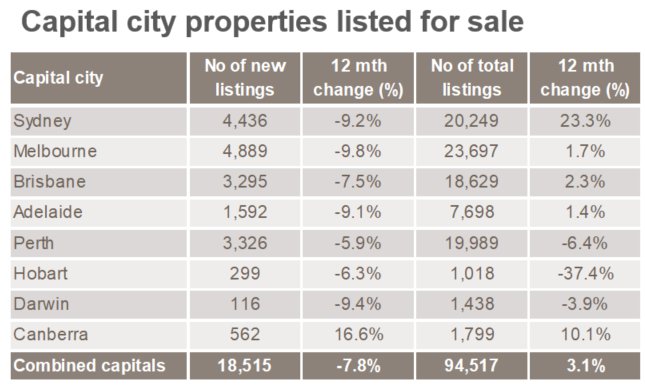
Hobart is the winner, but is it 17% or 12%, a large variation.  And is Canberra 8% or 4%?

Perth and Darwin and stuck in negative territory.

My take out is that these numbers are dynamic, and should not be taken too seriously, though the trend is probably the best indicator.

Perhaps their respective analysts can explain the variations. I for one would love to understand the differences.

Its a pity we have to wait so long for the ABS price data.  But then again, that just adds another data point, which does not directly match.

Another case of being careful with the data!

Home Prices Slide Further, What Next?

The latest CoreLogic index data continues to underscore a slide in prices, and a rise in property listed in the main centres.

Sydney continues its slowing trend, Melbourne is following, and Perth is lower.

The number of properties listed continues to rise in Sydney and Canberra most notably.

Many are arguing this is just a “blip” over the holiday period, and things will return to normal as the autumn season kicks off. However, we are less sure, given the changed lending environment, and expectations from property investors.  The next month or so will provide a better lens on longer term prospects.

CoreLogic also makes the point that:

The combined capital city auction clearance rate fell to 62.3 per cent over the December quarter, down from 67.8 per cent over the September quarter.

Clearance rates are down across all but two capital cities over the December quarter, with Sydney recording the largest fall, down from 66.8 per cent to 57.7 per cent. Brisbane and Adelaide were the only cities where clearance rates didn’t fall, with both cities increasing by just 0.2 per cent over the December quarter. Melbourne recorded the highest clearance rate over the quarter at 68.1 per cent, down from 72.6 per cent the previous quarter, followed by Canberra at 66.3 per cent. Overall, the combined capital city clearance rate for the December quarter is lower on both a quarterly and annual basis.

More Evidence Property Is Fading

The latest weekly data from CoreLogic underscores the weakness in the property market. First prices are drifting lower.

The indicator of mortgage activity is also down, suggesting demand is easing as lending rules tighten. But then we always have a decline over the summer break.

The question is, are we seeing a temporary blip, over the holiday season, or something more structural? We think the latter is more likely, but time will tell.


National Dwelling Values Fall 0.3% In December – CoreLogic

Further evidence of cracks showing in the property market in the major centres.

From CoreLogic.

According to the CoreLogic December Hedonic Home Value Index results, national dwelling values slipped lower over the month, led by falls across Sydney, Darwin, Melbourne and Perth . This sets the scene For softer housing conditions In 2018

The transition towards weaker housing market conditions has been clear but gradual and is likely to continue throughout 2018 according to CoreLogic head of research Tim Lawless.

Commenting on the results, Mr Lawless said, “From a macro perspective, late 2016 marked a peak in the pace of capital gains across Australia with national dwelling values rising at the rolling quarterly pace of 3.7% over the three months to November.”

“In 2017 we saw growth rates and transactional activity gradually lose steam, with national month-on-month capital gains slowing to 0% in October and November before turning negative in December.”

According to CoreLogic, the 0.3% fall in December was the catalyst for dragging the quarterly capital gains result into negative territory for the first time since the three months ending April 2016.  Nationally, dwelling values were 4.2% higher over the 2017 calendar year which is a slower pace of growth relative to 2016 when national dwelling values rose 5.8% and in 2015 when values nationally were 9.2% higher.

Index results as at December 31, 2017

2018-01-02--Indices_results

Auction Volumes Decrease Across The Combined Capital Cities

From CoreLogic.

The final week of auction reporting for 2017 returned a preliminary auction clearance rate of 64.2 per cent across the combined capital cities, increasing on last week when the final auction clearance rate fell below 60 per cent for the first time this year, when only 59.5 per cent of auctions cleared. The number of homes taken to auction fell this week, after the surge in activity recorded over the 4 weeks prior when volumes remained consistently above the 3,000 level. There were a total of 2,865 auctions held this week, down on last week when 3,371 auctions where held across the capitals and only slightly higher than volumes from the same week one year ago (2,735).

Melbourne and Sydney both saw an increase in preliminary clearance rates this week, with 67.3 per cent and 60.8 per cent of auctions clearing which was up on the previous week when both cities recorded their lowest clearance rates of the year. The smaller auction markets returned varied results this week, with Adelaide recording the highest preliminary auction clearance rate of 70.1 per cent, while only 43.3 per cent of auctions sold in Perth.

2017-12-18--auctionresultscapitalcities

Sydney and Melbourne Property Markets Soften

From CoreLogic.

This week across the combined capital cities, auction volumes remained high with 3,353 homes taken to auction returning a preliminary clearance rate of 63.1 per cent, increasing from last week when the final clearance rate across the capitals recorded the lowest not only this year, but the lowest reading since late 2015/ early 2016 (60.3 per cent).

The lower weighted clearance rates of late can be attributed to the continual softening conditions across the two largest markets of Melbourne and Sydney, with clearance rates tracking below 70 per cent across Melbourne for 5 consecutive week’s now (67.4 per cent), however volumes across the city have been consistently higher; with volumes this week reaching their second highest level this year (1,837), while Sydney’s clearance rates have tracked around the mid-high 50 per cent range over 7 consecutive week’s (58.7 per cent). Across the smaller markets, Canberra recorded the highest preliminary clearance rate this week, with 66.7 per cent of homes selling, while Brisbane returned the lowest with only 46.6 per cent of auctions successful.

2017-12-11--auctionresultscombinedcapitals

Auction Volumes Lower Slightly

From CoreLogic.

There were 3,276 auctions held across the combined capital cities this week, returning a preliminary auction clearance rate of 63.5 per cent, increasing on last week’s final auction clearance rate of 61.1 per cent when the combined capitals recorded the third busiest week for auctions so far this year (3,438). Over the same week last year, auction volumes were similar to this week (3,207), although the clearance rate was considerably higher at 72.3 per cent.

Across the two largest auction markets, Melbourne and Sydney, both cities saw an increase in the rate of clearance over the week, however the 66.0 per cent preliminary clearance rate across Melbourne is only slightly higher than last week’s final; this is likely to revise lower as final results are collected and potentially surpass last week as the lowest seen since June 2016. While the performance across the smaller markets was varied this week, with Canberra recording the highest preliminary clearance rate of 75.6 per cent, while only 44.9 per cent of homes sold across Brisbane.

2017-12-04--auctionresultscombinedcapitalcities

Home Prices Wobble In Sydney; Melbourne Higher

From CoreLogic.

National dwelling values held steady in November, with a 0.1% fall in capital city dwelling values offsetting a 0.2% rise in values across the combined regional markets of Australia, according to CoreLogic’s November Hedonic Home Value Index results.

According to CoreLogic head of research Tim Lawless, a significant contributor to the downwards movement over the month came from the Sydney housing market, which recorded a 0.7% fall in dwelling values, while a fall in values was also recorded across Darwin and regional Northern Territory which were both down 0.4% over the month. For the remaining broad regions of Australia, dwelling values were relatively steady, or experienced a subtle rise, over the month.

Index results as at November 30, 2017

2017-12-01--indices

National dwelling values tracked 0.2% higher over the past three months and have increased 5.2% over the twelve months ending November. The national annual growth rate has now halved since reaching a recent peak in May 2017, when dwelling values rose 10.4%.

Conditions remain diverse across the regions

Mr Lawless said, “The diversity in capital city housing market conditions is highlighted by the rolling quarterly change in dwelling values, which range from a 3.3% rise in Hobart, to a 2.7% decline in Darwin.  However, considering that together these two cities account for less than 1.5% of total housing stock in Australia, they have had little effect on the overall headline figures.”

He said, “On the other hand, softer housing market conditions across Sydney, which comprises roughly one fifth of national dwelling stock (and approximately one third by value), has a material influence over the headline growth trends.”

The Sydney housing market moved through a recent peak in July 2017 and dwelling values have been trending lower each month since that time.  Dwelling values were down 0.7% in November to be 1.3% lower relative to the market peak. Sydney’s 1.3% fall over the past three months is the greatest decline over a three month period since March 2016. While the rate of value decline in Sydney has gathered some momentum, it remains extremely modest.

Mr Lawless believes there is mounting evidence that the Perth housing market may finally have bottomed out. Dwelling values across Perth have edged higher over each of the past three months to record the first rolling quarterly capital gain since late 2014. The three months to November saw Perth dwelling values rise by 0.3%.  In addition to values moving off their low base, settled sales are rising (+3.8% year on year), homes are selling faster (59 days compared with 68 days a year ago) and advertised stock levels have reduced substantially (-12.7% compared with last year). He said, “If this is indeed the start of a recovery phase in the Perth housing market, it comes after dwelling values have fallen 10.8% since peaking in mid-2014.”

Auction Clearance Up Just a Bit

From CoreLogic.

There were 3,409 homes taken to auction across the combined capital cities this week, returning a preliminary auction clearance rate of 66.9 per cent, overtaking last week as the third busiest week for auctions so far this year. Last week, based on final results, 60.9 per cent of the 3,390 auctions held recorded a successful result, the lowest clearance rate since late 2015/early 2016.

Once final results are collected, the combined capital city clearance rate tends to revise down so at this stage it’s looking like the final clearance rate on Thursday will be in the mid to low 60 per cent range for the sixth week in a row. Sydney and Melbourne, the two largest auction markets, have seen clearance rates increase week-on-week after last week saw both cities recording their lowest clearance rates for the year so far, however as usual, these clearance rates will revise lower over the week. Over the same week last year, a total of 3,398 homes were taken to auction across the combined capital cities, and a clearance rate of 73.0 per cent was recorded.

2017-11-27--auctionresultscapitalcities

Sydney Leads Auction Clearance Rates Lower

Further confirmation today that Sydney is leading the property market lower, based on the preliminary auction results from CoreLogic.

The combined capital cities returned a preliminary auction clearance rate of 65.4 per cent this week across 3,335 auctions making it the third busiest week for auctions so far this year, increasing from 62.8 per cent across 2,907 auctions last week. This time last year, 2,987 homes were taken to auction and a clearance rate of 74.4 per cent was recorded.

The final clearance rate has remained below 65 per cent for the last 4 weeks and it’s likely that this will be the case again on Thursday when the final results are released. One of the biggest contributors to the softer auction market conditions is Sydney, where the final clearance rate has remained below 60 per cent since the last week of October, while Melbourne has slipped below 70 per cent for the second week in a row.

2017-11-20--auctionresultscapitalcity