Planning Zones Cause Property Prices To Rise – RBA

An interesting  research paper from the Economic Research Department RBA “The Effect of Zoning on Housing Prices” is worth reading.

Overall, they suggest that development restrictions (interacting with increasing demand) have contributed materially to the significant rise in housing prices in Australia’s largest cities since the late 1990s, pushing prices substantially above the supply costs of their physical inputs.

Although differences in the value of dwelling structures and the physical value of land account for some of the variation in average housing prices across the four cities, zoning effect estimates account for the majority of the differences.

There is also a large gap opening up between apartment sale prices and construction costs over recent years, especially in Sydney. This suggests that zoning constraints are also important in the market for high-density dwellings.

They estimate that zoning restrictions raise detached house prices by 73 per cent of marginal costs in Sydney, 69 per cent in Melbourne, 42 per cent in Brisbane and 54 per cent in Perth.

This is not the amount that house prices would fall in the absence of zoning. Physical land costs are higher in Australian cities (particularly Sydney) than overseas. So even if zoning restrictions were relaxed, housing in Australia would remain expensive relative to cities where zoning is permissive and land is less physically scarce.

Using data from CoreLogic and some supply/dremand modelling they track the difference between the average (or market) price and the marginal (or physical) value of land.  Some government policies, – “zoning”, restrict the supply of housing.

Examples include minimum lot sizes, maximum building heights and planning approval processes. Although these restrictions may confer benefits, they also raise the price of housing. This paper attempts to quantify the effect of zoning on housing prices in Australia’s four largest cities.

Anecdotal evidence suggests that zoning can have a huge effect on land values. For example, a 363 hectare site in Wyndam Vale (40 km west of Melbourne) increased in value from $120 million to $400 million following its rezoning from rural to residential (Schlesinger and Tan 2017). Examples like this are common – Appendix A provides more. Such large increases in values as a result of zoning changes are inconsistent with the view that a physical shortage of land itself is the main cause of high land values and housing prices – and instead point towards a high ‘shadow price’ of government permission to build dwellings as a likely explanation. It is difficult, however, to gauge how representative these anecdotes are, or to analyse how they change over time or place.

To estimate the effect of zoning, we consider the cost of a marginal increase in the number and density of dwellings for a given area and given population (hence a reduction in average household size). This means that we do not include the costs involved in increasing the footprint or size of a city, such as provision of extra roads and utilities, as a cost of supplying housing.

Figure 2 shows a decomposition of property prices back to 1999. To extend our estimates of structure value back in time, we adjust the estimates from Table 1 by movements in the producer price index (PPI) – output of house construction series for each city’s corresponding state, and by movements in the average floor area of houses sold in each city. To estimate the value of physical land over time, we estimate separate regressions for each year back to 1999.

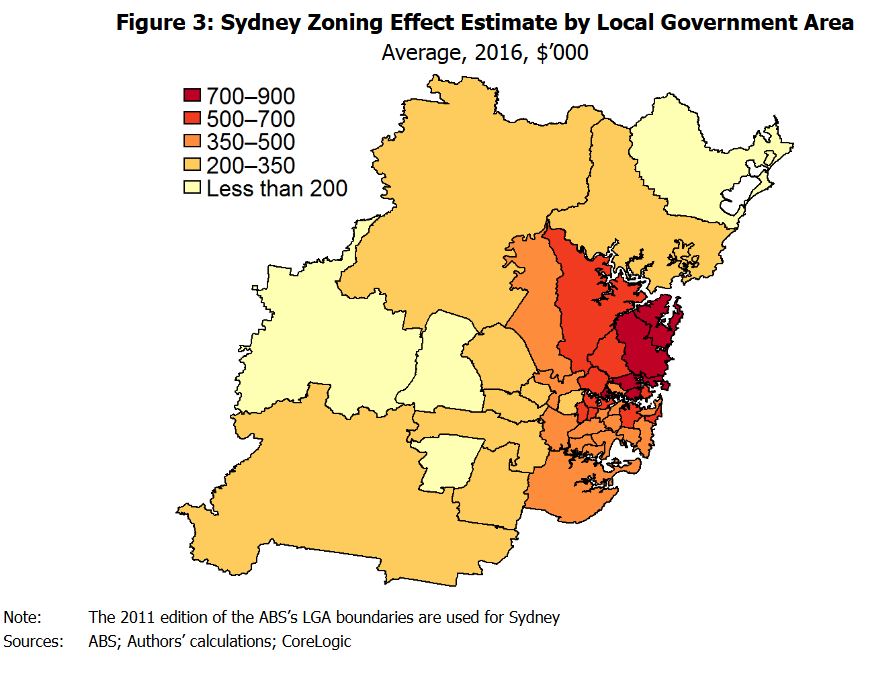
Figures 3–4 show estimates of the zoning effect for the average property in local government areas (LGAs). We split property prices into structure values and land values in each LGA, using the CoreLogic data on property prices and the valuer general estimates for land values for each LGA (as this allows structure value to vary across LGAs for reasons other than just floor area).19 We then estimate physical land values by running separate hedonic regressions for each LGA of the form of our large regression in Section 4.20 Our estimate of the zoning effect by LGA is then the remaining portion of land value not accounted for by the physical value.


If housing demand continues to grow, as seems likely, then existing zoning restrictions will bind more tightly and place continuing upward pressure on housing prices. Policy changes that make zoning restrictions less binding, whether directly (e.g. increasing building height limits) or indirectly, via reducing underlying demand for land in areas where restrictions are binding (e.g. improving transport infrastructure), could reduce this upward pressure on housing prices.

Auction Results Softer – CoreLogic

More confirmation of lower auction clearance rates, this time from CoreLogic. But also, note that quite a few properties listed for sale never came to auction!  So you could say the real results are even worse.

CoreLogic says there were 2,980 homes taken to auction across the combined capital cities this week, returning a preliminary auction clearance rate of 65.9 per cent, while last week, 3,313 auctions were held and the final clearance rate came in at 66.8 per cent.

Over the same week last year, auction volumes were slightly lower with 2,907 homes going under the hammer across the combined capital cities, although the clearance rate was a stronger 74.6 per cent.

CoreLogic Auction Results

If we look at results by property type, units outperformed the house market this week with 67.6 per cent of units selling at auction, while 65.1 per cent of houses sold across the combined capital cities.

In Melbourne, Australia’s largest auction market, a preliminary auction clearance rate of 67.3 per cent was recorded across 1,523 auctions this week, down from 70.6 per cent across 1,606 auctions last week. One year ago, the clearance rate was a stronger 78.4 per cent across 1,459 auctions. There were 1,044 auctions held in Sydney this week returning a preliminary auction clearance rate of 66.9 per cent, compared to 65.1 per cent across 1,259 last week, and 76.0 per cent across 950 auctions one year ago.

CoreLogic Auction Market Clearance Rate

Across the smaller auction markets, preliminary results show that Canberra was the best performing in terms of clearance rate with a 70.8 per cent success rate.

Home Prices Drift Lower In February – CoreLogic

According to the CoreLogic Home Value Index results out today, dwelling values edged lower across most capital cities over the month, with broad based falls weighing down dwelling values nationally for the fifth consecutive month.

The 0.1% decline in national dwelling values in February 2018 was more moderate than the 0.3% declines recorded over each of the previous two months, however, it marked the first time national values had fallen for five consecutive months since March 2016.  There continues to be a divergence between capital city and regional markets, with the combined capital city index falling by -0.3% over the month, compared to a 0.4% increase in combined regional values.

Month-on-month falls were generally mild but broad based  Over the month, values fell across every capital city except Hobart (+0.7%) and Adelaide (steady), with the largest monthly decline recorded across Darwin (-0.9%) and Sydney (-0.6%).  Values were lower in Melbourne (-0.1%), Brisbane (-0.1%), Perth (-0.2%), and Canberra (-0.3%).

The rate of decline eased over the second half of February although values have fallen in most capital cities during February, the CoreLogic daily index indicates that the rate of decline eased late in the month, in line with improving auction clearance rates.  Sydney, Melbourne and Perth all recorded more moderate falls in values throughout February than they did in January.

CoreLogic head of research, Tim Lawless, said, “The overall softening in the market becomes more evident when looking at the change in values over the past three months.”

Over the three months to February 2018, Adelaide (0.1%) and Hobart (3.2%) were the only capital cities in which values rose.  Sydney, which has been the strongest market for value growth over recent years, saw the largest fall in values over the three month period, down -2.4%. Sydney was followed by Darwin, which has been persistently weak over recent years, and saw values fall by a further -2.0% over the quarter.

Regional markets outperforming the capitals  While most individual capital cities recorded declines in values over the past three months, in the regional areas of the country the results were very different; regional dwelling values increased by 0.9% over the three months and values were higher in the regional areas of all states except for Western Australia.

Auction Rates Up This Week?

According to CoreLogic, auction volumes surge past 3,000 for the first time this year returning a strong preliminary auction clearance rate of 70.5 per cent. Still well down on a year ago, despite higher volumes.

Auction volumes returned to higher levels this week across the combined capital cities with a total of 3,275 homes taken to auction; the higher volumes returned a strong preliminary auction clearance rate of 70.5 per cent. Last week 1,992 auctions were held across the capitals with 66.1 per cent clearing, while over the same week one year ago a 78.4 per cent clearance rate was recorded across a higher volume of auctions (3,301).

CoreLogic Auction results

Results segregated into property type showed that units outperformed the house market this week, with 72.9 per cent of units selling at auction, while 69.5 per cent of houses sold across the combined capitals.

Melbourne returned a preliminary auction clearance rate of 71.7 per cent this week, which was higher than final figures from last week which saw 69.8 per cent of auctions clearing. Melbourne’s higher preliminary clearance rate was across a significantly higher volume of auctions week-on-week, with 1,610 held, up from last week’s 932 auctions.   In Sydney, 1,221 homes were taken to auction this week, returning an equal highest preliminary result to Melbourne’s 71.7 per cent, increasing on last week’s final clearance rate of 67.8 per cent across a lower volume of auctions (737).

CoreLogic auction results

Across the smaller auctions markets, Adelaide was the best performing in terms of clearance rate with 75.9 per cent of the 107 auctions reporting as sold. While Perth returned the lowest preliminary auction clearance rate of 52.6 per cent.

Separately, they also showed no change in prices this past week.

Auction Clearance Rates Holding Higher Than Late 2017

From Corelogic.

As auction volumes return to more normal levels after the festive period slowdown, auction clearance rates are holding higher than late 2017.

A preliminary auction clearance rate of 69.1 per cent was recorded across the combined capital cities as auction activity ramped up this week, with a total of 1,963 homes taken to auction, increasing from the 1,490 auctions held last week when (based on final results) 63.7 per cent cleared. While auction activity has increased over the last couple of weeks coming out of the slowdown, volumes are increasing at a slower pace than what was seen over the equivalent period last year (2,291).

CoreLogic capital city auction statistics (preliminary)


Sydney’s preliminary clearance rate was recorded at 74.3 per cent across 718 scheduled auctions; well above the trend over the final quarter of 2017 where auction clearance rates were tracking in the low 50 per cent range.  A preliminary auction clearance rate of 70.7 per cent was recorded across Melbourne, which is unchanged from last week’s final clearance rate, however volumes increased this week with 923 auctions held up from 619 last week.

CoreLogic Capital City auction clearance rate


This will be the first week in some time where Sydney has outperformed Melbourne, however as final results are collect it will be interesting to see how this revises.

The performance across the smaller auction markets was varied this week, with Adelaide recording a preliminary auction clearance rate of 67.3 per cent, while only 12.5 per cent of auctions were successful in Tasmania.

Looking at results by broad property types, Sydney houses were the best performing market this week, with 74.6 per cent of properties selling, followed closely by Melbourne’s unit market with 74.1 per cent of units selling, which was higher than Sydney’s units.

Final Auction Results Up(ish)

CoreLogic’s final auction  results are out for last Saturday.  Higher than last week, but significantly lower than last year at this time.

Last week, the final auction clearance rate increased across the combined capital cities, returning a 63.7 per cent clearance rate across almost double the volume of auctions week-on-week (1,470).

CoreLogic Auction Market Statistics

Over the week prior, a clearance rate of 62.0 per cent was recorded across 790 auctions. Both auction clearance rate and volumes were lower than what was seen one year ago, when a 73.2 per cent clearance was recorded across 1,591 auctions.

CoreLogic Auction Clearance Rate

Residential land prices hit another new high

The latest HIA-CoreLogic Residential Land Report shows that the median vacant residential land lot price rose nationally by 6.5 per cent during the September 2017 quarter to reach $267,368.

“Yet again, the price of residential land in Sydney and Melbourne has touched fresh all-time highs.

“Transactions on the land market continue to drop, indicating that supply is simply not matching demand sufficiently.

“The high cost of new residential land is at the heart of Australia’s housing affordability crisis.

“The housing industry’s ability to ramp up the supply of new dwellings as demand dictates is hampered by the inconsistency of the land supply pipeline. The time it takes for land to be made available to builders is unnecessarily long,” concluded HIA Senior Economist Shane Garrett.

According to Eliza Owen, CoreLogic’s Commercial Research Analyst, “The 6.5 per cent acceleration in vacant residential land prices suggests strong demand, even in the context of our largest residential markets passing peak growth rates for the current cycle. The CoreLogic Hedonic Home value index is showing a 1 per cent quarterly decline in capital city dwellings in the three months to January, led by the Sydney market which saw a 2.5 per cent decline.

“Despite the softening in capital growth, land prices were driven higher by long term confidence in some Australian metropolitan markets. Indeed, developers may act counter-cyclically to secure vacant land on the fringe of metropolitan areas before the next upswing. This is reflected in Melbourne, which saw over one in five of the 14,704 vacant land transactions in the year to September.

“In Victoria, CoreLogic development data indicates that 48.6 per cent of residential subdivisions in 2017 commenced on the fringes of Melbourne, such as in Hume, Whittlesea and Wyndham. This further demonstrates the high levels of demand for housing that is connected to the facilities and employment opportunities of major cities,” concluded Eliza Owen.

Auction Clearances A Little Higher, Perhaps

CoreLogic has published their preliminary auction clearance results for last Saturday.

This week across the combined capital cities, auction volumes continued to increase with 1,464 homes taken to auction returning a preliminary clearance rate of 67.7 per cent, increasing from 62.0 per cent across 790 auctions last week, although this is likely to revise down over the week. Over the same week last year 1,591 auctions were held, while the clearance rate was a stronger 73.2 per cent. Adelaide and Perth were the only cities to see clearance rates fall over the week, while volumes increased everywhere except Adelaide. The strongest preliminary clearance rate was recorded in Melbourne (72.5 per cent), followed by Adelaide (68.9 per cent).

2018-02-12--auctionresultscapitalcities

Auction Clearance Rates Slide As Listings Rise

According to Corelogic, last week, the combined capital cities returned a final auction clearance rate of 62 per cent across 790 auctions, with both clearance rate and volumes recording lower than last year when 68.8 per cent of the 881 auctions cleared.

The two strongest auction markets in terms of clearance rate last week were Melbourne and Adelaide, with both cities recording a 70.2 per cent rate of clearance. Followed by Canberra (62.2 per cent) and Sydney (57.1 per cent), while Brisbane, Perth and Tasmania all recorded clearance rates at or below 50 per cent.

It is expected that auction volumes will returned to normal levels in the coming weeks and a true reading of auction market conditions can be established.

Outside of the capital city markets, Geelong returned a final clearance rate of 88.9 per cent across 20 auctions. While the Gold Coast recorded the highest volume of auctions with 96 held, however only 46.9 per cent were successful.

Auction Clearance Latest

CoreLogic says  the auction market is starting to bounce back from the seasonal slowdown, with almost three times the number of auctions held this week compared with last week, although volumes are lower than the same week last year. CoreLogic was tracking 779 auctions this week, compared with just 276 last week, while 881 homes were taken to auction this week last year.

Although the overall number of auctions is lower than this time last year, Melbourne was the only capital city to see an increase in volumes year-on-year. The preliminary auction clearance rate, based on the 578 auction results reported so far, was recorded at 67.7 per cent across the combined capital cities, compared to 72.8 per cent last week and 68.8 per cent last year.

All cities recorded a stronger preliminary clearance rate than what was recorded at the end of 2017, however, with auction activity only just starting to pick up, we should get a better idea over the coming weeks as to whether the clearance rates will revert back to the lower levels seen towards the end of last year.

2018-02-05--auctionresultscapitalcity