Housing Credit Climbs In February

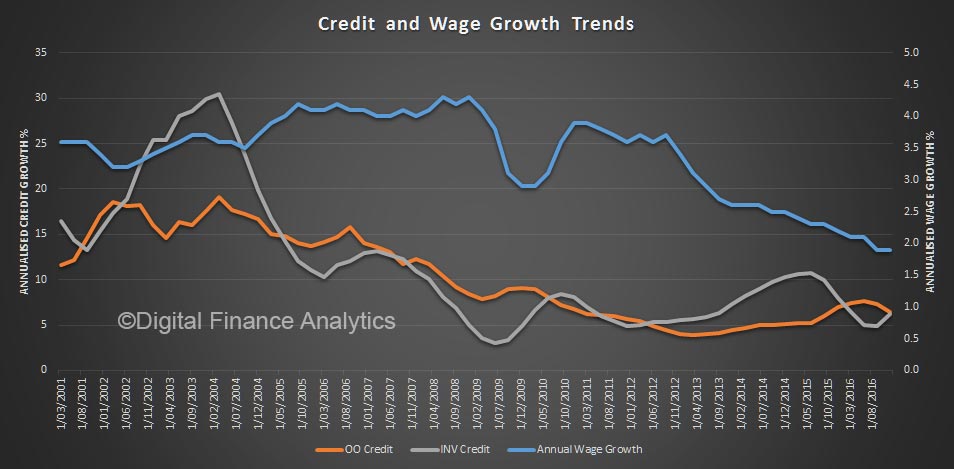
The February 2017 data from the RBA today shows that overall credit grew 0.3% in the month, with housing up 0.6% to an annual 6.4% whilst personal credit and business lending both fell.

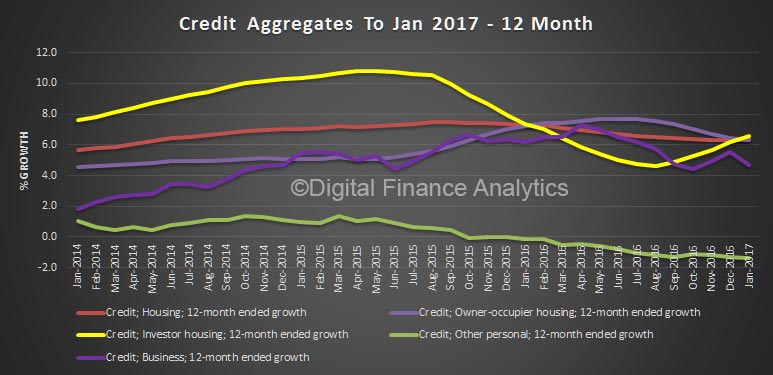
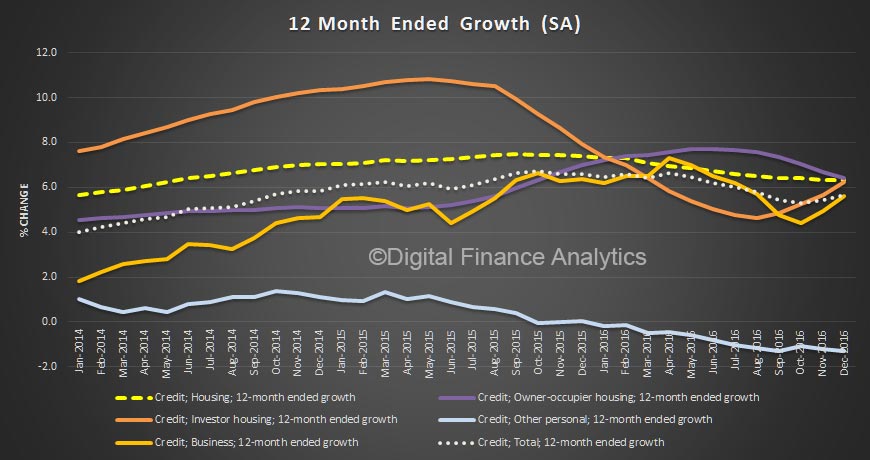
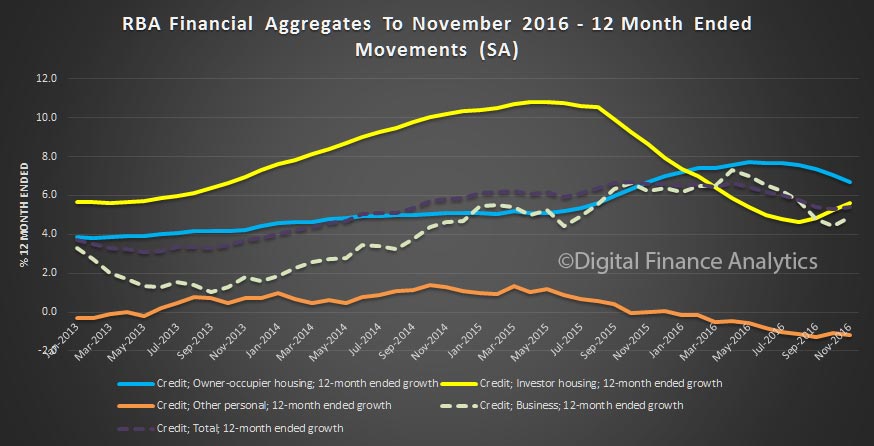
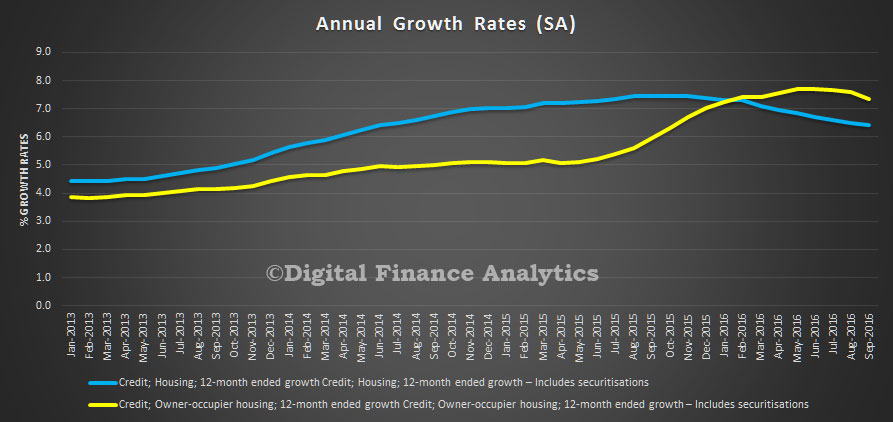
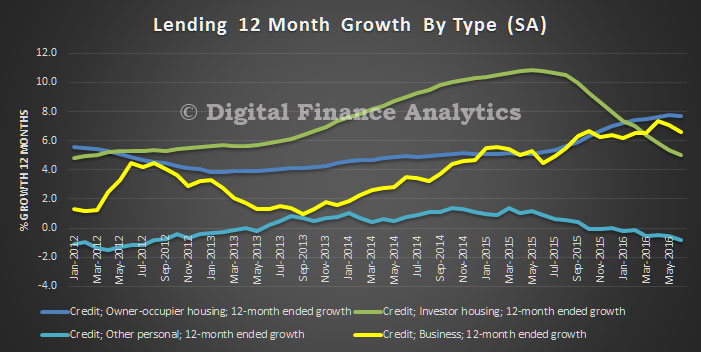
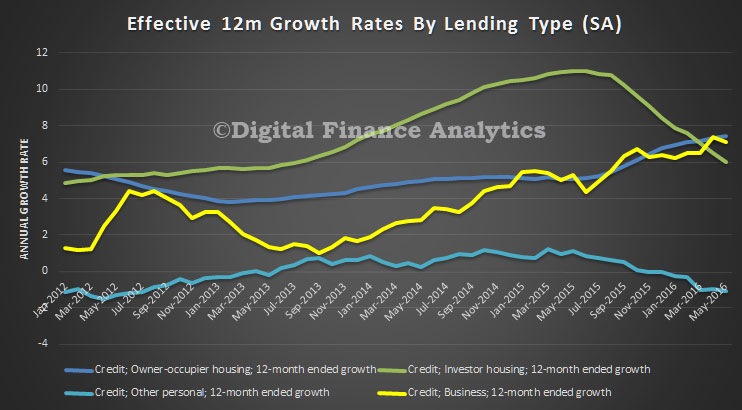
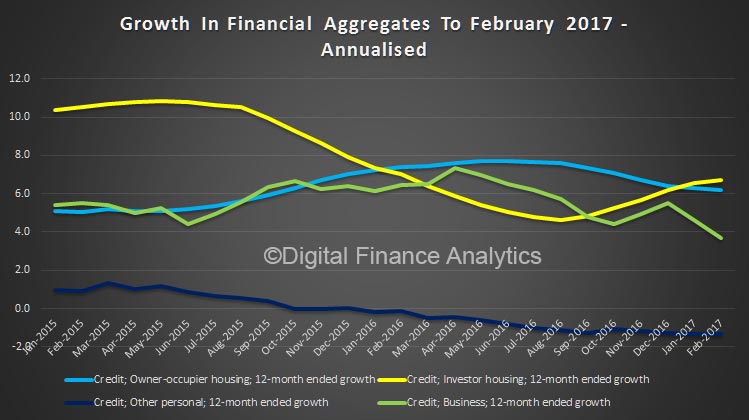
On a 12 month annualised basis, lending for investment housing grew the fastest at 6.7%, whilst owner occupied lending grew by 6.2% and there was a fall in business lending, down to 3.7%.

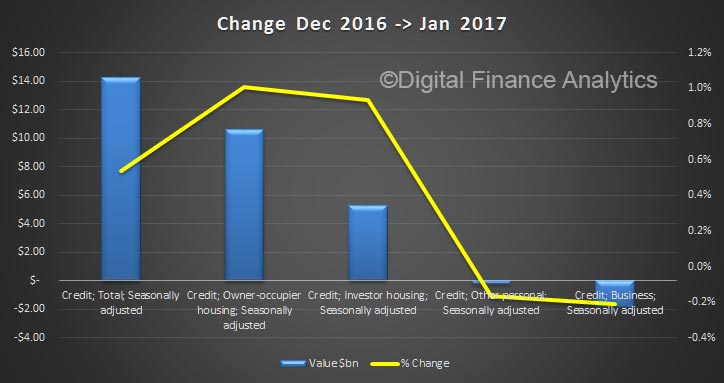
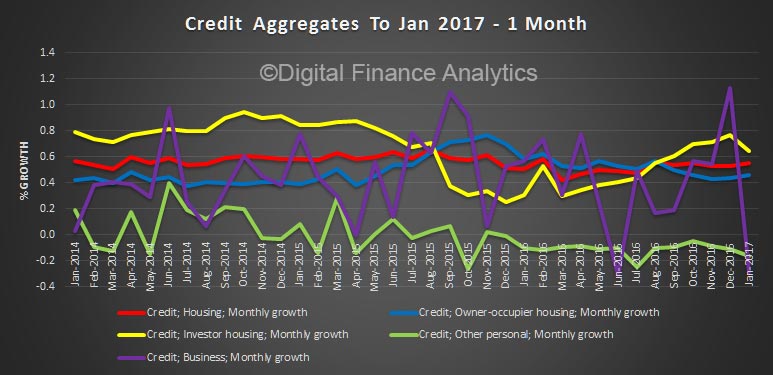
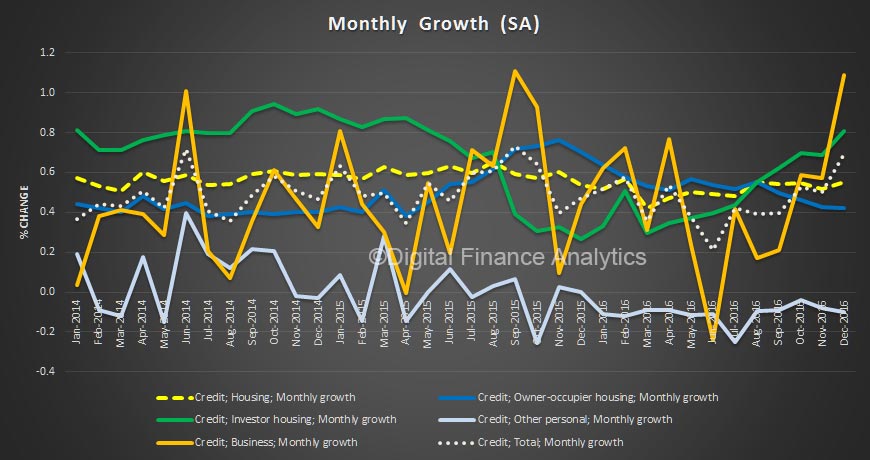
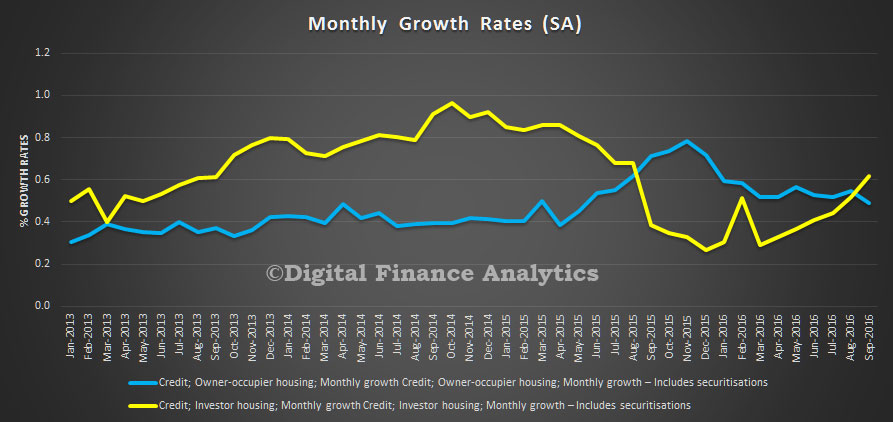
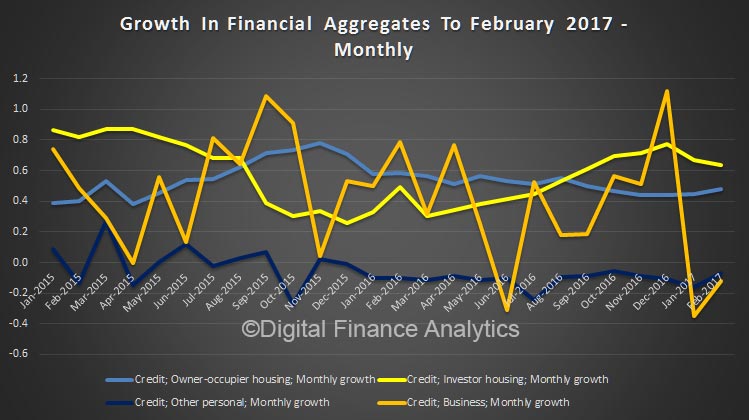
The monthly series showed that investor lending grew faster (0.6%) than lending for owner occupation (0.5%). Business lending took a dive and other personal credit was lower.

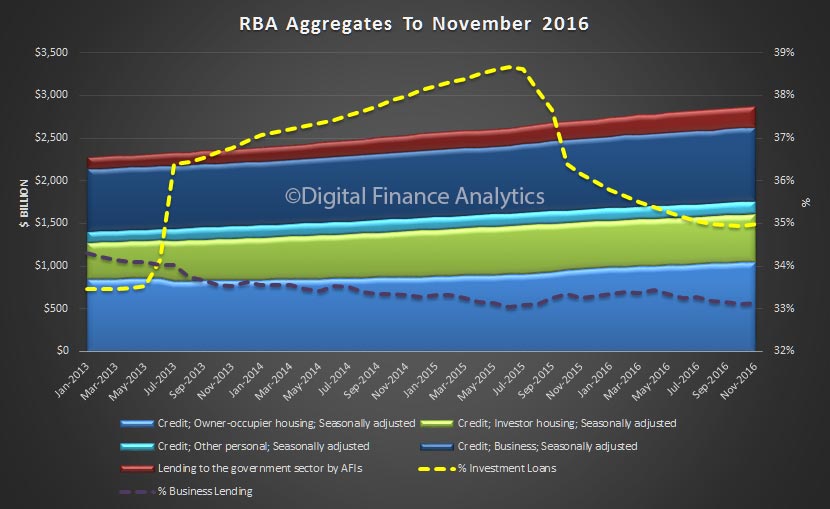
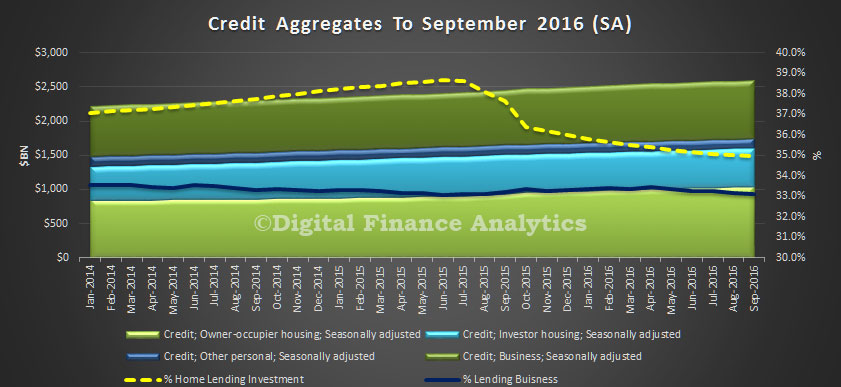
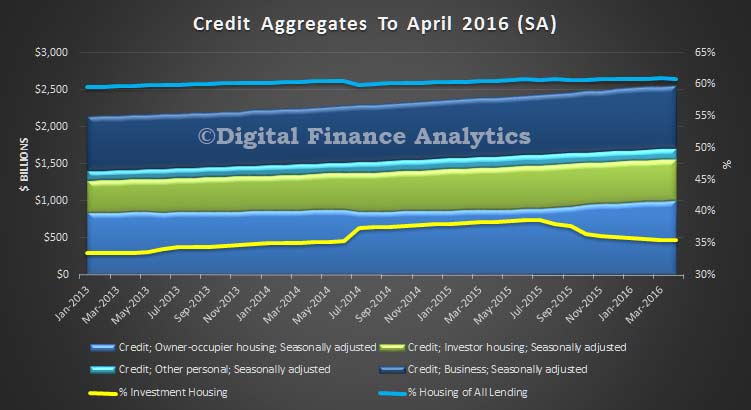
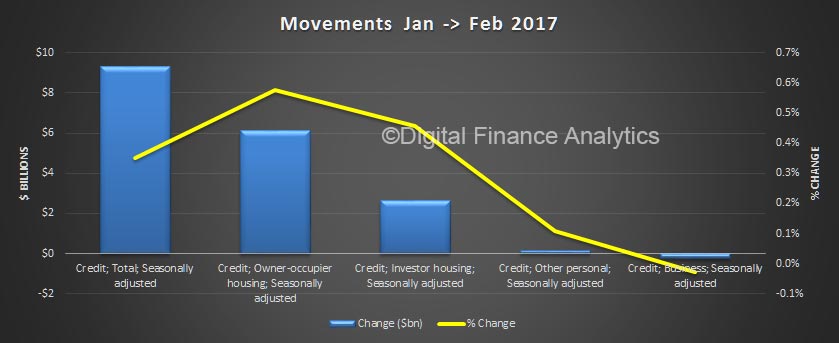
Turning to the month on month movements, (not RBA adjusted), owner occupied housing grew faster than investment lending.  In the month, owner occupied loans grew $9.3 billion whilst investment loans grew $2.6 billion, seasonally adjusted.

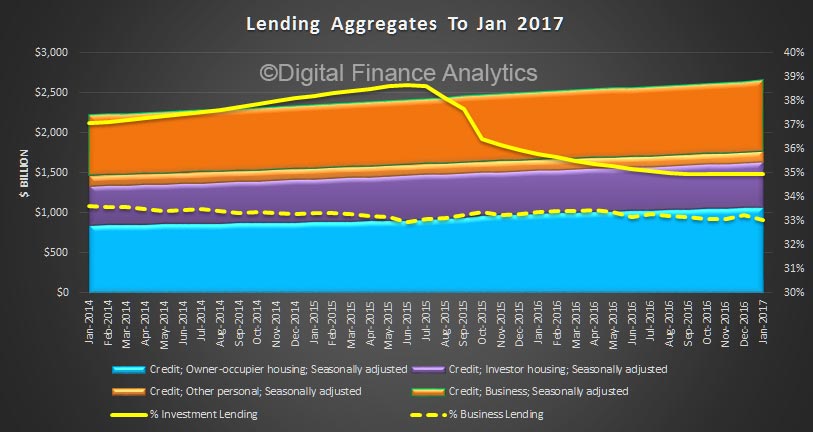
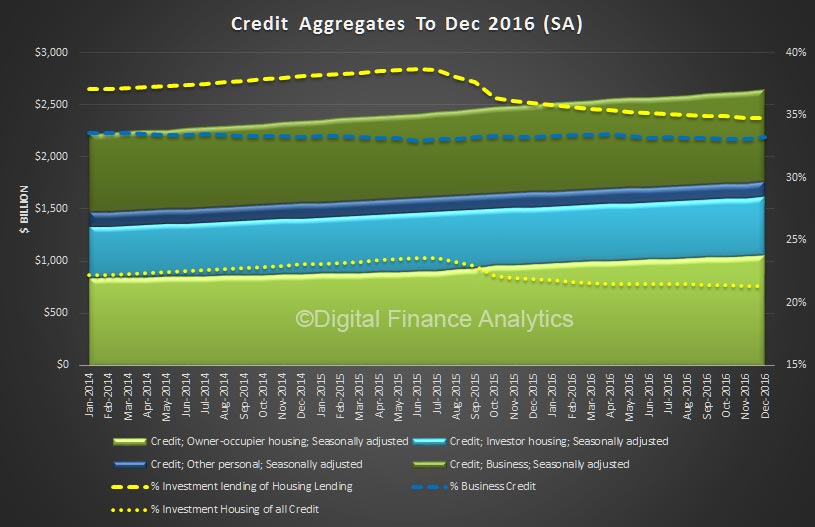
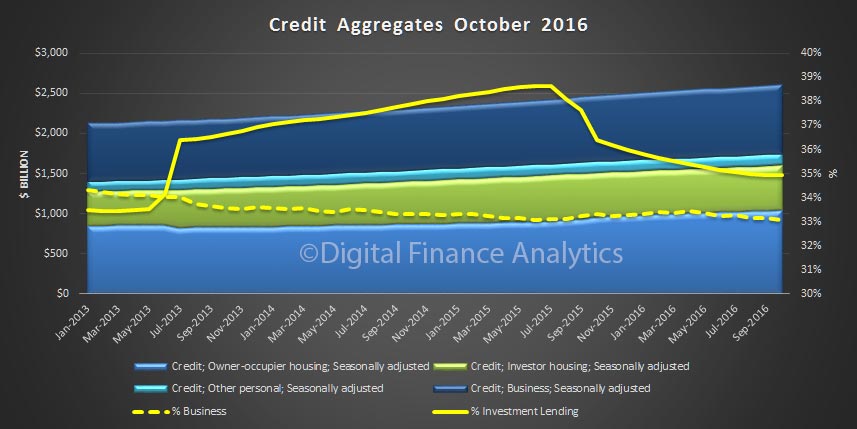
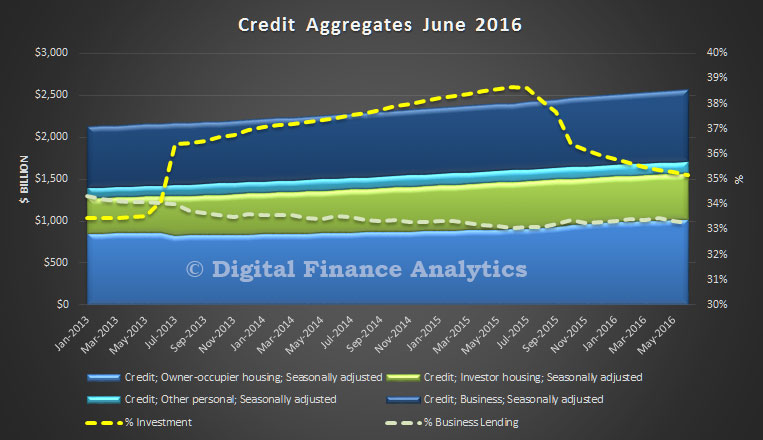
Finally, here is the total value lent by category. Total seasonally adjusted balances for housing was $1.64 trillion, of which investment lending comprised 32.9%, or $575 billion. Lending for owner occupation was $1.071 billion.

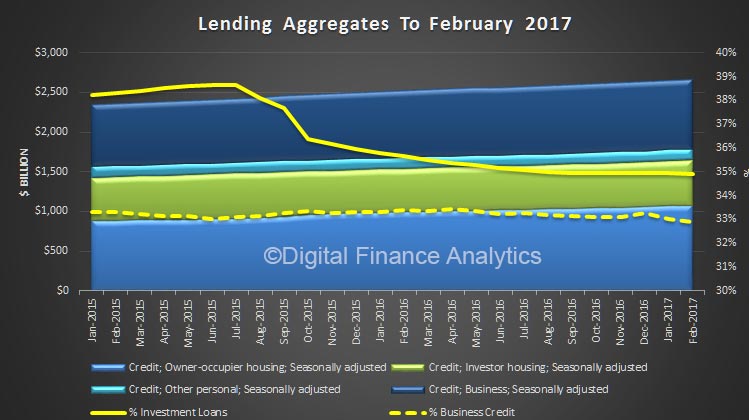
Lending for business, as a proportion of all lending fell again.

The RBA notes:

Following the introduction of an interest rate differential between housing loans to investors and owner-occupiers in mid-2015, a number of borrowers have changed the purpose of their existing loan; the net value of switching of loan purpose from investor to owner-occupier is estimated to have been $50 billion over the period of July 2015 to February 2017, of which $1 billion occurred in February 2017. These changes are reflected in the level of owner-occupier and investor credit outstanding. However, growth rates for these series have been adjusted to remove the effect of loan purpose changes.

We will discuss the APRA data which is also out today, in a separate post.  We doubt the changes by APRA announced today will have much impact on the market, although the continuing out of cycle rate hikes by the banks might.

The Fundamental Disconnect

You only have to look at the trends on housing credit growth and wage growth to see the problem. Using data from the ABS and RBA, we can see that in recent times credit to households for housing has been growing significantly faster than wage growth (note the two different scales) whereas in the 2000’s, before the GFC hit, wage growth was higher, and able to support such credit growth.  No wonder household debt is at a record high.

The other perspective is the cash rate, which has been cut to an all time low, and we see wage growth and rates trending in the same direction.

Whilst you can argue that lower rates means repayments are lower for many, the gearing effect of larger mortgages off the back of the home price boom, has created a major problem, with many households close to the edge at current low interest rates, and with low wage growth, no sign of this pressure relenting. Indeed, if rates rise (either officially or from market pressure) significantly more households will be stressed. Many will also struggle to pay off the capital.

These charts, together should have been a warning to regulators. The settings are wrong.

I think you can argue that we should be aiming for credit growth to match income growth, to stop the rot – but consider the impact on the banks (who rely on mortgage growth for profitability) home prices (a reduction in mortgage availability will force home prices lower) and housing affordability (credit rationing would lift the price of loans).

Even small adjustments might well create the conditions for a property market crash, with all the consequences that follow.

There is an old joke, when a driver stops to ask a local for directions, and the answer is “if I were you, I would not start from here”. The regulators have the same problem!

Lending Growth All About Housing

The latest RBA credit aggregate data shows that total lending grew in January 2017 by $14 billion, or 0.5%. Of that housing rose to $1,637.4 billion, up 1% or $15.2 billion. Business lending and unsecured personal finance fell. Clearly housing is where the action is, and given this data and strong clearances, home prices, especially in the eastern states are likely to continue to rise. It also explains the RBA’s recent comments and APRA’s tighter lending guidance. Household debt climbs ever higher, with the risks to match! No way can the RBA cut the cash rate on these numbers.

We see investment lending remained strong at $5.3 billion (0.9%) whilst owner occupied loans grew by $10 billion (1%). Investment loans were one third of all housing loans written.

The adjusted annual growth rates for housing loans was 6.4%, with owner occupied loans growing at 6.3% and investment loans 6.6%. Business lending was at 4.7% and personal credit a negative 1.3%.

The monthly movements are more noisy, but housing rose 0.5%, the same as a year ago.

The RBA notes:

All growth rates for the financial aggregates are seasonally adjusted, and adjusted for the effects of breaks in the series as recorded in the notes to the tables listed below. Data for the levels of financial aggregates are not adjusted for series breaks. Historical levels and growth rates for the financial aggregates have been revised owing to the resubmission of data by some financial intermediaries, the re-estimation of seasonal factors and the incorporation of securitisation data. The RBA credit aggregates measure credit provided by financial institutions operating domestically. They do not capture cross-border or non-intermediated lending.

Following the introduction of an interest rate differential between housing loans to investors and owner-occupiers in mid-2015, a number of borrowers have changed the purpose of their existing loan; the net value of switching of loan purpose from investor to owner-occupier is estimated to have been $49 billion over the period of July 2015 to January 2017, of which $1 billion occurred in January 2017. These changes are reflected in the level of owner-occupier and investor credit outstanding. However, growth rates for these series have been adjusted to remove the effect of loan purpose changes.

We will look at the APRA ADI data later.

Credit Growth Strong In December; But By How Much?

The RBA released their Credit Aggregates to December 2016 today.  Total housing was a new record at $1.62 trillion.

The headline statement from the RBA says housing grew 0.5% in the month and 6.3% annually, personal credit fell 0.1%, down 1.3% annually, and business credit role 1.1% in December, making 5.6% annually. All these are well above inflation, and wage growth.

Within housing, investment lending continued to grow up 0.8%, compared with 0.4% for owner occupied lending, making annual changes of 6.2% and 6.4% respectively.  So, once again we see growth in the investment sector moving up, which is in line with our surveys.

The monthly data shows the spike in both investment lending for housing and other business lending. This dataset, says the RBA has been adjusted for series breaks, to reflect as accurate picture as possible.

Now, things get interesting if we look at the more detailed data, which does not include series adjustments, although they are seasonally adjusted. Clearly there was further switching between loan categories.

Total lending for housing rose to $1.62 trillion, up $14 billion in the month. This is a new record and is up 0.88% from last month. On these figures, owner occupied loans grew 0.9% ($9.4 billion) and investment loans grew 0.84% ($4.68 billion). We see variations in the personal credit series too, with borrowing up 0.1% in the month, by $0.15 billion to $144 billion; business credit rose by 1.29% or $11.2 billion to $879.8 billion. But there is no way we can reconcile the two data series, so actually, we just have to take the RBA’s word on the figures – hardly open and transparent. Perhaps they prefer to paint the lower “adjusted figure” to support their view all is well in the housing lending sector, but it is mighty strange to have such varied outcomes.

We also see the proportion of housing lending for investment purposes remained at 34.8% of all lending, still too high in our view and the proportion of lending to business rose a little to 33.2% of all lending. We are still over leveraged into housing generally, and to investment housing in particular.

The RBA noted:

All growth rates for the financial aggregates are seasonally adjusted, and adjusted for the effects of breaks in the series as recorded in the notes to the tables listed below. Data for the levels of financial aggregates are not adjusted for series breaks. Historical levels and growth rates for the financial aggregates have been revised owing to the resubmission of data by some financial intermediaries, the re-estimation of seasonal factors and the incorporation of securitisation data. The RBA credit aggregates measure credit provided by financial institutions operating domestically. They do not capture cross-border or non-intermediated lending.

Following the introduction of an interest rate differential between housing loans to investors and owner-occupiers in mid-2015, a number of borrowers have changed the purpose of their existing loan; the net value of switching of loan purpose from investor to owner-occupier is estimated to have been $48 billion over the period of July 2015 to December 2016, of which $0.9 billion occurred in December 2016. These changes are reflected in the level of owner-occupier and investor credit outstanding. However, growth rates for these series have been adjusted to remove the effect of loan purpose changes”.

We will discuss the APRA monthly banking stats later.

Housing Credit Jumps Again

The RBA has released their credit aggregates to end November 2016.  Total credit for housing has now risen to $1.607 trillion, seasonally adjusted, up 0.5% in the month and 6.3% in the past year. Within that, investment lending was 35% of the total, up 0.68% whilst owner occupied loans rose 0.4%. So we see investment lending continuing to regain momentum and total credit growth is still running ahead of inflation and wages – so expect the household borrowing ratio to continue to climb.

Business lending was up 0.5% in the month, or 4.9% in the year, whilst personal credit continued to fall (ahead of Christmas) down 1.2% in the year to end November.

We see that share of investment mortgages on the rise, whilst the proportion of lending to business, to the total continues to fall.

There is still noise in the data. The RBA says:

All growth rates for the financial aggregates are seasonally adjusted, and adjusted for the effects of breaks in the series as recorded in the notes to the tables listed below. Data for the levels of financial aggregates are not adjusted for series breaks. Historical levels and growth rates for the financial aggregates have been revised owing to the resubmission of data by some financial intermediaries, the re-estimation of seasonal factors and the incorporation of securitisation data. The RBA credit aggregates measure credit provided by financial institutions operating domestically. They do not capture cross-border or non-intermediated lending.

Following the introduction of an interest rate differential between housing loans to investors and owner-occupiers in mid-2015, a number of borrowers have changed the purpose of their existing loan; the net value of switching of loan purpose from investor to owner-occupier is estimated to have been $47 billion over the period of July 2015 to November 2016, of which $0.9 billion occurred in November 2016. These changes are reflected in the level of owner-occupier and investor credit outstanding. However, growth rates for these series have been adjusted to remove the effect of loan purpose changes.


RBA Credit Aggregates Confirms Higher Home Lending Growth

The RBA have released their Financial Aggregates for October 2016. Housing grew 0.6%, making an annual rate of 6.4%, still well above inflation. Personal finance was static, whilst business lending rose 0.5% making an annual rate of 4.4% (in original terms).

Looking at the seasonally adjusted data set, investment lending is growing at 5.3% and rising, owner occupied lending is 7.1% and falling, business lending is growing at 4.4% and falling, and other personal finance is down 1.1%. Investment lending is the only element to rise.

rba-credag-oct-2016-pc

Looking at the detailed data, seasonally adjusted, owner occupied lending rose 0.54% in the month, by $6.6 billion, to $1.04 trillion, investment lending rose 0.59%, by $3.3 billion to $560 billion, and business lending rose 0.27%, by $2.3 billion to $864 billion.

rba-credag-oct-2016We see therefore a fall in the relative share of lending to business, compared with housing, and the momentum in investment housing stronger than owner occupied housing. Both signs of trouble ahead.  Investment lending is 35% of all housing, and business lending 33% of all banking lending.

There were further adjustments to loan classification in the month, just to confuse further. The RBA said:

Following the introduction of an interest rate differential between housing loans to investors and owner-occupiers in mid-2015, a number of borrowers have changed the purpose of their existing loan; the net value of switching of loan purpose from investor to owner-occupier is estimated to have been $46 billion over the period of July 2015 to October 2016, of which $0.8 billion occurred in October 2016. These changes are reflected in the level of owner-occupier and investor credit outstanding. However, growth rates for these series have been adjusted to remove the effect of loan purpose changes.

Home Lending Remains Strong In September To $1.6 Trillion

The RBA released their credit aggregates for September today.  Overall, lending for housing rose 0.5% to reach another record $1.6 trillion, up $8.6 billion. Within that, owner occupied lending rose 0.6%, up $6.1 billion and investment lending rose 0.4% or $2.5 billion. This is a slightly lower growth rate than a year back (7.5%), but is still strong, well above inflation and wage growth. This means household debts will continue to rise.

The monthly growth rate for investment mortgages shows a sharp move up, and from March 2016, as banks started to focus on lending to this sector. Lending for owner occupation growth rates fell a little, having peaked at the end of last year.

rba-aggregates-sep-2016-monthly-growthThe annualised analysis shows a tilt down, but if recent trends continue, this will reverse. This is hardly a good indicator that housing lending is under control. Indeed, we saw another high auction clearance rate at the weekend.

rba-aggregates-sep-2016-annual-growthIt is worth noting that there was $1bn of mortgages being switched between owner occupied and investment categories. The proportion of loans for investment purposes is still stitting at 35%. In addition, the proportion of lending to business continues to fall,  rising just 0.3% this month, or $2.9 bn. Lending for personal finance fell again, down 0.1%.

rba-aggregates-sep-2016The RBA said:

Following the introduction of an interest rate differential between housing loans to investors and owner-occupiers in mid-2015, a number of borrowers have changed the purpose of their existing loan; the net value of switching of loan purpose from investor to owner-occupier is estimated to have been $45 billion over the period of July 2015 to September 2016, of which $1.0 billion occurred in September 2016. These changes are reflected in the level of owner-occupier and investor credit outstanding. However, growth rates for these series have been adjusted to remove the effect of loan purpose changes.

Note we have used the seasonally adjusted data in our analysis. You can read our analysis of the companion  APRA monthly banking stats here.

Housing Credit Still On The Up

The June 2016 Credit Aggregates from the RBA, released today, shows that total lending for housing rose $6.6 billion or 0.42% in the month, making an annual rate of 6.7%, compared with 7.3% a year ago. Total loans outstanding for housing were $1,569 billion, another record.

Loans for investment housing rose by 0.1% or $0.6 billion, whilst lending for owner occupation rose 0.6% or $6.1 billion. Again we saw considerable shifts between owner occupied and investment loans in the month due to re-classifications, so there is still noise in the data. That said 35.1% of all housing loans are for investment purposes, down from 35.3% last month.

RBA-June-2016-1Business lending fell by 0.11% seasonally adjusted, or $0.9 billion, giving an annual growth rate of 6.6%, up from 4.4% last year. However, the proportion of lending for business fell again to 33.2% of all loans, a worrying continued falling trend. Personal credit also fell a little.

RBA-June-2016-2

Still we see more lending for housing rather than to business. Not good news for the economic outlook.

The RBA notes

Following the introduction of an interest rate differential between housing loans to investors and owner-occupiers in mid-2015, a number of borrowers have changed the purpose of their existing loan; the net value of switching of loan purpose from investor to owner-occupier is estimated to have been $42 billion over the period of July 2015 to June 2016 of which $1.3 billion occurred in June. These changes are reflected in the level of owner-occupier and investor credit outstanding. However, growth rates for these series have been adjusted to remove the effect of loan purpose changes.

Home Lending Accelerates In May To Another Record

The RBA released their Financial Aggregates for May 2016. Total housing grew by 0.5% in May, compared with 0.4% in April. Business lending grew by 0.3%, compared with 0.8% in April. Personal credit fell again by 0.1%. Housing lending overall lifted by $7.5bn, of which $6.5 bn was for owner occupation and $0.9bn for investor loans. Total housing loans are now $1.56 trillion, another record and comprise 61% of all loans outstanding.

May-Credit-Agg-2016Annual growth rates for home lending is 6.5%, compared with 6.2% in May 2015, Business was 7.1%, compared with 5.3% last year, and Personal lending was down 1.1% to May 2016, compared with up 1.1% this time last year.

May-Credit-Agg-Growth--2016A further $1.1 bn of loans were switched between owner occupied and investment housing loan categories.

Following the introduction of an interest rate differential between housing loans to investors and owner-occupiers in mid-2015, a number of borrowers have changed the purpose of their existing loan; the net value of switching of loan purpose from investor to owner-occupier is estimated to have been $41 billion over the period of July 2015 to May 2016 of which $1.1 billion occurred in May. These changes are reflected in the level of owner-occupier and investor credit outstanding. However, growth rates for these series have been adjusted to remove the effect of loan purpose changes.

Home Lending Rises Again To New Record $1.56 trillion

Latest credit aggregate data from the RBA today, shows lending momentum to business and the housing sector remained strong. As a result, total lending to residential property rose by $6.7 billion or 4.3% to $1.56 trillion, seasonally adjusted, with loans for owner occupation comprising $6.0 billion and $0.7 billion for investment housing. Business lending rose by $6.5 billion, or 0.76% to $854 billion. Housing lending is still growing at 7% annualised, well above inflation and income growth. This is sufficient to maintain home price growth.

Investment lending makes more than 35.4% of all lending for housing, and all lending for housing comprises more than 60% of all lending in Australia. So the banks remain strongly leveraged to the housing sector.

RBA-Credit-Aggregates-Apr-2016Looking at the 12 month growth rates, we see investment lending sliding from about 10% last year to around 6.5%, business lending growing at 7.4% and lending for owner occupation growing at 7.3%. These growth trends contain the adjustments between owner occupied and investment lending due to reclassification.

Apr-2016-Credit-Growth-RBA-PCThe RBA says:

Following the introduction of an interest rate differential between housing loans to investors and owner-occupiers in mid-2015, a number of borrowers have changed the purpose of their existing loan; the net value of switching of loan purpose from investor to owner-occupier is estimated to have been $40 billion over the period of July 2015 to April 2016 of which $1.2 billion occurred in April. These changes are reflected in the level of owner-occupier and investor credit outstanding. However, growth rates for these series have been adjusted to remove the effect of loan purpose changes.