OO Home Lending Drives Mortgages To A Record $1.55 Trillion

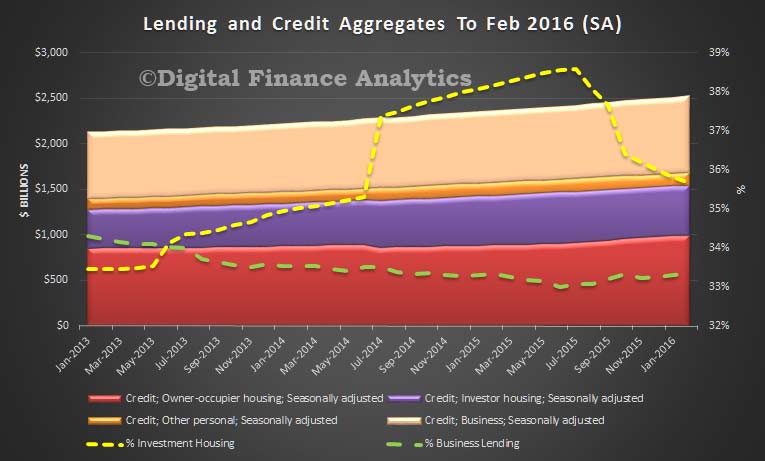
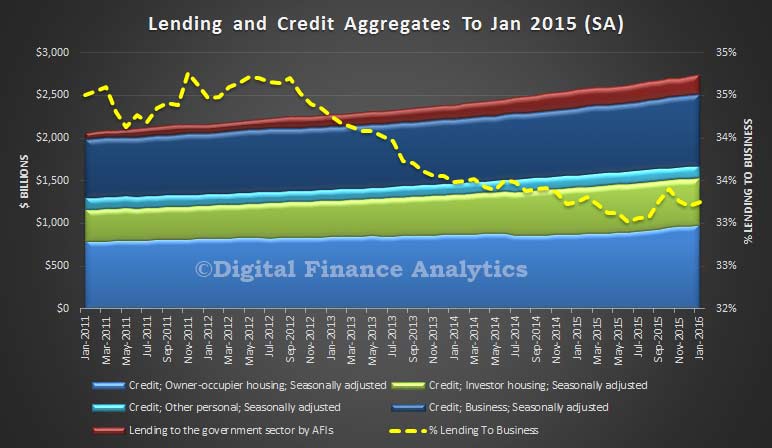
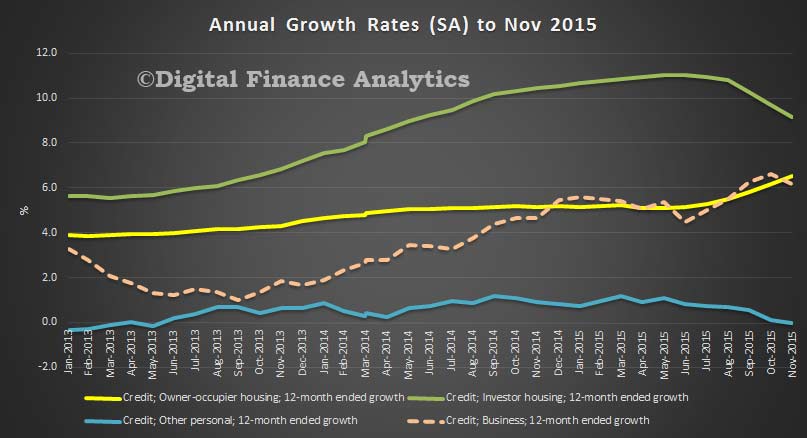
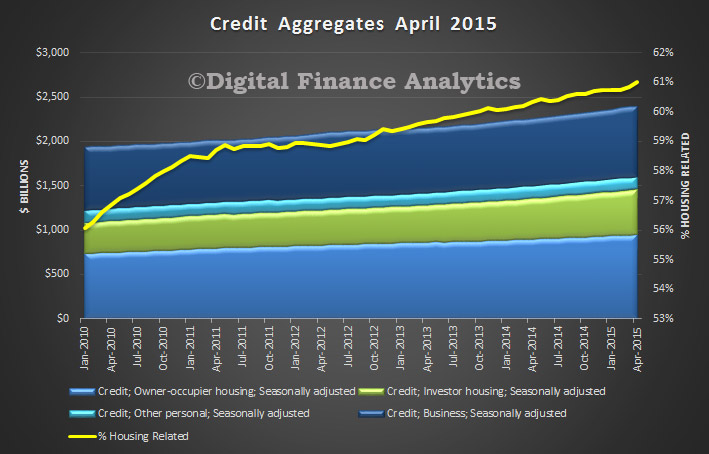
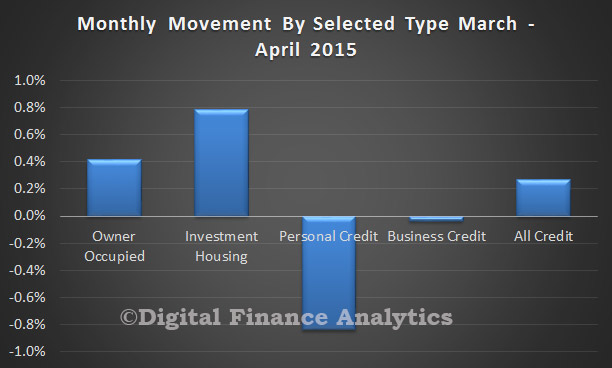
The RBA released their credit aggregates to end March today.  Housing lending grew 0.5% in March and reflects an annual rate of 7.2% – well above inflation! Business credit grew by 0.3% or $2.6 billion (annualised 6.5%) and personal credit fell 0.3% or $0.6 billion, and represents an annualised fall of 1%. We are still not seeing real relative growth in the important business investment sector.

RBA-March-2016-Aggregates
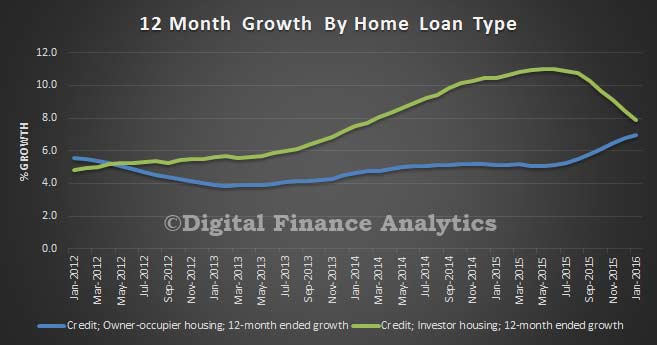
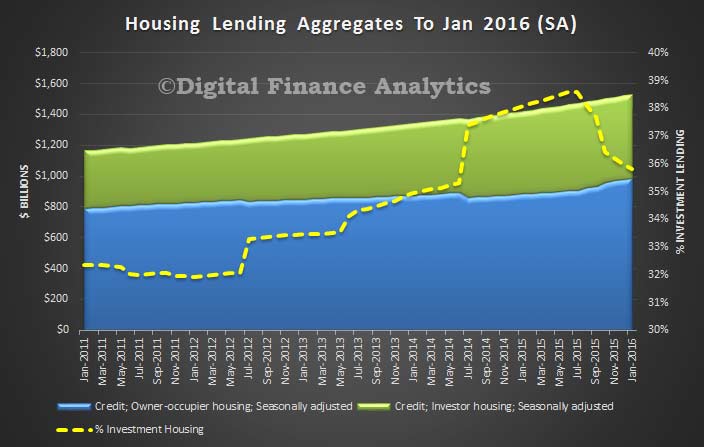
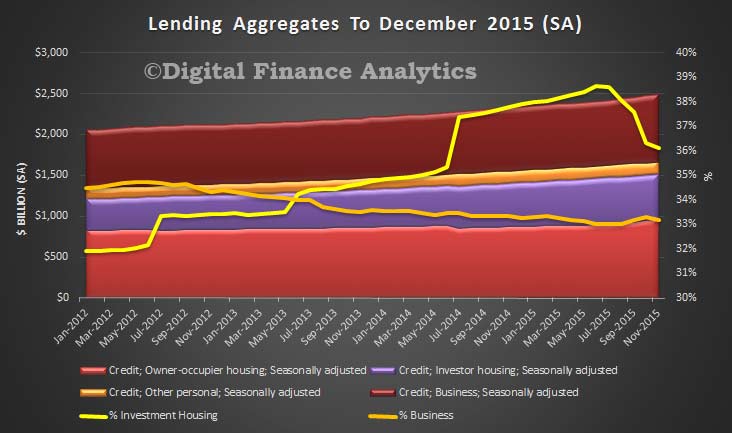
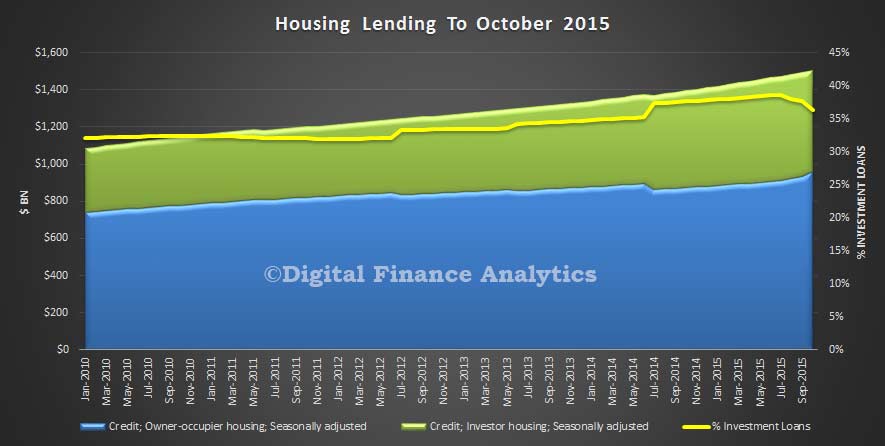
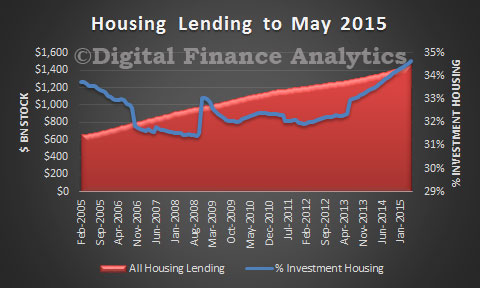
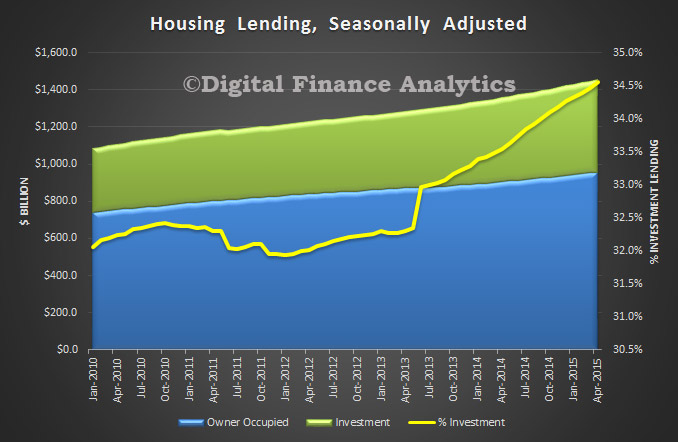
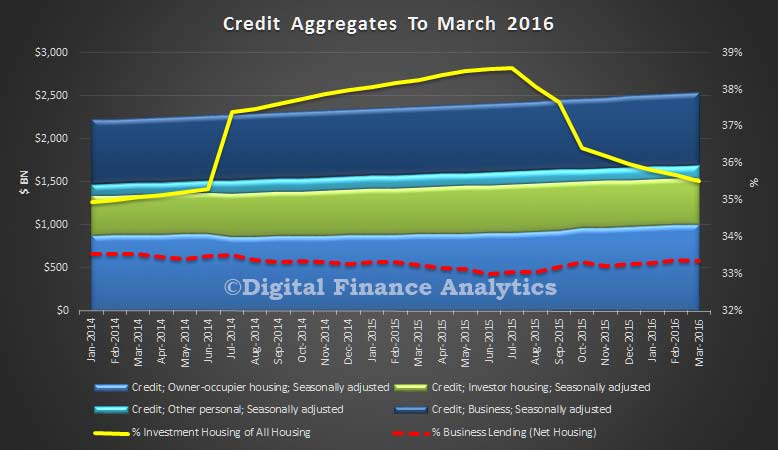
So, housing momentum is driving banks lending books. Seasonally adjusted lending for owner occupation grew 0.76%, or $7.5 billion, whilst lending for investment homes grew just 0.08%. Total growth was 0.5% or $7.7 billion to a new record of $1,547.6 billion.  One third of loans are for investment purposes, though there is still some movement and reclassification. The RBA says:

Following the introduction of an interest rate differential between housing loans to investors and owner-occupiers in mid-2015, a number of borrowers have changed the purpose of their existing loan; the net value of switching of loan purpose from investor to owner-occupier is estimated to have been $39 billion over the period of July 2015 to March 2016 of which $1.5 billion occurred in March. These changes are reflected in the level of owner-occupier and investor credit outstanding. However, growth rates for these series have been adjusted to remove the effect of loan purpose changes.

Such strong growth in home lending will make the RBA pause for thought before they cut the cash rate again – household debt continues to sky rocket, at a time when incomes are static. Not a good formula for enduring financial stability. Cutting rates will have little impact on personal credit (which is still falling) or business borrowing (driven more by confidence and future prospective growth). This should temper the knee-jerk calls for a cut following the lower than expected inflation number earlier in the week.

We will post separately on the APRA numbers, also released today.

Housing Lending Up To New Record $1.54 trillion

The latest data from the RBA showing the monthly credit aggregates shows that home lending continues to grow, in both the owner occupied and investment property arena.  Non banks are more active. Total lending for housing was a seasonally adjusted $1541.2 billion, up $8.6 billion, or 0.56%. This equates to an annual rate of 7.3%, well above inflation, and income growth. Within that, lending for owner occupation rose $7.6 billion, or 0.77%, whilst lending for investment property rose $1.0 billion or 0.19%.

Credit-Aggregates-Feb-2016Investment housing comprised 35.7% of all loans outstanding, a small fall from last month, but still a large number and higher than it should be.

Business lending rose 0.71% or $5.9 billion, to $844 billion, and comprises 33.4% of all lending, still lower than the 34.3% in 2013. So the slew towards lending for housing still remains.  This equates to 6.5% annual growth.

Banks still prefer to lend for housing than to productive businesses.

Personal credit hardly moved, with a small fall of 0.37%, to $145.4 billion.

The normal caveats apply with regards to the home lending data, with $1.9 billion of adjustments made in February. “Following the introduction of an interest rate differential between housing loans to investors and owner-occupiers in mid-2015, a number of borrowers have changed the purpose of their existing loan; the net value of switching of loan purpose from investor to owner-occupier is estimated to have been $37.3 billion over the period of July 2015 to February 2016 of which $1.9 billion occurred in February. These changes are reflected in the level of owner-occupier and investor credit outstanding. However, growth rates for these series have been adjusted to remove the effect of loan purpose changes”.

We will discuss the APRA monthly banking data in our next post. But according to APRA, total lending to the banks for housing was $1,432 billion, so the rest – $109.4 billion is the non-bank sector, and this represents a 1.38% rise (up $1.49 billion) compared with last month. So one important observation is the non-bank sector is now growing their mortgage loan books faster than the banks. This is a worrying sign.

Housing Lending Still Grows – Now $1.53 Trillion

The RBA credit aggregates released today to end January 2016, shows that there is still momentum in home lending – centered of course around refinancing.

Growth-Housing-Aggregates-Jan-2016Total home lending was up 0.53% in the month, and $8bn was for owner occupied lending. Investment lending went sideways, but note also though that there were further adjustments between OO and investment loans.

“Following the introduction of an interest rate differential between housing loans to investors and owner-occupiers in mid-2015, a number of borrowers have changed the purpose of their existing loan; the net value of switching of loan purpose from investor to owner-occupier is estimated to have been $35.3 billion over the period of July 2015 to January 2016 of which $1.4 billion occurred in January. These changes are reflected in the level of owner-occupier and investor credit outstanding. However, growth rates for these series have been adjusted to remove the effect of loan purpose changes”.

Housing-Aggregates-To-Jan-2016As a result, the proportion of loans for housing investment purposes has fallen a little further, from 35.98% to 35.8%, but this is still a big number.

Turning to the overall aggregates, home lending was up 0.53%, business lending rose 0.63% and personal credit fell 0.79% as households paid off their Christmas binge.

Lending-Aggregates-To-Jan-2016 Business investment remains at a relative low level, with one third of all lending going to business, once again showing how debt to households is being relied on to grow the economy.

We know from our own analysis that significant numbers of households would find any rise in interest rates a big problem, and loading up households further with ever more debt is a flawed strategy. When are we going to get serious about getting real long term growth via business investment?

We will discuss the parallel APRA data, also released today, later.

Home Lending Up in December 2015 to $1.52 trillion

The RBA Credit Aggregates for December, released today, shows a continued rise in lending for housing, up 0.7% in the past month seasonally adjusted by $10.6 bn to $1.52 trillion. This includes all lending, including non-banks, seasonally adjusted. There are no reported series breaks this past month, so no abnormal shifts between investment and owner occupied loans . This is a rise of 7.1% over the past year.

RBA-Dec-2015The splits between owner occupied and investment lending shows that loans for owner occupation rose $10 bn, up 1.1%, to $967.7 billion. Loans for investment purposes also rose – just 0.09% or $0.49 billion to $546 billion, so investors are still in the market. The proportion of loans on book relating to investment lending has fallen again, to 36.1% from a high of 38.6% last year. This is still a big number, and higher that the levels which were thought to be a concern (as expressed by the regulators) last year, before recent swapping between categories. Remember the Bank of England is worried by their 16% share of investment loans – in Australia it is much higher!

Personal credit has fallen again, down 0.2% to $148 billion. But lending for business was only up 0.11%, or $0.94 billion to $826 billion. This represents a low 33.2% of all lending, down from 33.3% last month, and down from 34.7% in 2012. This continues to highlight the lack of investment in the grown engine of the economy – business – as compared to the easy money going towards housing. Structurally, we continue to have a problem, as housing growth is not productive and cannot lead to the right economic outcomes. Remember this is with interest rates at rock bottom.

We will review the APRA ADI data later.


Owner Occupied Lending Drives Housing Loans To New High of $1.51 Trillion

The RBA released their November Credit Aggregates. Total housing loans (SA) reached $1.51 trillion up 0.7%, thanks to growth of 1.05% in owner occupied loans, whilst loans for investment property grew by just 0.09%. Total owner occupied loans totalled $968 billion, and investment loans $548 billion, so investment loans now comprise 36.1% of all loans on book (from a high of 38.6% in July). We need to be a little cautious, as further adjustments were made in the classifications. The RBA tell us that “following the introduction of an interest rate differential between housing loans to investors and owner-occupiers in mid-2015, a number of borrowers have changed the purpose of their existing loan; the net value of switching of loan purpose from investor to owner-occupier is estimated to have been $32.5 billion over the period of July 2015 to November 2015 of which $1.9 billion occurred in November. These changes are reflected in the level of owner-occupier and investor credit outstanding”.

CreditRBANov2015Of note is the relative movement in business lending, which was 33.2% of all loans, to $826 billion, up 0.11% in the month. Business lending is still restrained, compared with lending for property, the latter unproductive, and simply stoking household debt. Productive lending for growth is under pressure. Personal credit fell again to $147.9 billion, down 0.2%.

Looking at the 12 month growth figures, investment lending is now below the 10% speed limit, at 9.1%, whilst owner occupied loans are at 6.5%, the highest rate for 6 years (Feb 2011).

CreditGrowthRBANov2015

Housing Lending Up Again In October to $1.5 trillion.

The latest RBA credit aggregates for October 2015, released today are not easy to interpret because of the myriad of adjustments.   Housing loans have more reached $1.5 trillion, another record.  But are these numbers trust-worthy?

At the aggregate level, total credit rose a seasonally adjusted 0.61% in the month, or 6.11% in the past year. Lending to business grew 0.84% in the month, and 5.88% in the last year. Business lending as a proportion of all lending sits at 33.2%, from an all-time low of 32.9% in July, but clearly business investment continues to be constrained. Housing grew 0.58% in the month, and 7% in the past year, whilst personal credit fell 0.89% in the month and 0.27% in the year, a sign that households remain cautious.

Credit-Aggregates-Oct-2015Turning to housing finance in more detail, and this is where it get complex; lending for owner occupied loans rose 2.62% in the month, representing 9.41% growth in the past year, while investment lending fell 2.8% in the month, and grew 3.03% in the year. But there are so many adjustments in these numbers, as the banks reclassify more loans, thanks to a combination of internal review, and customer request. Specifically, the differential movement in investment loans is making people check their loans are correctly classified, and RBA estimates $30bn of loans have been switched. Investor loans on book comprise 36.35% of all housing, down from its recent heights of 38.55% in July. The only thing we can be sure of is the numbers will move again next month. I discussed the recent RBA comments on this issue recently.

Housing-Aggregates-Oct-2015The RBA makes the following caveats:

All growth rates for the financial aggregates are seasonally adjusted, and adjusted for the effects of breaks in the series as recorded in the notes to the tables listed below. Data for the levels of financial aggregates are not adjusted for series breaks. Historical levels and growth rates for the financial aggregates have been revised owing to the resubmission of data by some financial intermediaries, the re-estimation of seasonal factors and the incorporation of securitisation data. The RBA credit aggregates measure credit provided by financial institutions operating domestically. They do not capture cross-border or non-intermediated lending.

Following the introduction of an interest rate differential between loans to investors and owner-occupiers a number of borrowers have changed the purpose of their existing loan; the net value of switching of loan purpose from investor to owner-occupier is estimated to have been $30.6 billion over the period of July 2015 to October 2015. These changes are reflected in the level of owner-occupier and investor credit outstanding. However, growth rates for these series have been adjusted to remove the effect of loan purpose changes.

The APRA ADI data is also out today, and we will look at this later.

Housing Lending Higher Again in July to $1.48 Trillion

The latest RBA credit aggregates to end July 2015 show continued momentum in the home lending sector, up 7.4% in the year to July, compared with business lending up 4.8% and personal credit up 0.9%. Lending for housing comprised more than 60% of all lending on the books. 23.5% of all lending goes to investment housing. As APRA said recently, we hope it is as “safe as houses“. Total lending for housing is a seasonally adjusted $1,476.1 billion, up $8.5 billion, up 0.58% on the previous month.

RBACreditAggregatesJuly2015We need to point out that the various restatements by the banks (including NAB and ANZ), especially between the owner occupied and investment categories has had quite an impact on the numbers.  In the month, lending for investment grew 3.6bn, up 0.64% to $569.8 billion in the month, whilst owner occupied lending grew 4.9 billion to $906.4 billion, up 0.54%. Overall growth for investment lending was an adjusted 10.2% on total balances. This includes both ADI’s and others lenders. However, there was a significant movement shown from July 2014, where the restatements kick in, and we see that on the old basis investment housing was 36.2% of all lending for housing, whereas on the new basis, it has now risen to 38.6%. A sizable change. A record, and given the intrinsically higher risks in investment loans, a concern.

RBAHousingAggregatesJuly2015Given all the noise in the numbers, it is hard to conclude other than home investment lending remains buoyant – in line with the DFA household surveys and expectations. We will report on the APRA monthly banking stats shortly, were individual bank movements can be analysed.

Home Lending Rose to $1.47 Trillion in May

The RBA lending aggregates for May 2015 tell the ongoing story of housing lending dominated by investment loans, and housing becoming an ever larger proportion of total bank debt. Total bank lending stock grew to $2.4 trillion in May, with $1.47 trillion in housing, growing at 0.42% in the month, business lending up 0.35% to $792 million and personal lending (excluding housing) down a little to $141 million. Overall housing lending was 61.1% of all bank lending (excluding government loans) – an all time high.

Lending-May-2015-RBALooking more closely at housing, the $1.47 trillion was split into owner occupied lending of $958 million, up 0.42% in the month, and investment lending of $508m, up 0.81%, showing again the disproportionate focus on investment property.

Housing-Lending-May-2015-RBAWe can but reiterate our two key points. First, housing lending is squeezing out productive lending to business, and in so doing continues to inflate banks balance sheets, and house prices, neither productive economically speaking; whilst business finds it hard to get the support it needs to create productive growth. In the context of a mining slow down, this is a serious problem, which will not be addressed by $20k capital write-offs. Capital rules favour home lending too much.

Second, the distortions created by ever larger bands of property investors, makes it harder for younger families to buy a home – indeed many are going direct to the investment sector in a bid to get a look in. However, those who analyse relative risks in an investment portfolio versus an owner occupied portfolio indicate there are higher risks in the investment pools, especially in a down turn. These risks are not recognised by the current Basel rules, and such risks are not currently priced into investment loans.

The data so far does not demonstrate any impact from the “tighter” APRA rules for investment lending, maybe next month? Even if one or two banks slow their investment lending growth rates and tighten their underwriting criteria, others will happily step in.

Total Housing At Record $1.46 Trillion in April

The latest data from the RBA, Credit Aggregates to end April 2015, shows that lending for investment property pushed higher again, whilst lending to business went backwards. Looking at the splits, overall housing credit was up 0.54% seasonally adjusted to $1.46 trillion, with owner occupied lending up 0.41% to $954 billion and investment lending up 0.79% to $503 billion. Personal credit fell 0.84% to $141 billion and lending to business fell 0.04% to $790 billion. As a result, the percentage of lending devoted to housing rose to 61% of total (excluding lending to government), up from 56% in 2010.

RBACreditAggretagesApril2015Tracking the relative monthly movements, highlights the concentration in the housing, and specifically the investment housing sector. We will see if recent moves by APRA and the banks tames the beast in the months ahead.

RBAAggregateMovementApril2015Looking at the housing data, the proportion of the portfolio in the more risky housing investment sector rose again, to 34.6%.

RBAAggregatesApril2015HousingFurther evidence of the unbalanced state of the economy.