Credit resurgence could have ‘undesirable’ impact

The fall in interest rates and an easing of lending standards will “breathe life” into the property market, but not without consequences, according to Moody’s Analytics, via The Adviser.

Financial intelligence agency Moody’s Analytics has released its Second Quarter 2019 Housing Forecast Report, in which it has noted its outlook for the Australian housing market.

Drawing on CoreLogic’s Hedonic Home Value Index, the research agency noted the correction in residential property prices, which it said was “a long time coming” after a “strong run-up” in values across more densely populated markets, particularly in Sydney and Melbourne.

However, Moody’s has observed that while residential home prices have moderated from their peak in September 2017, the decline has not led to a “material” improvement in housing affordability, with values still 20 per cent higher than during the pre-boom period in 2013.

Nonetheless, Moody’s has reported that it expects the Reserve Bank of Australia’s (RBA) cut to the official cash rate and proposals to ease home loan serviceability guidelines from the Australian Prudential Regulation Authority (APRA) to rekindle demand for credit and spark activity in the housing market.

“An important driver of the slowdown in Australia’s housing market has been tighter credit availability, partly as a consequence of the regulator – the Australian Prudential Regulation Authority – tightening lending conditions, which has made it relatively more difficult to purchase a property, particularly for investors,” Moody’s noted.

“These serviceability requirements were eased in May.

“Expectations of further lending reductions flowing on from RBA cash rate reductions will also breathe life into the property market and add weight to our view that the national housing market will reach a trough in the third quarter of 2019 and gradually improve thereafter.”

However, Moody’s warned that a resurgence in the housing market activity could further expose the economy to risks associated with high levels of household debt.

“This could see the household leverage-to-GDP ratio climb, making Australia stand out further amongst its peers,” Moody’s stated.

“This is an undesirable position to be in, particularly given the questions around sustainability of the potentially rising debt load.”

Moreover, recent changes in the regulatory landscape have been interpreted by some observers as as a sign that the economy could be at risk of falling into recession amid growing internal and external headwinds.

Treasurer Josh Frydenberg recently acknowledged that “international challenges” could pose a threat to the domestic economy.

Fears of a looming recession have prompted some observers, including the CEO of neobank Xinja, Eric Wilson, to encourage borrowers to pocket mortgage rate cuts passed on following the RBA’s decision to lower the cash rate.

Mr Wilson claimed that resisting the urge to accrue more debt would help borrowers build a buffer against downside risks in the economy.

The Australian Bureau of Statistics’ (ABS) Australian National Accounts data for the quarter ending March 2019, reported GDP growth of 0.4 per cent, with annual growth slowing to 1.8 per cent – the weakest since September 2009.

However, Moody’s economist Katrina Ell has said she expects the RBA’s monetary policy agenda to help revive the economy.

“The combination of increased monetary policy stimulus, expectations of the housing market reaching a trough in the third quarter of 2019, and fiscal policy playing a relatively supportive role including via income tax cuts should boost GDP growth to 2.8 per cent in 2020,” Ms Ell said.

Weaker Credit Impulse Signals More Home Price Falls, Despite New Record Debt

On the last working day of each month the RBA releases their Credit Aggregates and APRA their Monthly Banking Statistics for ADS‘s. Both are now out for March.

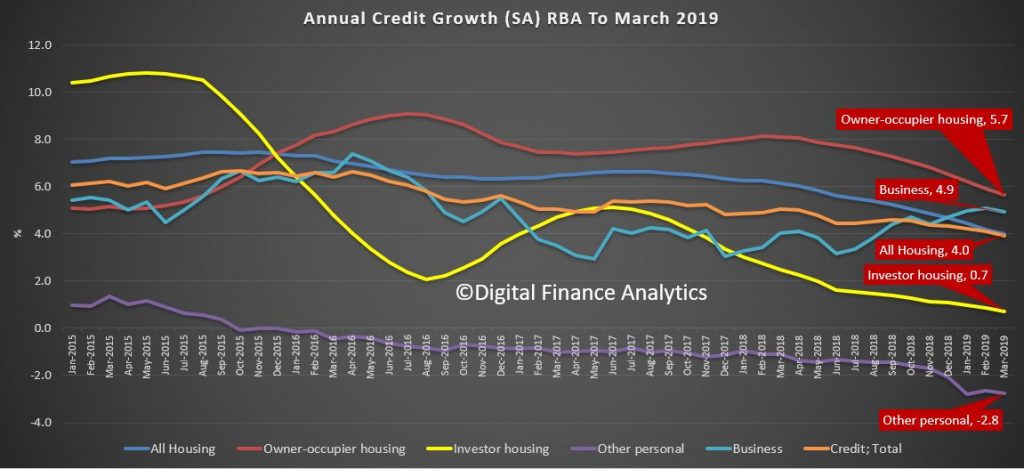
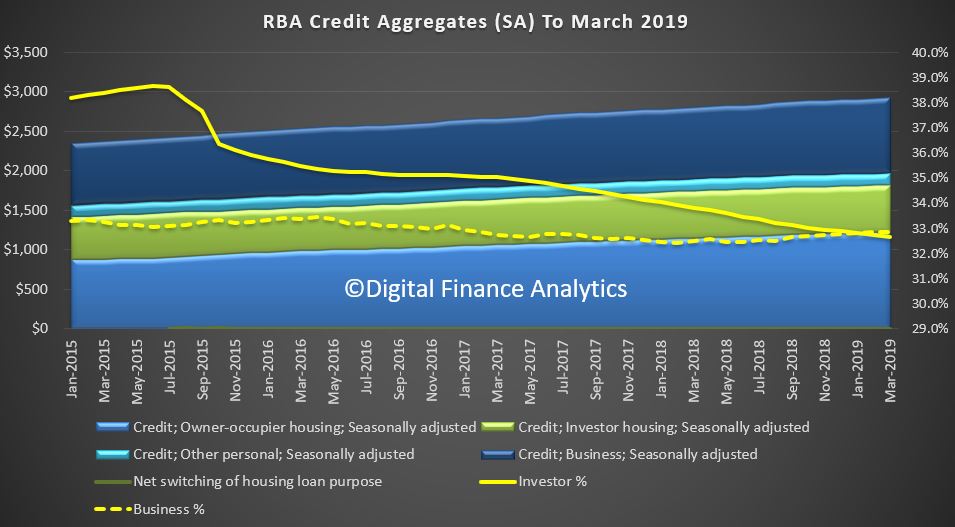
The headline news is the overall housing credit is up, to a new record of $1.82 trillion dollars up 0.31% from last month, or 0.31%. Within that owner occupied lending rose 0.32% to $1.22 trillion dollars and investment lending was flat. 32.7% of lending stock is for investment lending purposes, a slight fall from last month, whilst business lending as a proportion of all lending rose from 32.9% from 32.8% to reach $963.7 billion dollars. Personal credit fell 0.27% or $0.4 billion, to $147.1 billion, and continues to fall.

The annualised movements by category shows further weakness, with lending for owner occupied housing now at 5.7%, investment housing lending at 0.7%, giving housing overall growth of just 4% (though still higher than wages growth I would add). Personal credit fell 2.8% over the past year, while business lending rose 4.9% annualised. All these figures are on a seasonally adjusted basis

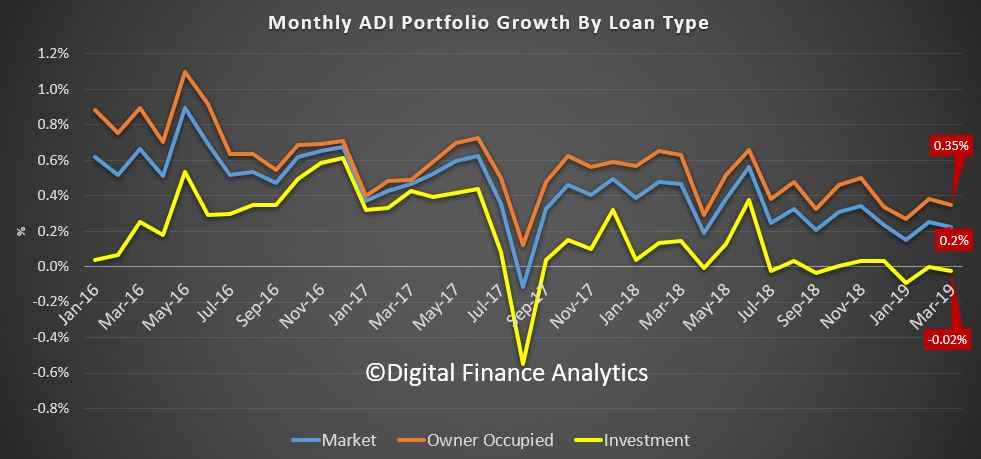
Turning to the APRA data on the banks, owner occupied lending rose 0.35% in March, while investment lending fell by 0.02%, giving total credit growth of just 0.2%. Over the past year owner occupied loans grew by 4.8% (compared with 5.7% at the aggregate level) and investor loans grew 0.4% (compared with 0.7% at the aggregate level). So the banks loan portfolios are growing more slowly than the market.

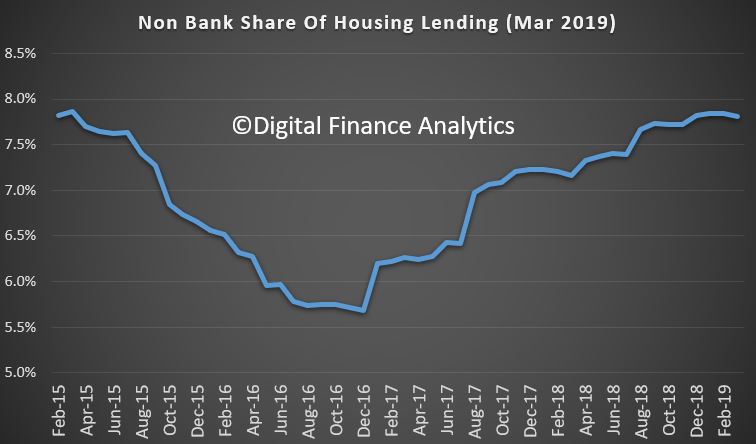
This can be illustrated by comparing the RBA and APRA data (warts and all) to show the non-bank sector is growing faster than the banks. Overall, they have over 7.5% of the market, which is up from the low in December 2016.

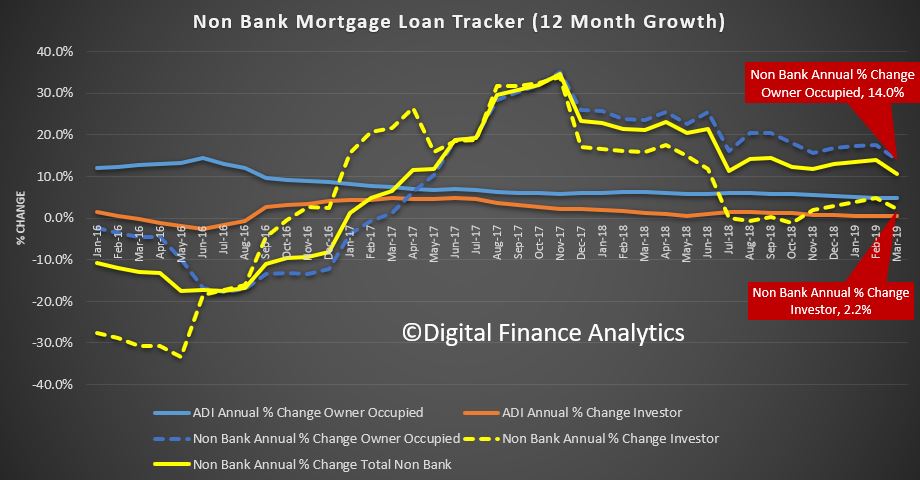
In addition, the rate of growth is significantly higher than the banks. Non-bank owner occupied loans are growing at an annual rate of 14%, while investment loans are 2.2%; both significantly higher than the ADI’s. Non-banks have weaker regulation, and more ability to lend. APRA has yet to truly engage with the sector.

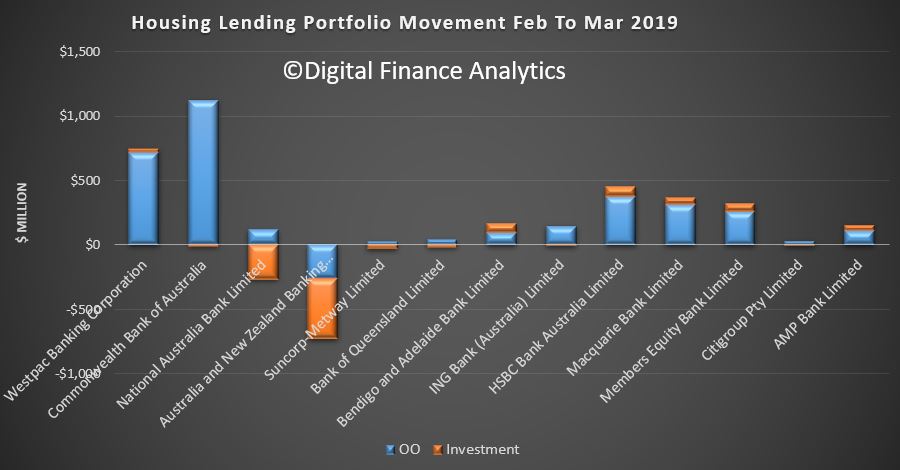
Turning back to the individual lenders, the changes in their portfolios over the month show that Westpac and CBA offered the most new owner occupied loans, while ANZ dropped back, on both owner occupied and investment loans, while NAB dropped investment lending. HSBC, Macquarie and Member Equity Bank (ME) lend more than the regionals.

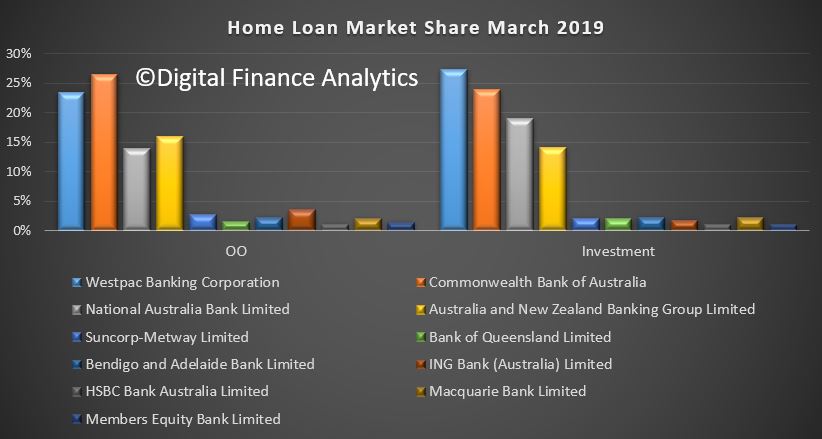
Overall market shares hardly moved, with CBA still the largest owner occupied lending, and Westpac the biggest investor lender.

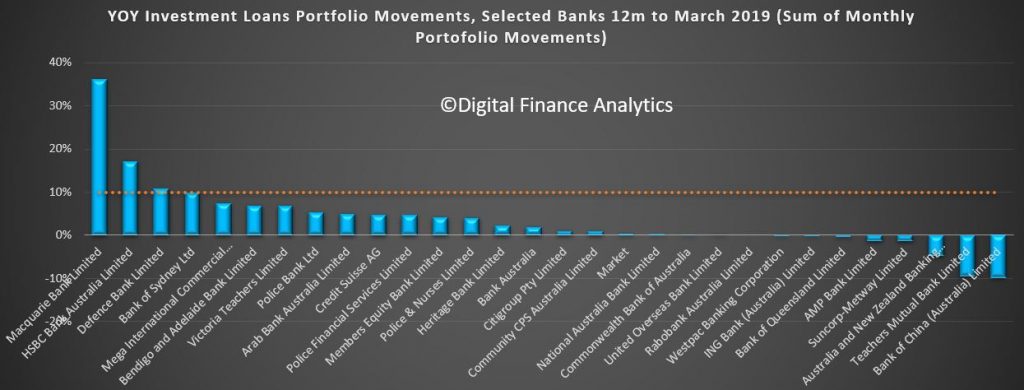
Investment lending growth over the past 12 months has been anemic, but some lenders such as Macquarie are making hay. Of course the old 10% speed limit from APRA has gone now, but the relative growth highlights the fact that the four majors are well below market growth levels – and ANZ the weakest (which is why they said they wanted to lend more).

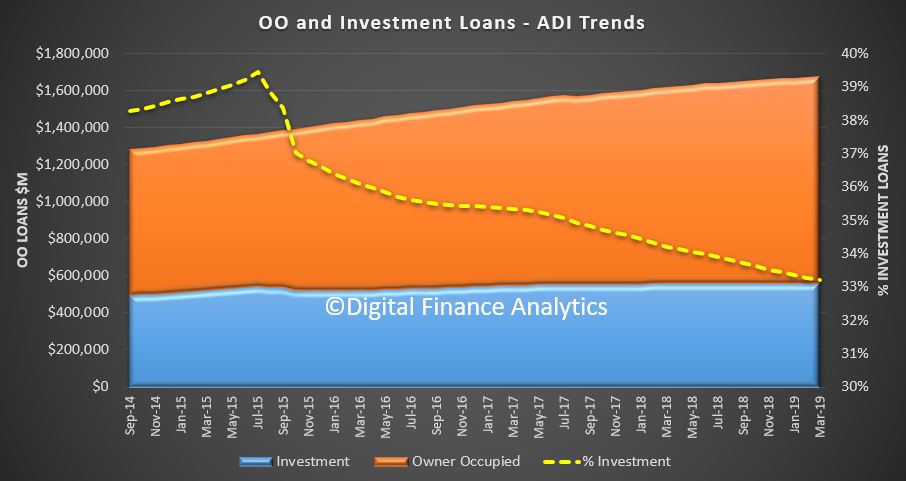
So finally, the total ADI lending book is at $1.68 trillion dollars, with owner occupied loans comprising $1.12 trillion dollars and investment loans $557 billion dollars, and comprising 33.2% of the portfolio – as the ratio continues to fall.

In conclusion, the credit impulse – the rate of change of credit being written is the most significant forward indicator of house price trajectory. The weak state of the market suggests more and significant price falls ahead. Yet despite all this, household debt will continue to rise. There is absolutely no reason to loosen lending requirements, or drop the hurdle rate on these numbers. More households will get into trouble ahead.